In my last post, I talked about the ritual that I go through every year ahead of my teaching each spring, and in this one, I will start on the first of a series of posts that I make at the start of each year, where I look at data, both macro and company-level. In this post, I will provide a motivation, if you need one, for why I create and share the data updates, followed up by a description of my data sample, which includes publicly traded companies listed and traded across the world, as well as the data variables that I estimate and report.
Data: Trickle to a Flood!
It is perhaps a reflection of my age that I remember when getting data to do corporate financial analysis or valuation was a chore. To obtain company-level information, you needed to find its annual reports in physical form and for industry-level data, you were dependent on services that computed and reported industry averages, such as Value Line and S&P. The times have changed, and if there is a problem now, it is that we have too much data, rather than too little. As I noted in my posts on data disclosure last year, this has led to at least three unhealthy developments.
- Data distractions: Faced with massive amounts of data, quantitative as well as qualitative, many investors and analysts find themselves distracted by immaterial, irrelevant and sometimes misleading data points along the way.
- Data as a crutch: At the other extreme, there are some who believe that they answer to every question lies in the data, and that when seeking an input for valuation and corporate financial analysis, the data will provide it. Rather than make their best judgments or reason their way, when faced with estimation challenges, these investors and analysts embark on a search for more data, and if they do not find that data, they give up.
- Data bias: There is the canard that data is objective, as opposed to estimates or judgments, which are considered subjective. That is not true! In my experience, data is malleable, and if there is enough of it at your disposal, you can screen it and selectively choose the data to support whatever viewpoint you want to advance.
During the course of my corporate finance and valuation journey, I have been guilty of all three of these sins, and it is to counter these pre-dispositions that I started spending the first week of every year looking at data with four objectives:
- Get perspective: One of the challenges that anyone doing business analysis, investing or valuation faces is getting a measure of what comprises a reasonable value for a business metric. Thus, without a sense of what comprises a high or low profit margin for a firm, or what the cost of capital is for the typical company, it is easy to create "fairy tale" valuations and analyses. By the same token, it is impossible to use a pricing metric (PE or EV to EBITDA), without a sense of the cross sectional distribution of that metric at the time.
- Mean reversion: I am not a knee-jerk believer in mean reversion, but the tendency for numbers to move back towards averages is a strong one. That said, to use mean reversion in analysis or investing, you need to know what these averages are, either over time or across companies, and data can help in that pursuit.
- Counter made-up numbers: It remains true that people (analysts, market experts, politicians) often make assertions based upon either incomplete or flawed data, or no data at all. For instance, is it true, as some assert, that inflation was high last year because companies raised prices to increase profits? Or, do US companies pay far less in taxes than companies incorporated in the rest of the world? Rather than indulge in endless debates, where each side provides anecdotal evidence, data can prove to be the tie-breaker.
- Check rules of thumb: Investing and corporate finance are full of rules of thumb, many of long standing. For example, I have seen it asserted that a stock that trades at less than book value is cheap or that a stock that trades at more than twenty times EBITDA is expensive. These assertions may very well be true, but cheap and expensive, at least in pricing terms, is relative, and looking at the data can help you detect rules of thumb that work from those that do not.
When valuing or analyzing a company, I find myself looking for and using macro data (risk premiums, default spreads, tax rates) and industry-level data on profitability, risk and leverage. Rather than collecting this data each time I do an analysis, I realized that having these numbers computed and ready to go ahead of the analysis not only saves me time, but also allows me to focus more on the company that I am valuing and analyzing. I also realized that while these numbers are useful to me, they could be useful to others doing analysis as well, and I could not think of a single reason not to share what I had on hand.
Data: Sources and Description
My first attempt at sharing data was in 1997, and it was limited to about a dozen data sets, all related to US companies, and I never expected very many people to use my data. That has changed, and this year, I am posting two hundred data sets, including more than a thousand data items, and extended the coverage to global companies. While I hope that you find this data useful, I also hope that you will spend a few minutes reading what I have to say about the companies that comprise my data universe, the data items I report on, the timing of the data and caveats.
Data Universe and Grouping
At first sight, computing an industry average seems like a simple computation, where you take individual company numbers in an industry group and average them out. However, embedded in this statement are multiple estimation choices that you have to make that affect the reported numbers, and it behooves me to describe my choices:
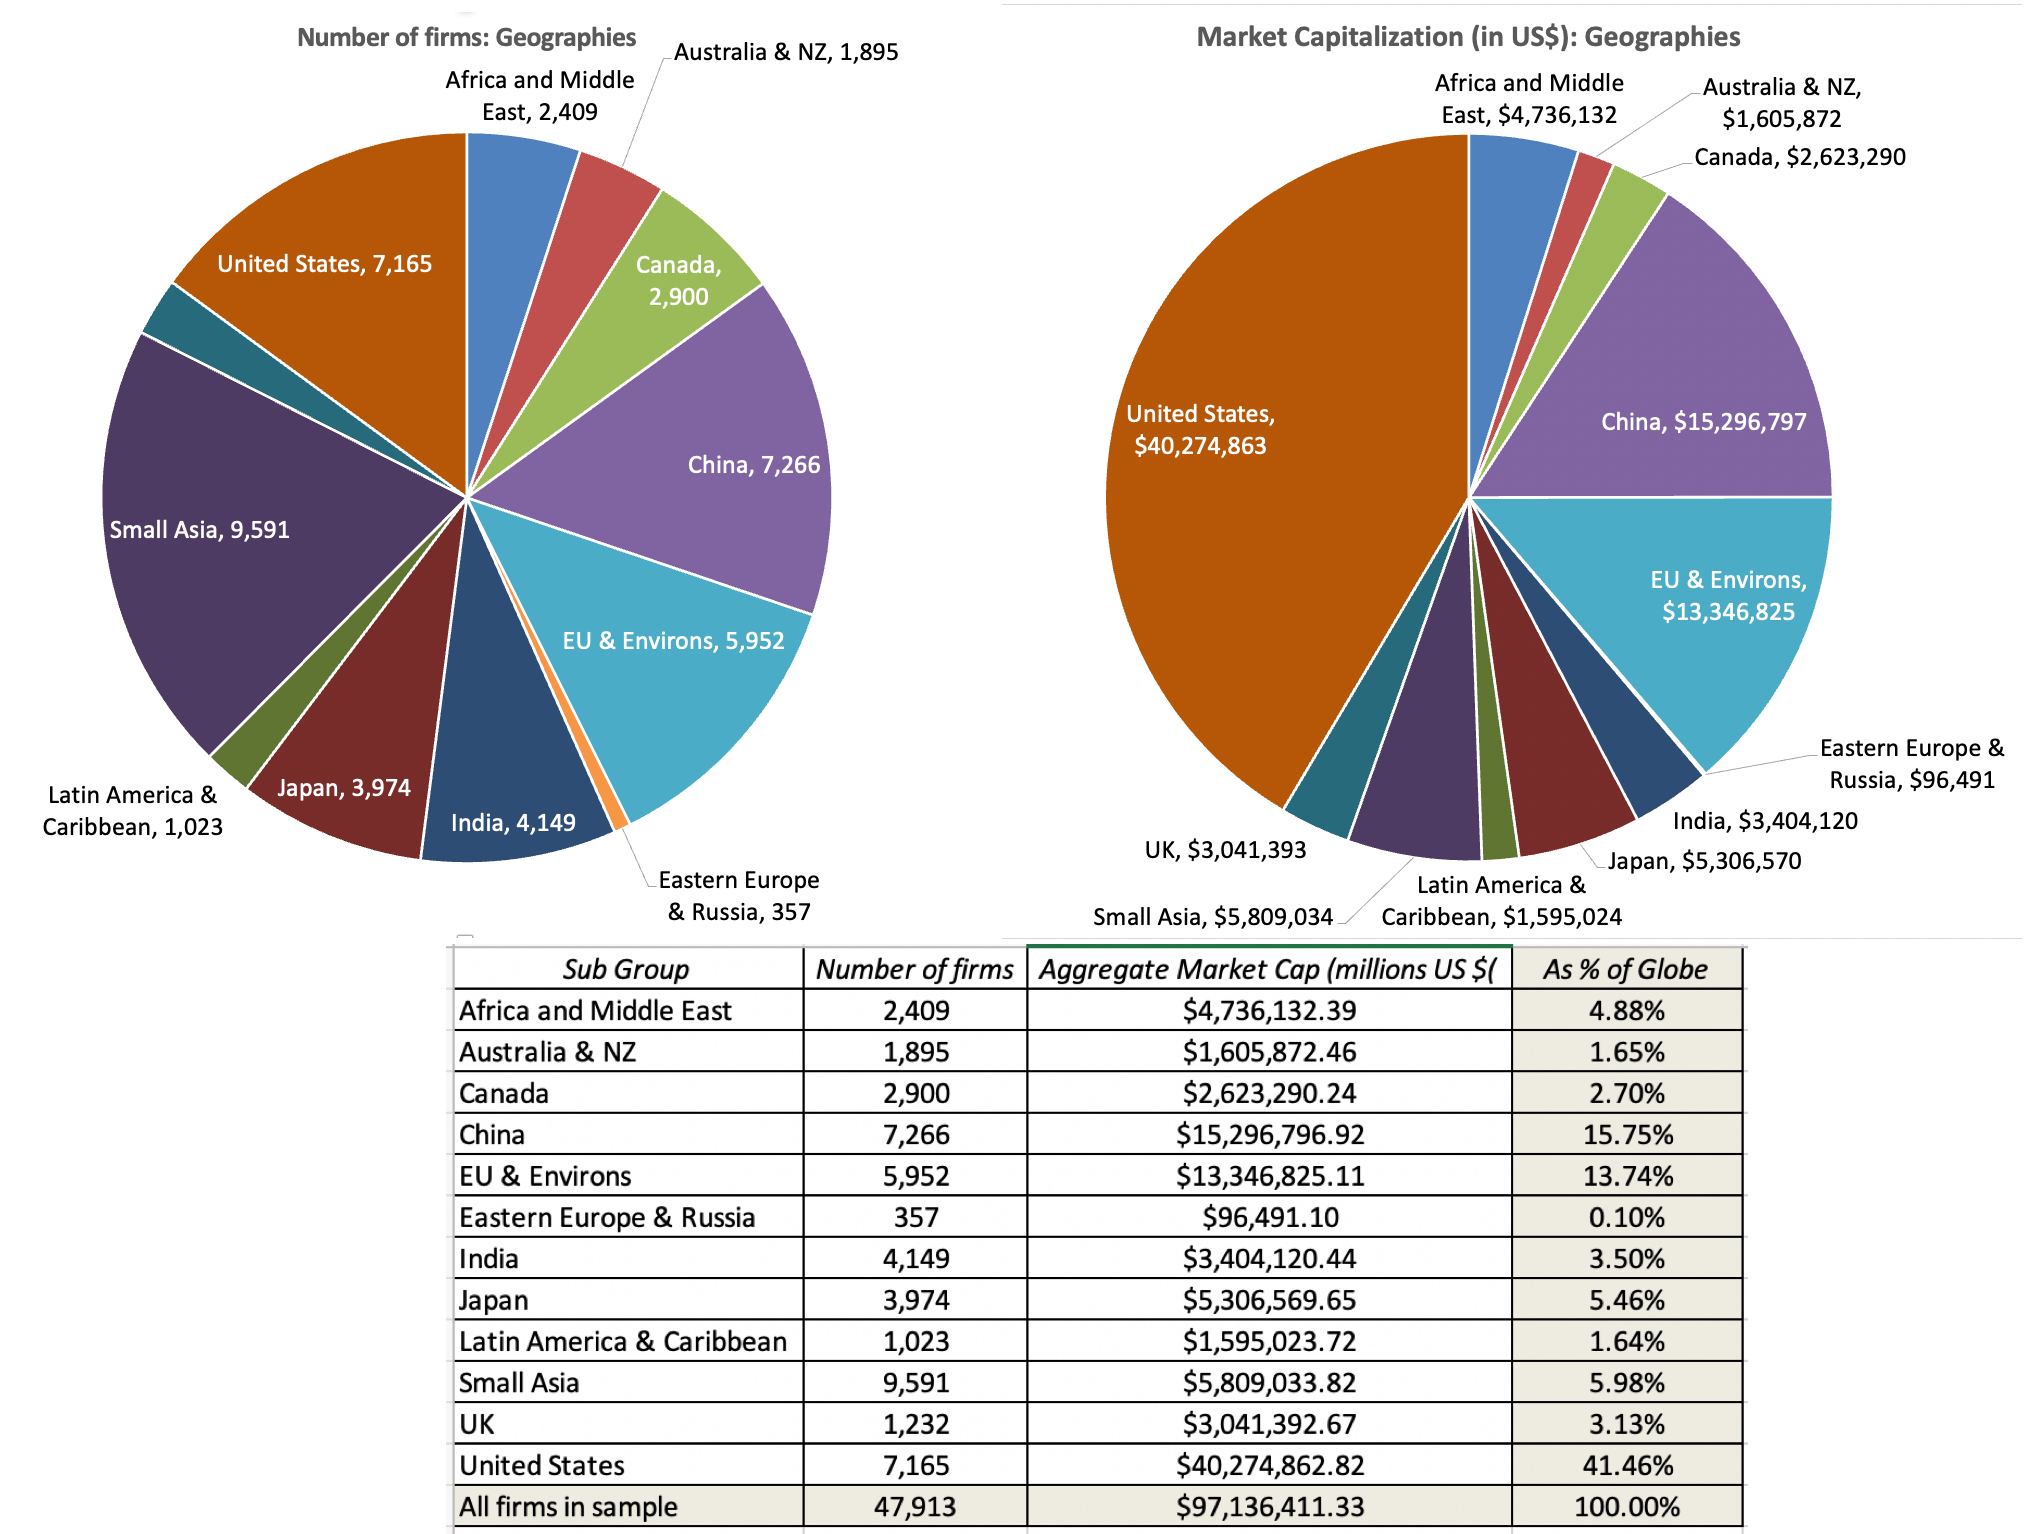
1. Data universe: In my sample, I include all publicly traded firms with market capitalizations that exceed zero, traded anywhere in the world. While there are risks bringing in very small and lightly-traded companies, with shaky data, into the sample, I include them to avoid the biases that will be created in industry averages by looking at just larger publicly traded companies, or just US-listed companies. In January 2023, I ended up with 47,913 publicly traded firms in my sample, with the pie chart below providing a geographic breakdown.
Speaking of biases, I do exclude privately owned (non-listed) companies for two reasons. The first is that in much of the world, these companies are not required to make their financial statements public, thus making it impossible to get the data. The second is that for data items that require market prices, including all the pricing metrics, private businesses cannot be included, since they have no market values.
2. Sectors and Industries: To make data useful for corporate financial analysis and valuation, I break the companies down into groupings, based upon the sectors and industries that they operate in. For the former, I use S&P's sector categorization and for the latter, I create 95 industry groups, built to allow users of my data to compare statistics over time. The sector breakdown of my overall sample is reported below:

My industry groupings are open to questioning for many reasons. First, for multi-business companies, I use the company's primary business (in terms of revenues) for categorization. Second, for some companies, it is not clear what industry group best fits the company. Thus, for Apple, it is unclear whether to put the company into company hardware, reflecting its history as a computer maker, or telecommunication equipment, reflecting its current dependence on the iPhone.
Data Items
Much of my focus, when it comes to data, is on company-specific variables, rather than macro economic data, for two reasons. The first is that there are other and much better sources for raw macroeconomic data than mine, and my favorite remains. Federal Reserve Economic Data (FRED): This is hands down, in my view, the best site for macroeconomic data in the world. While its focus is naturally on the US economy, inflation and rates, there is data for the rest of the world as well. I do report on a few market-wide data items especially on risk premiums for both equity and debt. The second is that in my line of work, which is corporate finance and valuation, the numbers I need lie in micro or company-level data, not in the macro space.
At the company-level, I provide data on risk, profitability, leverage and dividends, broken down by industry-groups, to be used in both corporate finance and valuation. I also report on pricing statistics, again broken down by industry grouping, with equity (PE, Price to Book, Price to Sales) and enterprise value (EV/EBIT, EV/EBITDA, EV/Sales, EV/Invested Capital) multiples. The table below shows a subset of the data items that I have on my website, with the links to the US versions of the data sets, in html. To get to the excel versions of this data, or the excel versions by region (Emerging Markets, Europe, Australia & Canada, Japan) as well as globally, please go the current data page of my website:
If you are interested in the archived data from prior years, you can get them by going to this link. For a description of the variables (and how I compute them), please try this link.
Data Timing
There is one final estimation detail that needs clarification. I did my updates in the last week (January 1- January 5, 2023), and used the most updated data that I could find on each company.
- For market data, where the updating is continuous, that is data as of the January 1, 2023. Thus, market capitalization, interest rates and risk premiums, the data is as of that date.
- For accounting flow items, in income statements and statements of cash flows, such as revenues, earnings and expenses, I used the data in the most recent twelve months of reporting; for most firms, that data is from October 2021 to September 2022.
- For accounting stock items, from balance sheets, I use the numbers from the most recent balance sheet; again, for most firms, the numbers are from the balance sheets, as of September 30, 2022 or the most recent quarterly statements.
While these timing differences may strike some as inconsistent, they do meet my timing consistency test, which is that they are the most updated numbers that decision-makers (CFOs and investors) would have as of January 1, 2023.
Data Caveats
I have no qualms about sharing my data, since there is nothing particularly original or unique about what I do, and I am glad that there are some to whom the data is proving useful. If I save analysts and investors time in their decision making, I consider the time spent on my data analysis to have earned its required returns and more. Given the wide range of uses to which my data is put, I do have some caveats on its usage.
- Mistakes and Errors: I am a team of one, reflecting more my desire for control that unwillingness on the part of others to help. That said, working with a data sheet with 47,913 companies and hundreds of data items can get daunting, as is updating individual excel sheets, by variable and region. If you find a mistake or mistakes, please bring it to my attention and I will fix it.
- Judgment calls: I have made judgment calls starting with my creation of industry groups (which you may not like) and my assignment of companies into groups. Some take issue with my regional classifications, arguing that Mexico should be North America (geographically, you are absolutely right) rather than in Latin America (which is where I put it).
- Company-level data: I do not provide company-level data for two reasons. One is that it would violate agreements that I (or NYU) have with my raw data providers and the other is that getting company-level data has become trivial. I know that most of you cannot afford a Bloomberg terminal or S&P Capital IQ, but you can get the data not just from Yahoo! Finance but also from a variety of online data services that are affordable and very well done.
- Agenda: If you are using my data to advance a point of view that you hold, you are welcome to do so, but please be clear that this is your reading of my data, not mine. If you are in a fight (legal or online) and using my data as ammunition, you are entirely on your own, and I will not enter the fight on either side, unless you have a clarification question.
- Staleness: I update my data once a year, and I will not return to do an update until January 2024; the equity risk premiums for the US will get updated every month and the equity risk premiums for other countries will get a mid-year update. While I have no compunctions continuing to use industry averages for risk, profitability and leverage over the course of the year, the pricing metrics (PE, EV/EBITDA etc.) will become dated as the year goes on, and especially so if the market moves up or down significantly.
You owe nothing to me for the data, and if it does get you into trouble, feel free to blame me. If you really want to offer something in return, the best favor you can do for me is to help someone else out there.
The Posts to come
In the posts to come, I will talk about what the numbers tell us about the state of the market and the companies that inhabit them, as of the start of 2023. It is undeniable that 2022 was a tumultuous year, with inflation taking center stage, and driving markets. In my next three posts, I will look at inflation's effects on equity markets (in post 2), government and corporate bond markets (in post 3) and other asset classes (real estate, collectibles and cryptos). For those who had become somnolent about country risk, the year provided a reminder of how quickly country risk can flare up and change, with Russia's invasion of Ukraine a precipitating factor, and in my fifth post, I will look at the evolution of country risk during the year. In the three posts that follow, I will look at the shifts in corporate hurdle rates (in post 6), debt loads and worries (in post 7) and dividends/cash returned in post 8. In the ninth post, I will look at how market pricing changed during 2022, across sectors/industries (with technology taking the biggest hit) as well as across growth and corporate life cycles. There is always the chance that I will get distracted along the way, since I want to value Tesla later this month and return to my FANGAM valuations in February!
YouTube Video
Links
No comments:
Post a Comment
Given the amount of spam that I seem to be attracting, I have turned on comment moderation. I have to okay your comment for it to appear. I apologize for this intermediate oversight, but the legitimate comments are being drowned out by the sales pitches and spam.