In the midst of a crisis, it is very difficult to think about life in its aftermath, but there will come a time, when investors and companies will shift their focus. To be able to do so, they have to survive the crisis, and for many companies, that has become the immediate challenge. In the last post, I looked at one factor that will determine survival risk, and that is the buffer than companies have on growth, profitability and reinvestment, with companies in higher margin businesses being more protected than companies in businesses with slim or negative margins. In this one, I look at the other factor that will determine survival and that is the debt burden on firms, since companies with higher debt burdens, other things remaining equal, will be more exposed to failure and distress than companies without those burdens. I will look at the degree of indebtedness of companies around the world, broken out by industry and region, partly with an eye on assessing how much danger they are exposed to right now, as their near term business prospects collapse, and partly to see which firms, industries and regions are best positioned to make it through this crisis.
The Debt Trade Off
The question of how much a firm should borrow is one of the three questions that comprise corporate finance, but there are a number of delusions about debt that need to be dispelled first. The picture below, that I also used in last year's debt update captures what I term the "illusory benefits" of debt:

Thus, the argument that borrowing money lowers your cost of capital, just because it costs less to borrow than to raise equity, does not hold up, since the risk from the investments taken with the capital raised remain unchanged, no matter what the debt mix. The counter argument that you should never borrow money, since borrowing money will lower your net income, misses the fact that borrowing money to fund a company leads to fewer shares outstanding.
The real trade off on debt is determined by the tax benefits that are endowed on debt by tax law in much of the world, with interest expenses being tax deductible and cash flows to equity not, and the offsetting effects of expected distress costs, low for firms with stable, predictable earnings and in good economic times, and high for firms with more unstable earnings and more unstable economic settings. There are a couple of secondary factors, with debt acting as a mechanism to keep managers from taking investments that are bad enough to put the company's survival (and management jobs) at risk and the costs associated with managing the conflict of interests between stockholders and bondholders.

This trade off, intuitive and simple, can be a powerful device for making predictions about what should happen to the use of debt over time. In the United States, for instance, the corporate tax reform act of 2017, in addition to lowering the federal corporate tax to 21% from 35, also put limits on interest deductions, thus making debt significantly less beneficial to companies. Even before this crisis hit, there were questions about whether a long stretch of good times for companies had made them too complacent about distress risks and expected bankruptcy costs, and now after the crisis, there is no debating that many companies have too much debt, given near term earnings and perhaps even long term earnings.
The Debt Burden
As companies scramble to get out from under their debt burdens, they will face challenges, and to see the magnitude of the tasks they face, I will chronicle how much debt was held across the world at the start of 2020. I will also break the debt down by region, and by industry, to see how steep the climb will be for companies, and to assess which sectors have the largest capacity to withstand the earnings shocks that are sure to come.
Defining Debt
As a prelude to assessing the debt burden at companies, I want to start by deciding what to include in debt. For those who trust accountants, this may seem redundant, given that there is a debt number listed on balance sheets, reflecting what companies owe at least on the date of the statement. As someone who does not share that trust, I use a two-part test to determine whether to include a claim in debt or not:- Does the claim give rise to a contractual commitment that you have to meet in good times and in bad?
- If you fail to meet that commitment, are there consequences that result in the business shutting down or assets being controlled by lenders?
- All interest bearing debt, short term as well as long term, floating or fixed, meets the requirements for debt.
- Accounts payable and supplier credit don't meet that test, because they do not have explicit interest expenses; to the extent that you get less favorable terms or lose a discount by using supplier credit, there are implicit interest expenses, and if you are willing to make those explicit, they can be treated as debt.
- All lease commitments are debt, though we can debate the maturity of the commitment (based upon escape clauses and renewal terms in the leases) and whether it is secured or unsecured debt. In fact, converting lease commitments to debt is a simple present value exercise, where the contractual commitments for future years are discounted back to today using the pre-tax cost of debt as the discount rate, a practice that I have followed all through my valuation years. Until 2019, accountants followed a misguided practice, allowing companies to categorize leases, based upon whether they had ownership of the asset, into operating and capital leases, with only the latter being treated as debt. In the process, operating leases became the biggest source of off-balance sheet debt for retailers, restaurants and other big lessees. In 2019, both GAAP (FASB 842) and IFRS (IAS 16) came to their senses and required companies to treat all leases as debt, creating a significant change in balance sheet debt at many companies. Later in this post, I will compare my calculations of lease debt to the accounting lease debt, to probe differences.
There are different measures of the debt burden, with each measure serving a different purpose. Broadly speaking, these measures can either look at debt as a percent of the total capital invested in business or look at debt payments due, relative to earnings and cash flows of the company. The first becomes an input into hurdle rates and the latter becomes a measure of the buffer against downturns and crisis:

To the extent that having cash on your balance sheet offsets some of the debt burden, you can compute all of these measures, using net debt ratio (where cash is netted out against total debt) and net interest expenses (where interest income from cash is netted out from interest expenses). Note that the two approaches measuring debt can give different signals. Thus, a company can have a low debt ratio (as a percent of capital, in either book value or market value terms), an indicator of a low debt burden, while having dangerously low interest coverage ratios and high debt as a multiple of EBITDA. The table below captures the possible combinations:

Note that the predictably of revenues and earnings brings an additional dimension brought into the comparison. To the extent that some companies have more predictable earnings than others, because they sell more non-discretionary products and services, they are less exposed to risk than other companies, with similar debt burdens; a discount retailer with a debt to EBITDA multiple of four is safer than a luxury retailer with a debt to EBITDA multiple of four.
Interest Bearing Debt & Lease Commitments in 2020
I begin by looking at debt burdens, relative to both book and market capital, across the world. In making this assessment, note that I have done the following:
- I have counted all interest bearing debt, as reported by the company, on its most recent financial statements. I use this book value of debt as roughly equivalent to the market value of debt, because much of the debt taken by companies taken by companies is in the form of bank loans, and there is no observable market value. While there are ways of converting book value of debt to market value of debt, they require inputs on debt maturity that are not available for many companies.
- I have computed the lease debt, using lease commitments and an estimated cost of debt for each company, rather than trust the accounting estimates of this debt, at least for 2019. That is partly because the rule change applies only to those sections of the world that are covered by IFRS and GAAP and partly because I don't trust accountants yet, on this measure.
- To compute the net debt, I subtract out the cash and marketable securities that the company reports on its latest financial statements.
- Since debt to a financial service firm is more raw material than capital, and determining what comprises debt is almost an unsolvable puzzle, I have excluded banks, insurance companies and brokerage firms/investment banks from my sample.
 |
| Download spreadsheet |
On a book capital basis, US companies have the highest proportion of debt, but relative to market value, Canadian companies have the most debt. Across global non-financial service companies, total debt is about 34% of market capital and 49% about book capital. Doing the same analysis across industries, again excluding financial service firms, the ten industries with the highest debt to market cap ratios and the ten with the lowest are listed below:
 |
| Download spreadsheet |
Notice the preponderance of technology firms on the least levered list and the bunching up of infrastructure and manufacturing companies on the most levered list. All of the numbers reported above for debt include my estimate of the lease debt, and since the accounting rule changes this year have brought lease debt on to balance sheets, I can compare my estimates to the accounting numbers. For non-financial firms collectively, my estimate of lease debt is about 60% higher in the aggregate that the accounting estimates, reflecting partly the additional information that accountants have on lease specifics that I do not, partly the fact that there are segments of the world where leases are still not treated as debt and partly the complexity of accounting rules on lease debt.
Earnings and Cashflow Coverage
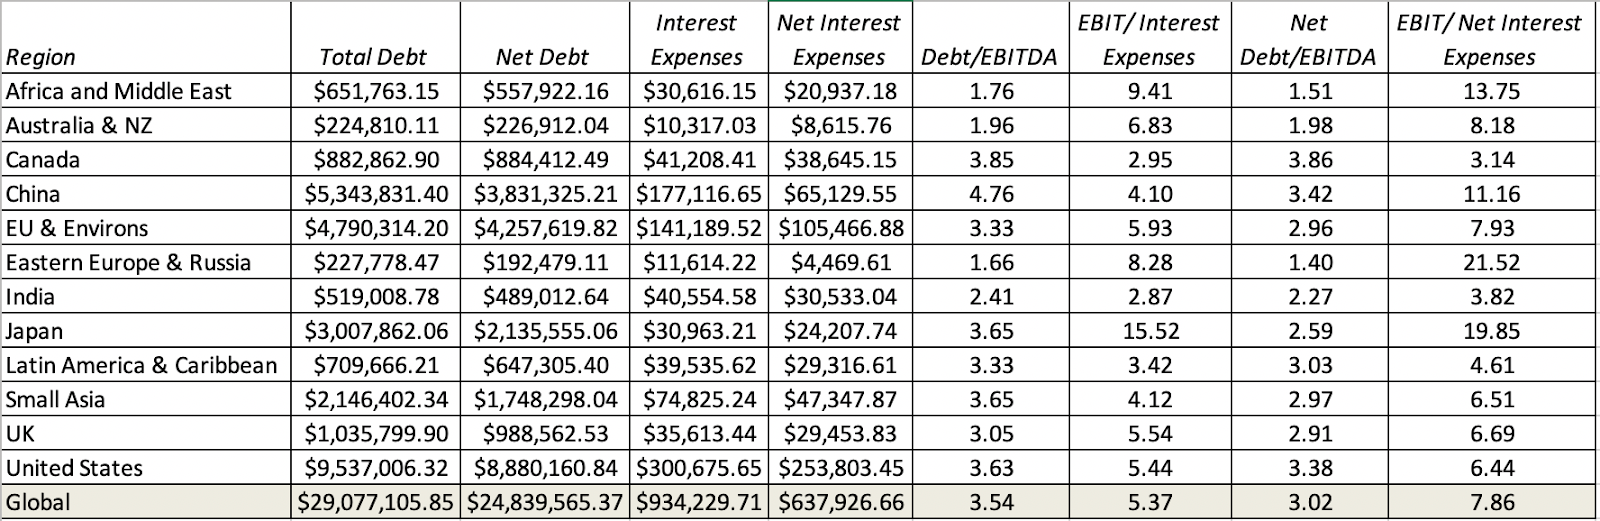
As we noted earlier, companies that look lightly levered, when debt is measured against capital, can still face a significant burden if their earnings and cash flows are insufficient to meet debt payments. In the table below, I look at the regional differences on debt as a multiple of EBITDA and interest coverage ratios:
 |
| Download spreadsheet |
With the caveat that the EBITDA and operating income numbers are from 2019 and do not reflect the damage that is going to be caused by the Virus, companies in Africa/Middle East and Eastern Europe have the least debt, relative to EBITDA, but Japanese companies have the most buffer, based upon interest coverage ratio. Canadian and Indian companies have the least buffer, on an interest coverage ratio basis. Extending this analysis to industries and looking at the ten industries with the most buffer and the ten with the least:
 |
| Download spreadsheet |
While most of the firms in the most buffered list mirror the earlier ranking based upon low debt levels, the presence of integrated oil and oil production companies indicates how transient these buffers may be, since the dramatic drop in oil prices in the last few weeks will ravage the EBITDA and operating income numbers at these companies. Among the least buffered list are utilities, which may be able to weather the storm with stable revenues, and a number of real estate related industries, which will be exposed if real estate values drop. At the top of the list of the most exposed industries are investment and asset management companies, reflecting both their access to and use of debt to accentuate returns to equity investors.
Lessons from a Crisis
Every crisis teaches investors and companies lessons that are temporarily learned, but quickly forgotten. This one is a reminder to firms that debt, while making good times better for equity investors, makes bad times worse. For some of these firms, that debt will threaten their continued existence and result in liquidations, fire sales and distress. For others, it will create constraints for the near future on growth and investment, and change business plans. For firms that are lightly burdened, it may create opportunities, as they use their liquidity as a strategic weapon to fund acquisitions and to increase market share. If you were worried about winner take all markets before this crisis, you should be doubly worried now!
YouTube Video
Datasets
No comments:
Post a Comment