Showing posts with label Intrinsic Value. Show all posts

Friday, October 6, 2023

Invisible, yet Invaluable: Valuing Intangibles in the Birkenstock IPO!

A few days ago, I valued Instacart ahead of its initial public offering, and noted that the reception that the stock gets will be a good barometer of where risk capital stands in the market, right now. After a buzzy open, when the stock jumped from its offering price of $30 a share to $42, the stock has quickly given up those gains and now trades at below to its offer price. In this post, I will look at another initial public offering, Birkenstock, that is likely to get more attention in the next few weeks, given that it is targeting to go public at a pricing of about €8 billion, for its equity, in a few weeks. Rather than make this post all about valuing Birkenstock, and comparing that value to the proposed pricing, I would like to use the company to discuss how intangible assets get valued in an intrinsic valuation, and why much of the discussion of intangible valuation in accounting circles is a reflection of a mind-set on valuation that often misses its essence.

The Value of Intangible Assets

    Accounting has historically done a poor job dealing with intangible assets, and as the economy has transitioned away from a manufacturing-dominated twentieth century to the technology and services focused economy of the twenty first century, that failure has become more apparent. The resulting debate among accountants about how to bring intangibles on to the books has spilled over into valuation practice, and many appraisers and analysts are wrongly, in my view, letting the accounting debate affect how they value companies.    

The Rise of Intangibles

    While the debate about intangibles, and how best to value them, is relatively recent, it is unquestionable that intangibles have been a part of valuation, and the investment process, through history. An analyst valuing General Motors in the 1920s was probably attaching a premium to the company, because it was headed by Alfred Sloan, viewed then a visionary leader, just as an investor pricing GE in the 1980s was arguing for a higher pricing, because Jack Welch was engineering a rebirth of the company. Even a cursory examination of the the Nifty Fifty, the stocks that drove US equities upwards in the early 1970s, reveals companies like Coca Cola and Gilette, where brand name was a significant contributor to value, as well as pharmaceutical companies like Bristol-Myers and Pfizer, which derived a large portion of their value from patents. In fact, IBM and Hewlett Packard, pioneers of the tech sector, were priced higher during that period, because of their technological strengths and other intangibles.  Within the investment community, there has always been a clear recognition of the importance of intangibles in driving investment value. In fact, among old-time value investors, especially in the Warren Buffet camp, the importance of having "good management' and moats (competitive advantages, many of which are intangible) represented an acceptance of to how critical it is that we incorporate these intangible benefits into investment decisions.

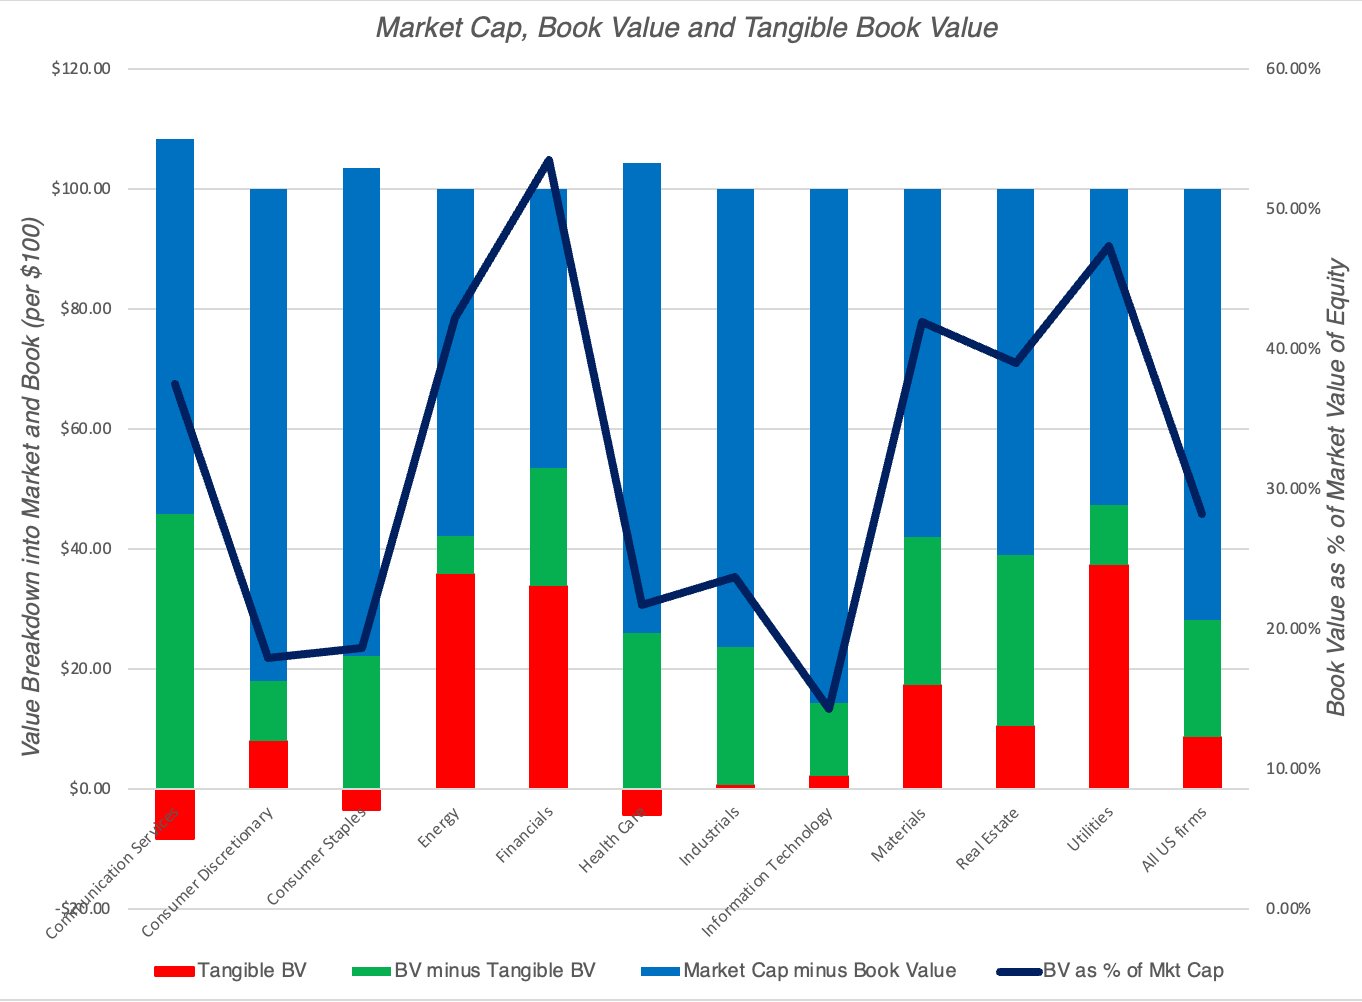
   With that said, it is clear that the debate about intangibles has become more intense in the last two decades. One reason is the perception that intangibles now represent a greater percent of value at companies and are a significant factor in more of the companies that we invest in, than in the past. While I have seen claims that intangibles now account for sixty, seventy or even ninety percent of value, I take these contentions with a grain of salt, since the definition of "intangible" is elastic, and some stretch it to breaking point, and the measures of value used are questionable.  A more tangible way to see why intangibles have become a hot topic of discussion is to look at the evolution of the top ten companies in the world, in market capitalization, over time:


In 1980, IBM was the largest market cap company in the world, but eight of the top ten companies were oil or manufacturing companies. With each decade, you can see the effect of regional and sector performance in the previous decade; the 1990 list is dominated by Japanese stocks, reflecting the rise of Japanese equities in the 1980s, and the 2000 list by technology and communication companies, benefiting from the dot-com boom. Looking at the top ten companies in 2020 and 2023, you see the dominance of technology companies, many of which sell products that you cannot see, often in production facilities that are just as invisible.
   The other development that has pushed the intangible discussion to the forefront is a sea change in the characteristics of companies entering public markets. While companies that were listed for much of the twentieth century waited until they had established business models to go public, the dot-com boom saw the listing of young companies with growth potential but unformed business models (translating into operating losses), and that trend has continued and accelerated in this century. The graph below looks at the revenues and profitability of companies that go public each year, from 1980 to 2020:

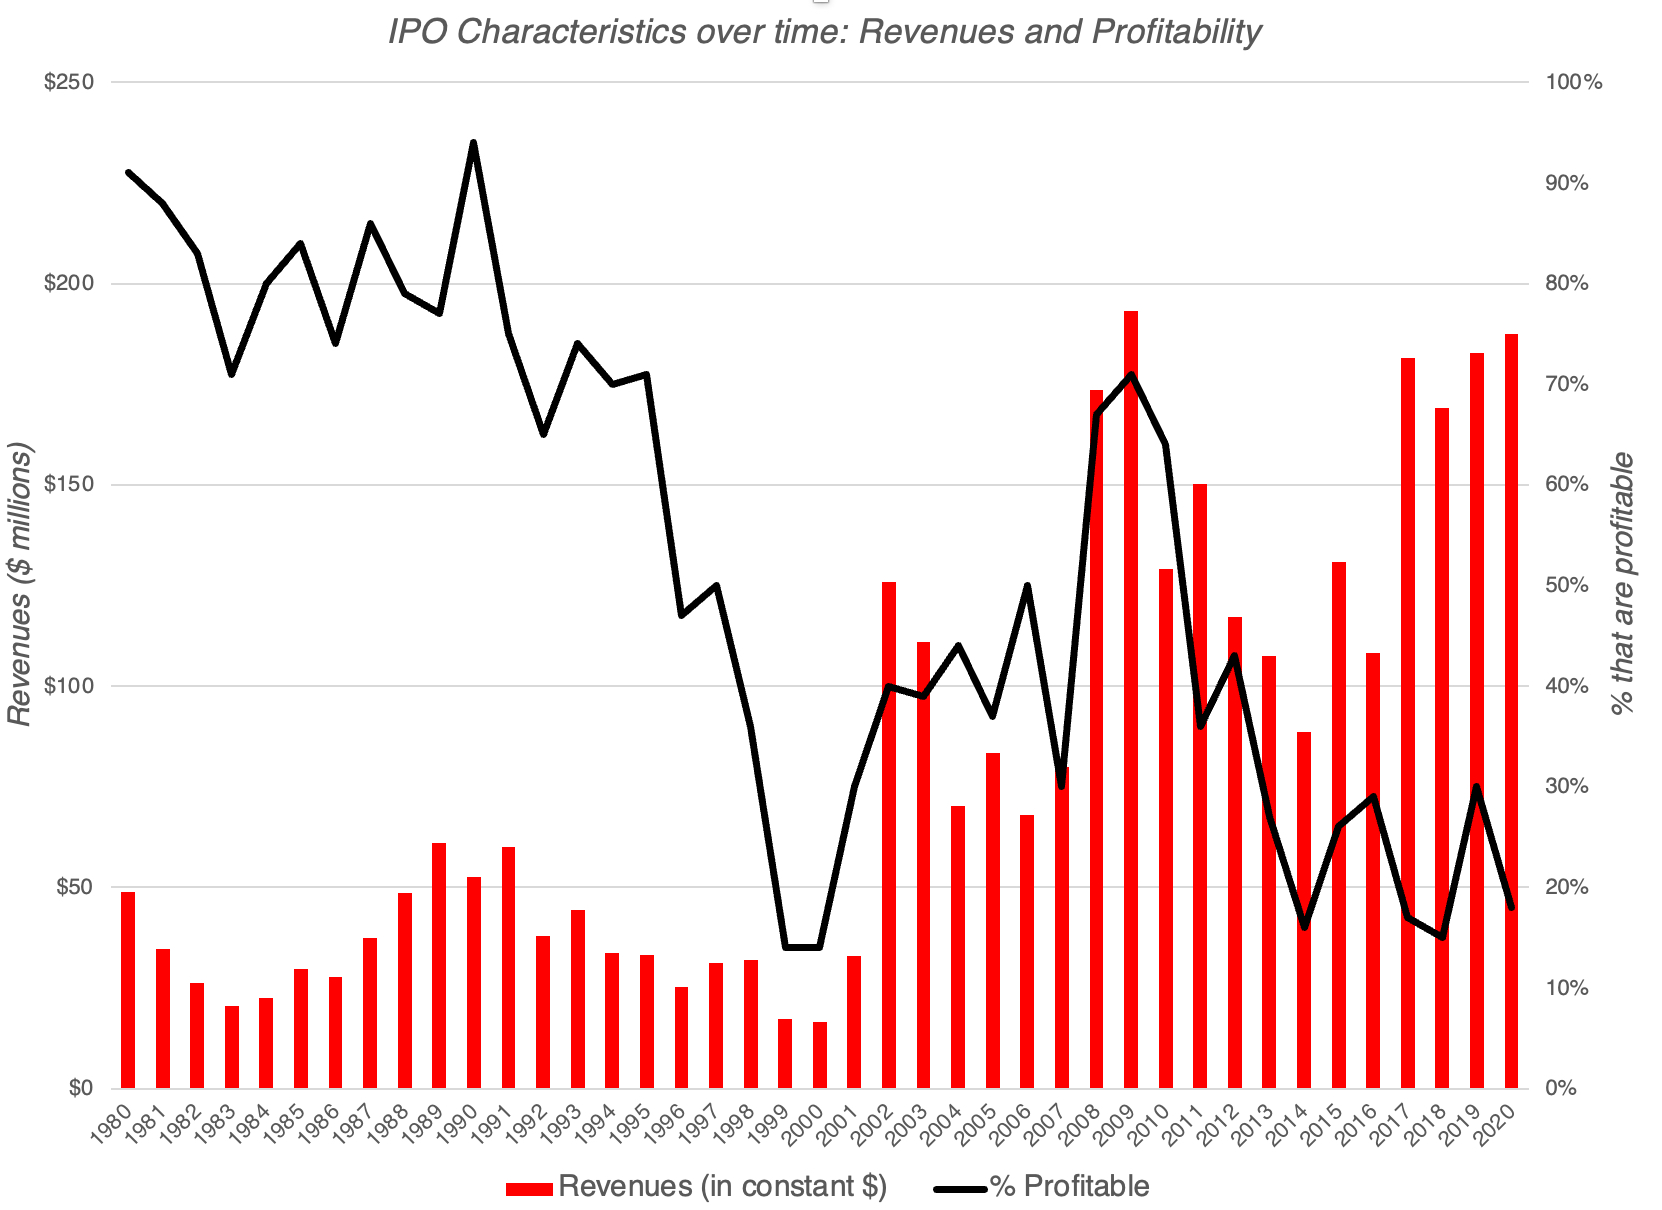
As you can see, the percent of money-making companies going public has dropped from more than 90% in the 1980s to less than 20% in 2020, but at the same time, while also reporting much higher revenues, reporting the push by private companies to scale up quickly. In valuing these companies, investors and analysts face a challenge, insofar as much of the values of these firms came from expectations of what they would do in the future, rather than investments that they have already made. I capture this effect in what I call a financial balance sheet:

While you can value assets-in-place, using historical data and the information in financial statements, in assessing the value of growth assets, you are making your best assessments of investments that these companies will make in the future, and these investments are formless, at least at the moment. 

The Accounting Challenge with Intangibles

    The intangible debate is most intense in the accounting community, with both practitioners and academics arguing about whether intangibles should be "valued", and if so, how to bring that value into financial statements. To see why the accounting consequences are likely to be dramatic, consider how these choices will play out in the balance sheet, the accountants' attempt to encapsulate what a business owns, what it owes and how much its equity is worth. 


There are inconsistencies in how accountants measure different classes of assets, and I incorporate them into my picture above, leaving the intangible assets section as the unknown: Any changes in accounting rules on measuring the value of intangibles, and bringing them on the balance sheet, will also play out as changes on the other side of the balance sheet, primarily as changes in the value of assessed or book equity. Put simply, if accountants decide to bring intangible assets like brand name, management quality and patent protection into asset value will increase the value of book equity, at least as accountants measure it, in that company.
    In their attempt to bring intangible assets on to balance sheets, accountants face a barrier of their own creation, emanating from how they treat the expenditures incurred in building up these assets. To understand why, consider how fixed assets (such as plant and equipment and equipment) become part of the balance sheet. The expenditures associated with acquiring these fixed assets are treated as capital expenditures, separate from operating expenses, and only the portion of that expenditure (depreciation or amortization) that is assumed to be related to the current year's operations is treated as an operating expense. The unamortized or un-depreciated portions of these capital expenses are what we see as assets on balance sheets.  The expenses that result in intangible asset acquisitions are, for the most part, not treated consistently, with brand name advertising, R&D expenses and investments in recruiting/training, the expenses associated with building up brand name, patent protection and human capital, respectively, being treated as operating, rather than capital, expenses. As a consequence of this mistreatment, I have argued that not only are the biggest assets, mostly intangible, at some companies kept off the balance sheet, but their earnings are misstated:

There are ways in which accounting can fix this inconsistency, but it will result in an overhaul of all of the financial statements, and companies and investors balk at wholesale revamping of accounting numbers (EBITDA, earnings per share, book value) that they have relied on to price these firms.
    So, how far has accounting come in bringing intangible assets on to balance sheets? One way to measure progress on this issue is to look at the portion of the book value of equity at US companies that comes from tangible assets, in the chart below:

Looking across all US firms from 1980 to 2022, the portion of book value of equity that comes tangible assets has dropped from more than 70% in 1998 to about 30% in 2022. That would suggest that intangible assets are being valued and incorporated into balance sheets much more now than in the past. Before you come to that conclusion, though, you may want to consider the breakdown of the intangible assets on accounting balance sheets, which I do in the graph below:


Over the last 25 years, as intangible assets have risen in value, goodwill has been, by far, the biggest single component of that value, accounting for about 60% of all intangibles on US corporate balance sheets; the jump in 2001 came from a change in accounting rules on acquisitions, when pooling was banned and companies were forced to recognize goodwill on all acquisitions. So what? I have long argued that goodwill is not an asset, intangible or not, but more a plug variable, signifying the difference between the price paid to acquire a target company and its book value, with adjustments for fairness, and designed to make balance sheets balance. Thus, much of the talk about intangibles in accounting has been just that, talk, with little of real consequence for balance sheets. 
    There is another measure that you can use to see the futility, at least so far, of accounting attempts to value intangibles. In the graph below, I look at the aggregated market capitalization of companies, in 2022, which should incorporate the pricing of intangibles by the market, and compare that value to book value (tangible and intangible), by sector, reflecting accounting attempts to value these same intangibles.


The sectors where you would expect intangible assets to be the largest portion of value are consumer products (brand name) and technology (R&D and patents). These are also the sectors with the lowest book values, relative to market value, suggesting that whatever accountants are doing to bring in intangibles in these companies into book value is not having a tangible effect on the numbers. 
    In sum, the accounting obsession with intangibles, and how best to deal with them, has not translated into material changes on balance sheets, at least with GAAP in the United States. It is true that IFRS has moved faster in bringing intangible assets on to balance sheets, albeit not always in the most sensible ways, but even with those rules in place, progress on bringing intangible assets onto balance sheets has been slow. To be frank, I don't think accounting rule writers will be able to handle intangibles in a sensible way, and the barriers lie not in rules or models, but in the accounting mindset. Accounting is backward-looking and rule-driven, making it ill equipped to value intangibles, where you have no choice, but to be forward looking, and principle-driven. 

The Intrinsic Value of Intangibles

    I have been teaching and writing about valuation for close to four decades now, and I have often been accused of giving short shrift to intangible assets, because I don't have a session dedicated to valuing intangibles, in my valuation class, and I don't have entire books, or even chapters of my books, on the topic. While it may seem like I am in denial, given how much value companies derive from assets you cannot see, I have never felt the need to create new models, or even modify existing models, to bring in intangibles. In this section, I will explain why and make the argument that if you do intrinsic valuation right, intangibles should be, with imagination and very little modification of existing models, already in your intrinsic value.

    To understand intrinsic value, it is worth starting with the simple equation that animates the estimation of value, for an asset with n years of cash flows:


Thus, the intrinsic value of an asset is the present value of the expected cash flows on it, over its lifetime. When valuing a business, where cash flows could last for much longer (perhaps even forever), this equation can be adapted:


In this equation, for anything, tangible or not, has to show up in either the expected cash flows or in the risk (and the resulting discount rate); that is my "IT" proposition. This proposition has stood me in good stead, in assessing the effect on value of just about everything, from macro variables like inflation to buzzwords like ESG.     

    Using this framework for assessing intangible assets, from brand name to quality management, you can see that their effect on value has to come from either higher expected cash flows or lower risk (discount rates).  To provide more structure to this discussion, I reframe the value equation in terms of inputs that valuation analysts should be familiar with - revenue growth, operating margins and reinvestment, driving cash flows, and equity and debt risk, determining discount rates and failure risk. 

In the picture, I have highlight some of the key intangibles and which inputs are mostly likely to be affected by their presence. 
  • It is the operating margin where brand name, and the associated pricing power, is likely have its biggest effect, though it can have secondary effects on revenue growth and even the cost of capital. 
  • Good management, another highly touted intangible, will manifest in a business being able to deliver higher revenue growth, but also show up in margins and reinvestment; the essence of superior management is being able to find growth, when it is scarce, while maintaining profitability and not reinvesting too much. 
  • Connections to governments and regulators, an intangible that is seldom made explicit, can affect value by reducing failure risk and the cost of debt, while increasing growth and or profitability, as the company gets favorable treatment on bids for contracts.
This is not a comprehensive list, but the framework applies to any intangible that you believe may have an effect on value. This approach to intangibles also allows you to separate valuable intangibles from wannabe intangibles, with the latter, no matter how widely sold, having little or no effect on value. Thus, a company that claims that it has a valuable brand name, while delivering operating margins well below the industry average, really does not, and the effect of ESG on value, no matter what its advocates claim, is non-existent.
   It is true that this approach to  valuing intangibles works best for a company with a single intangible, whether it be brand name or customer loyalty, where the effect is isolated to one of the value drivers. It becomes more difficult to use for companies, like Apple, with multiple intangibles (brand name, styling, operating system, user platform). While you can still value Apple in the aggregate, breaking out how much of that value comes from each of the intangibles will be difficult, but as an investor, why does it matter? 

The Birkenstock IPO: A Footwear company with intangibles

    If you have found this discussion of intangibles abstract, I don't blame you, and I will try to remedy that by applying my intrinsic value framework to value Birkenstock, just ahead of its initial public offering. As a company with multiple intangible components in its story, it is well suited to the exercise, and I will try to not only estimate the value of the company with the intangibles incorporated into the numbers, but also break down the value of each of its intangibles.

The Lead In

    Birkenstock is primarily a footwear company, and to get perspective on growth, profitability and reinvestment in the sector, I looked at all publicly traded footwear companies across the globe. the table below summarizes key valuation metrics for the 86 listed footwear companies that were listed as of September 2023.

In the aggregate, the metrics for footwear companies are indicative of an unattractive business, with more than half the listed companies seeing revenues shrink in the decade, leading into 2022 and more than quarter reporting operating losses. However, many of these companies are small companies, with a median revenue at $170 million, struggling to stay afloat in a competitive product market. Since Birkenstock generated revenues of $1.4 billion in the twelve months leading into its initial public offering, with an expectation of more growth in the future, I zeroed in on the twelve largest companies in the apparel and footwear sector, in  market capitalization, and looked at their operating metrics:

As you can see, these companies look very different from the sector aggregates, with solid revenue growth (median compounded growth rate of 8.66% a year, for the last decade) and exceptional operating margins (gross margins close to 70% and operating margins of 24%). Each of the companies also has a recognizable or many recognizable brand names, with LVMH and Hermes topping the list. In this business, at least, brand name seems to be dividing line between success and mediocrity, and having a well-recognized brand name contributes to growth and profitability. It is this grouping that I will draw on more, as I look valuing Birkenstock.

Birkenstock's History

    In my work on corporate life cycles, I talk about how companies age, and how importance it is that they act accordingly. Generally, as a company moves across the life cycle, revenue growth eases, margins level off and there is less reinvestment. As a business that has been around for almost 250 years, Birkenstock should be a mature or even old company, but it has found a new lease on life in the last decade. 

    Birkenstock was founded in 1774 by Johann Adam Birkenstock, a Germany cobbler, and it stayed a family business for much of its life. In the decades following its founding, the company modified and adapted its footwear offerings, catering to wealthy Europeans in the growing German spa culture in the 1800s, and modifying its product line, adding flexible insoles in 1896 and pioneering arch supports in 1902. During the 1920s and 1930s, the company carved out a market around comfort and foot care, partnering with physicians and podiatrists, offering solutions for customers with foot pain. In 1963, the company introduced its first fitness sandal, the Madrid, and sandals now represent the heart of Birkenstock's product line. 

    Along the way, serendipity played a role in the company's expansion. In 1966, a Californian named Margot Fraser, when visiting her native Germany, discovered that Birkenstocks helped her tired and hurting feet, and she convinced Karl Birkenstock to try selling the company's sandals in California. It is said that Karl advanced her credit, and helped her persuade reluctant California retailers to carry the  company’s unconventional footwear in their stores. That proved timely, since people protesting against the war and society's ills latched on to these sandals, making them them symbolic footwear for the rebellious. in the 1990s, the brand had a rebirth, when a very young Kate Moss wore it for a cover story, and it became a hot brand, especially on college campuses. Today, Birkenstock gets more than 50% of its revenues in the United States, with multiple celebrities among its customers. The company's prospectus does a good job painting a picture of both the product offerings and customer base, leading into the IPO, and I have captured those statistics in the picture below:

Unlike some in its designer and brand name peers, the company’s products are not exorbitantly over priced and the company’s best seller, the Arizona, sells for close to $100. While the company sells more shoes to women than men, it sells footwear to a surprisingly diverse customer base, in terms of income, with 20% of its sales coming from customers who earn less than $50,000 a year, and in terms of age, with almost 40% of its revenues coming from Gen X and Gen Z members.

    For much of its history, Birkenstock was run as a family business, capital constrained and with limited growth ambitions, perhaps explaining its long life. The turning point for the company, to get to its current form, occurred in 2012, when the family, facing internal strife, turned control of the company over to outside managers, choosing Markus Bensberg, a company veteran, and Oliver Reichert, a consultant, as co-CEOs of the company. Reichert, in particular, was a controversial pick since he was not only an outsider, but one with little experience in the shoe business, but the choice proved to be inspired. With an assist again from serendipity, when Phoebe Philo exhibited a black mink-lined Arizona on a Paris catwalk in 2012, leading to collaborations with high-end designers like Dior, the company has found a new life as a growth company, with revenues rising from €200 million  in 2012 to more than 1.4 billion  in the twelve months leading into the IPO, representing an 18.2% compounded annual growth rate over the decade:

Birkenstock Prospectus 2023 (October 4 filing)

The surge in revenues has been particularly pronounced since 2020, the COVID year, with different theories on why the pandemic increased demand for the product; one is that people working from home chose the comfort of Birkenstocks over uncomfortable work shoes. The company's growth has come with solid profitability, and the table below shows key profit metrics over the last three years:

Birkenstock Prospectus 2023 (October 4 filing)

Note that the company's operating and gross margins, at least in the last two years, match up well with the operating margins of the large, brand name apparel & footwear companies that we highlighted in the last section. It may be early to value brand name, but the company certainly has been delivering margins that put it in the brand name group.

    The strong growth since 2020 provide a strong basis for why the company is planning its public offering now, but there is another factor that may explain the timing. In 2021, the family sold a majority stake in the firm to L. Catterton, an LVMH-backed private equity firm, at an estimated value in excess of €4 billion Euros. That deal was funded substantially with debt, leaving a debt overhang of close to €2 billion, in 2023; the prospectus states that all of of the company's proceeds from the offering will be used to pay down this debt. That said, the pricing for the offering has increased since news of it was first floated in July, with 6 billion plus pricing in initial reports  increasing to €8 billion in early September and to €9.2 billion in the most recent news stories. The company has picked up anchor investors along the way, with the Norwegian sovereign fund planning to buy €300 million  of the initial offering.

Birkenstock's Intangibles

    Birkenstock is a good vehicle for identifying and valuing intangibles, since it has so many of them, with some more sustainable and more valuable than others:    

  1. Brand Name: It is undeniable that Birkenstock not only has a brand name, in terms of recognition and visibility, but has the pricing power and operating margins to back up that brand name. However, as is often the case, the building blocks that gave rise to the brand name are complex and varied. The first is the uniqueness of the footwear makes the company stand out, with people people either hating its offerings (ugly, clunky, clog) or loving it. Unlike many footwear companies that attempt to copy the hottest styles, Birkenstock marches to its own drummer. The second is that the company's focus on comfort and foot health, in designing footwear, as well as the use of quality ingredients, is matched by actions. In fact, one reason that the company makes almost all of its shoes still in Germany, rather than offshoring or outsourcing, is to preserve quality, and sticks with time-tested and quality ingredients, is to preserve this reputation. The third is that unlike some of the companies on the big brand name list, Birkenstock's are not exorbitantly over priced, and has a diverse (in terms of income and age) customer base. In short, its brand name seems to have held up well over the generations.
  2. Celebrity Customer Base: As I noted earlier, especially as Birkenstocks entered the US market, they attracted a celebrity clientele, and that has continued through today. Birkenstock attracts celebrities in different age groups, from Gwyneth Paltrow & Heidi Klum to Paris Jackson & Kendall Jenner, and more impressively, it does so without paying them sponsorship fees. If the best advertising is unsolicited, Birkenstock clearly has mastered the game. 
  3. Good Management: I tend be skeptical about claims of management genius, having discovered that even the most highly regarded CEOs come with blind spots, but Birkenstock seems to have struck gold with Oliver Reichert. Not only has he steered the company towards high growth, but he has done so without upsetting the balance that lies behind its brand name. In fact, while Birkenstock has entered into collaborative arrangements with other high profile brand names like Dior and Manolo Blank, Reichert has also turned down lucrative offers to collaborate with designers that he feels undermine Birkenstock's image. 
  4. The Barbie Buzz: For a company that has benefited from serendipitous events, from Margot Fraser's introduction of its footwear to Americans in 1966 to Phoebe Philo's sandals on the Paris catwalk in 2012, the most serendipitous event, at least in terms of its IPO, may have been the release of the Barbie movie, this summer. Margot Robbie's pink Birkenstock sandals in that movie, which has been the blockbuster hit of the year, hyper charged the demand for the company's footwear. It is true that buzzes fade, but not before they create a revenue bump and perhaps even increase the customer base for the long term.
For the moment, these intangibles are qualitative and fuzzy, but in the next section, I will try to bring them into my valuation inputs.

Birkenstock Valuation

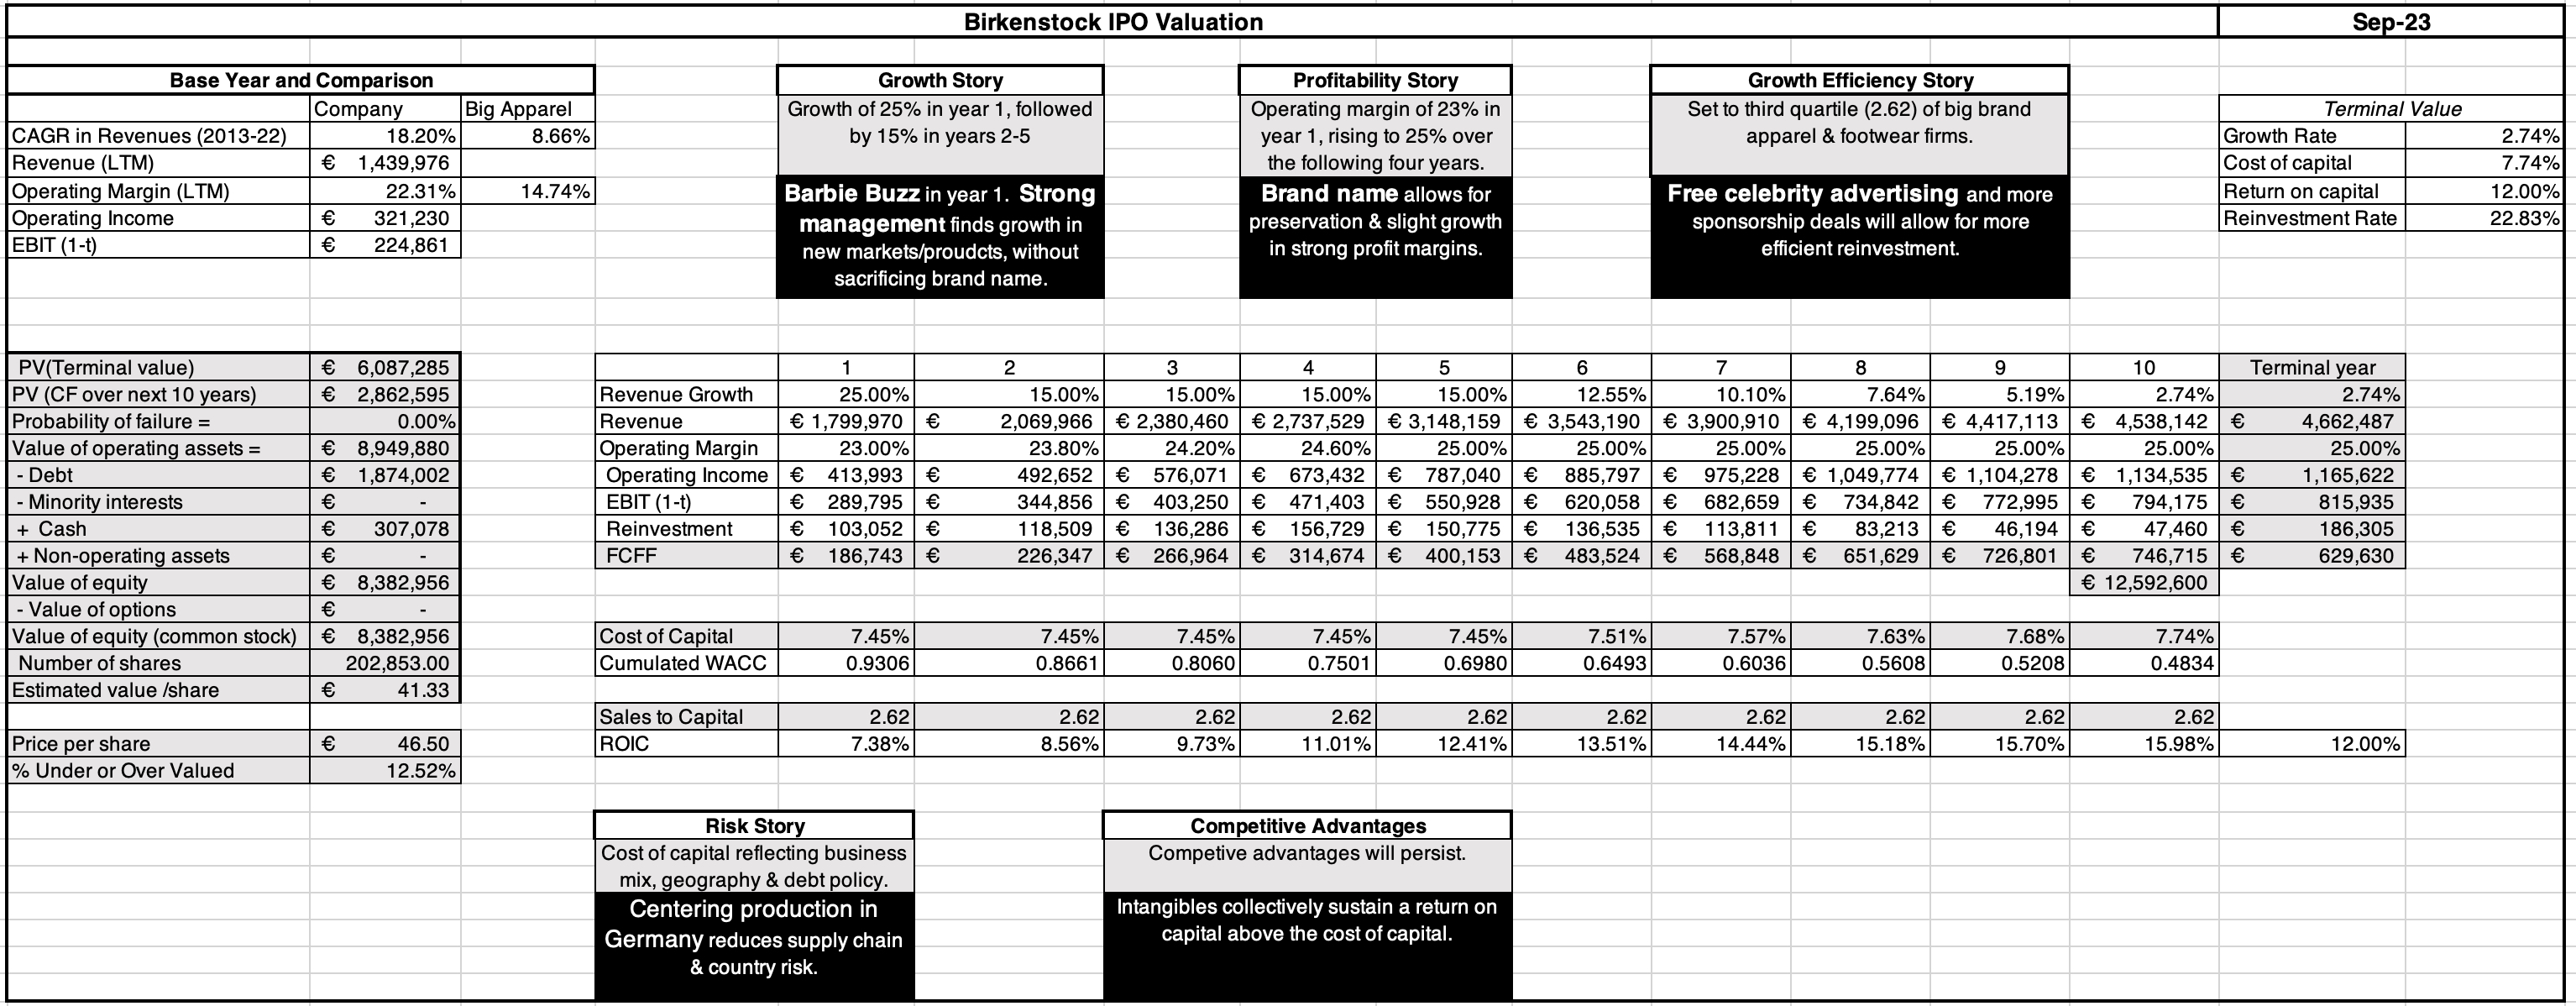
    My Birkenstock valuation is built around an upbeat story of continued high growth and sustained operating margins, with the details below:

  1. Revenue Growth: The company is coming into the IPO, with the wind at its back, having delivered a compounded annual growth rate of 18.2% in revenues in the decade leading into the offering. That said, its revenues now are €1.4 billion, rather than the 200 million they were in 2012, and growth rates will come down to reflect the larger scale. While the average CAGR in revenues for big brand apparel & footwear firms has been 8.66%, I believe that Oliver Reichert and the management team that runs Birkenstock will continue their successful history of opportunistic growth, and be able to triple revenues over the next decade. This will be accomplished with an assist from the Barbie Buzz in year 1 (pushing the growth rate to 25% over the next year) and a compounded growth rate of 15% a year in the following four years.
  2. Profitability: Birkenstock has had a history of strong operating margins, driven by its brand name and visibility. In the twelve months leading into the IPO, the company reported a pre-tax operating margin of 22.3%, and its margins over the last decade have hovered around 20%. I believe that the strength of the brand name will sustain and perhaps even slightly increase operating margins for the company, with the margin increasing to 23%, over the next  year, and to 25% over the following four years.
  3. Reinvestment: Birkenstock has been circumspect in investing for growth, over its history, showing reluctance to move away from its reliance on its German workforce, and in making acquisitions. It has also not been a big spender on brand advertising, using its celebrity clientele as a key component of building and growing its brand I believe that the celebrity clientele effect will allow the company to continue on its path of efficient growth, delivering €2.62 for every euro invested, matching the third quartile of big brand apparel firms.
  4. Risk: The Catterton acquisition of a majority stake in Birkenstock in 2021 was funded with a significant amount of debt, but the proceeds from the offering are expected to be utilized in paying down debt. The company should emerge from the offering with a debt load on par with other brand name apparel & footwear companies, and the concentration of its production in Germany will reduce exposure to supply chain and country risk.
  5. IPO Proceeds: News stories suggest that Birkenstock is planning to offer about 21.5 million shares to the public, and use the proceeds (estimated to be €1 billion, at the 45 offering price) to pay down debt. In conjunction, Catterton plans to sell about the same number of shares at the offering as well, reducing its stake in the company, and cashing out on what should be a big win for the private equity player.
To see how these inputs play out in value, I have brought them together in the (dense) valuation picture below. With each of the inputs, I have highlighted both the numbers that I am using, as well as highlighting how much intangibles contribute to each input:
Download spreadsheet

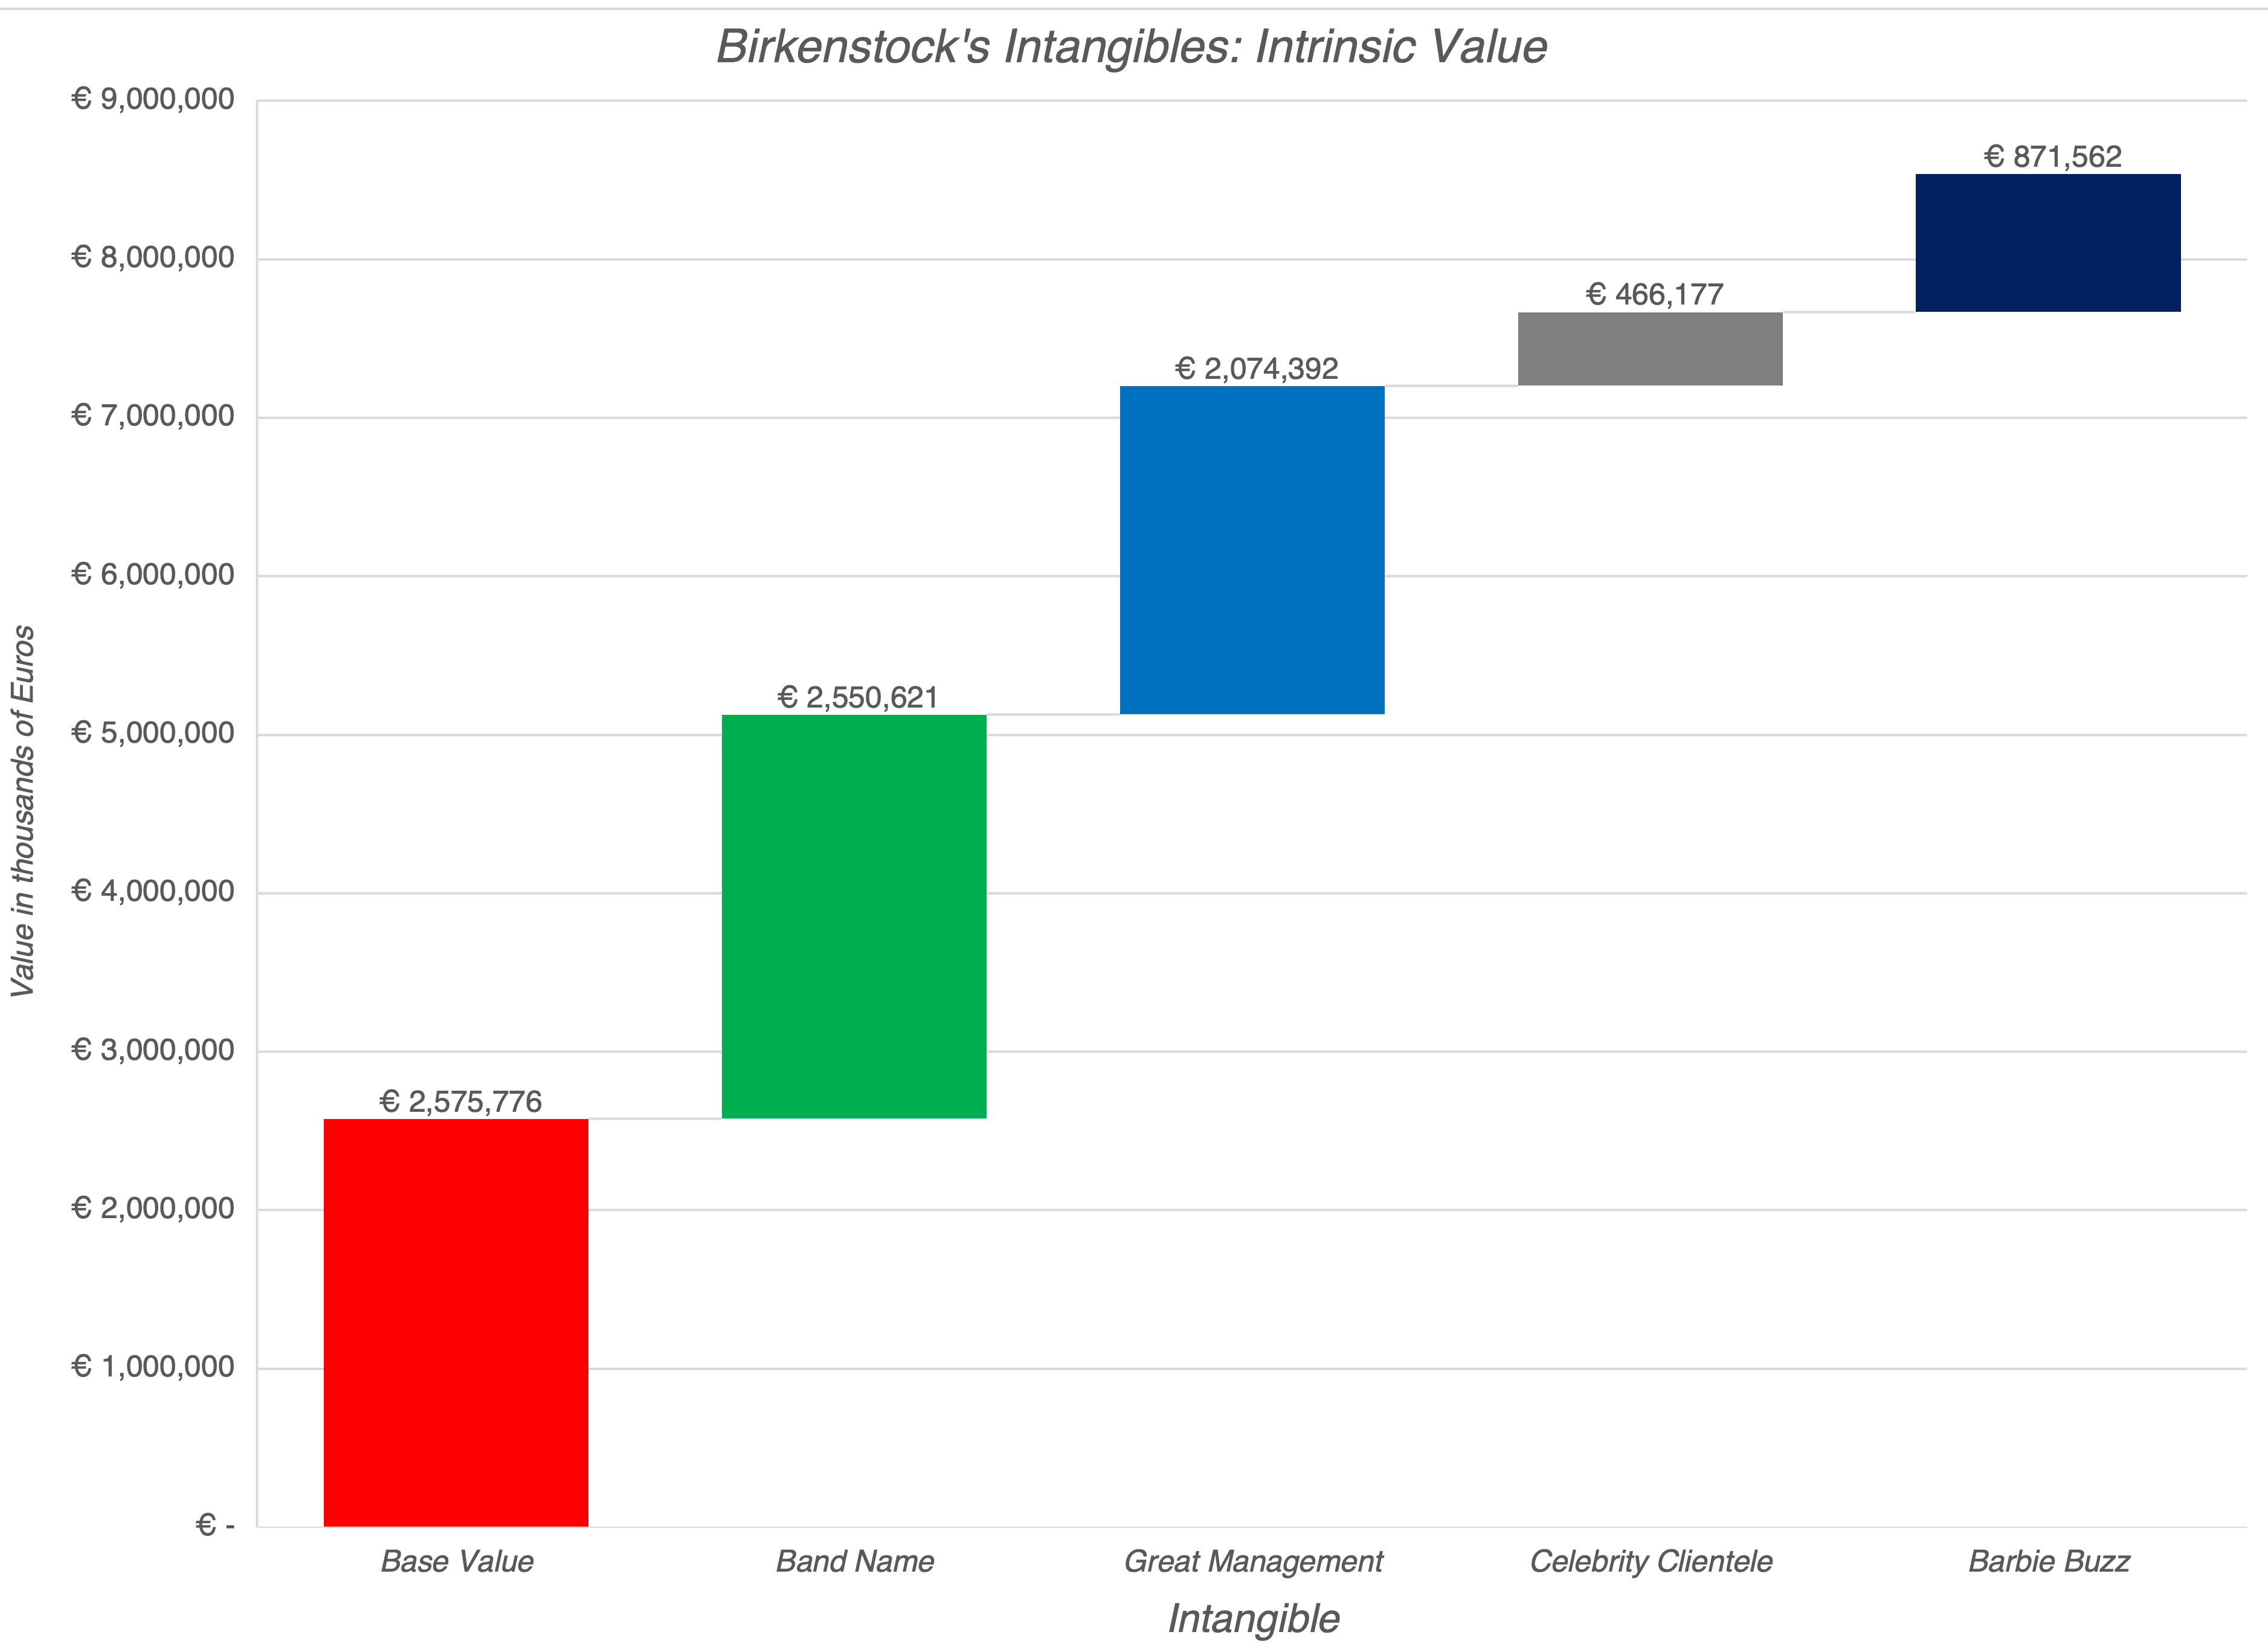
The value that I estimate for Birkenstock, with my inputs on growth, profitability and risk, is about €8.38 billion, about 10% less than the rumored offering pricing, but still well within shouting distance of that number. In case you are tempted to use the company's many intangibles as the explanation for the difference, note that I have already incorporated them into my inputs and value. To make explicit that effect, I have isolated each intangible and its effect on value in the table below:

To value each intangible, I toggle the input that reflects the intangible on and off to determine how much it changes value. The intangible that has the biggest effect on value is brand name, followed by the strength of the management team, with the Barbie Buzz and Celebrity Effects lagging. Another way of visualizing how these intangibles play into value is to build up to estimated value of equity of €8.38 billion in pieces:

These value judgments are based upon my estimates, and they are, of course, open for debate. For instance, you might argue that the effect of good management on revenue growth is more or less than my estimate, or even that the effects spill over into other inputs (cost of capital, margins and reinvestment), but that is a healthy debate to have. 

Pricing Factors

    It is undeniable that the Birkenstock IPO will be priced, not valued, and the question of how the stock will do is just as much dependent, perhaps more so, on market mood and momentum, as it is on the fundamentals highlighted in the valuation. 

  • Looking at news about the company, the timing works well, since the company is coming into the market on a wave of good publicity. Almost every news story that I have read about the company paints a positive picture of it, with laudatory mentions of Oliver Reichert and the company's products, intermixed with pictures of not only Barbie's pink Birkenstock but a host of other celebrities.
  • It is the market mood that is working against the company, at least at the moment that I am writing this post (October 6, 2023). As I wrote in my post on bipolar markets just a few days ago, the market mood has soured, with the optimism that we had dodged the bullet that was so widely prevalent just a few weeks ago replaced with the pessimism that dark days lie ahead for the global economy and markets.
At its offering pricing of €9.2 billion  (€45 to €50 per share), the company and its bankers seem to be betting that the good vibes about the company will outweigh the bad vibes in the market, but that is gamble.  As someone who has tried and rejected the Arizona sandal, I am unlikely to be a customer for Birkenstock footwear, but this is a company with a truly unique brand name and a management team that understands the delicate balance between utilizing a brand name well and overdoing it. It is, in my view, a reach at €45 or €50 per share, but if the market turns sour, and the stock drops to below €40, I would be a buyer.

YouTube Video

Attachments

Friday, June 23, 2023

AI's Winners, Losers and Wannabes: An NVIDIA Valuation, with the AI Boost!

I will start this post with a couple of confessions. The first is that my portfolio has held up well this year, in a market that has been top-heavy and tech-driven, and one big reason is that it contains both NVIDIA and Microsoft, two companies that have benefited from the AI story. The second is that much as I would like to claim credit for foresight and forward thinking, AI was not even a speck in my imagination when I bought these stocks (Microsoft in 2014 and NVIDIA in 2018). I just happened to be in the right place at the right time, a reminder again that being lucky often beats being smart, at least in markets. That said, NVIDIA’s soaring stock price has left me facing that question of whether to cash out, or let my money ride, and thus requires an assessment of how the promise of AI play’s out in its value. Along the way, I will take a look at the promise of AI, as well as the perils for investors, drawing on lessons from the past.

The Semiconductor Business

    The semiconductor business, in its current form, had its growth spurt as a consequence of the PC revolution of the 1980s, as personal computers transitioned from tools and playthings for geeks to everyday work instruments for the rest of us. In the last four decades, computer chips have become part of almost everything we use, from appliances to automobiles, and the companies that manufacture these chips have seen their fortunes rise, and sometimes be put at risk, as technology shifts.

1. From High Growth to Maturity!

    It was the personal computer business in the 1980s that gave the semiconductor business, as we know it, its boost, and as technology has increasingly entered every aspect of life, the semiconductor business has grown. To map the growth, I started by looking at the aggregated revenues of all global semiconductor companies in the chart below from 1987 to 2023 (through the first quarter):

Source: Semiconductor Industry Association

From close to nothing at the start of the 1980s, revenues at semiconductor companies surged in the 1980s and 1990s, first boosted by the PC business and then by the dot-com boom. From 2001 to 2020, revenue growth at semiconductor businesses has dropped to single digits, as higher demand for chips in new uses has been offset by loss of pricing power, and declining chip prices. While revenue growth has picked up again in the last three years, the business has matured.

2. Sustained Profitability, with Cycles!

    The semiconductor business has generally been a profitable one for much of its existence, as can be seen in the  aggregate margins of companies in the business below:


While gross and operating margins have always been healthy, the pick up in both metrics since 2010 is a testimonial to the higher profitability in some segments of the chip business, even as competition commoditized other segments. As can be seen in the periodic dips in profitability across time, there are cycles of profitability that have continued, even as the business has matured. 
    It is worth noting that these margins are understated, because of the accounting treatment of R&D as an operating expense, instead of as a capital expenditure. The R&D adjusted operating margin at semiconductor companies is higher by about 2-4%, in every time period, with the adjustment to operating taking the form of adding back the R&D expense from the year and subtracting out the amortization of R&D expenses over the prior five years (using straight line amortization).

3. Love-Hate Relationship with Markets!

    As the semiconductor business has acquired heft, in terms of revenues and profitability, investors have priced those operating results into the market capitalization assigned to these companies. In the graph below, I report the collective enterprise value and market capitalization of global semiconductor companies, stated in US dollar terms:


As you can see, the semiconductor companies have enjoyed long periods of glory, interspersed with periods of pain in markets, starting with a decade of surging market capitalizations in the 1990s, followed by a decade in the wilderness, with stagnant market capitalization, between 2000 and 2010, before another decade of growth, with market capitalizations surged six-fold between 2011 and 2020. Note that for the most part, semiconductor companies carry light debt loads, leading to enterprise values that either trail in market capitalization in some years (because cash exceeds debt) or are very close to market capitalization in other years (because net debt is close to zero). 
    As market capitalizations have risen and fallen, the multiple of revenues that semiconductor companies has also fluctuated, reaching a high in the dot-come era, with semiconductor companies trading collectively at more than seven times revenues to a long stretch where they traded at between two and three times revenues, before spiking again between 2019 and 2021. If prices are a reflection of what the market thinks about the future, the pricing of semiconductor companies seems to indicate an acceptance on the part of investors that the business has matured.

4. Shifting Cast of Winners and Losers!

    As the semiconductor business has matured, it has also changed in terms of both the biggest players in the business, as well as the largest customers for its products . In the table below, we show the evolution of the top ten semiconductor companies, in terms of revenues, from 1990 through 2023, at ten-year intervals:


The cast of players has changed over time, with only two companies from the 1990 list (Intel and Texas Instruments) making it to the 2023 list. Over the decades, the Japanese companies on the list have slipped down or disappeared, to be replaced by Korean and Taiwanese firms, with Taiwan Semiconductors being the biggest mover, moving to the top of the list in 2022. After a long stretch at the top, Intel has dropped back down the list and ranked third, in terms of revenues, in 2022. Note that NVIDIA, the subject of this post, was eighth on the list in 2023, and has remained at that ranking from 2010. That may seem at odds with its rising market capitalization but it is indicative of the company's strategy of going after niche markets with high profitability, rather than trying to grow for the sake of growth.

    The customers for semiconductor chips have also changed over time, with the shift away from personal computers to smartphones, with demand emerging from automobile, crypto and gaming companies in the last decade. Over the last few years, data processing has also emerged as demand driver, and it is safe the say that more and more of the global economy is driven by computer chips:

Semiconductor Industry Association
The forecasts for the future (2030), were for faster growth in automobile and industry electronics, but the potential surge in demand from AI products was largely underplayed, showing how quickly market forecasts can be subsumed by changes on the ground.

NVIDIA: The Opportunist!

    NVIDIA was founded in 1993 by Jensen Huang, but it remained a niche player until the early parts of this century. Much of its rise has come in the last decade, just as revenues for the overall semiconductor business were starting to level off, and in this section, we will look through the company's history, looking for clues to its success and current standing.

1. Opportunistic Growth, with Profitability

    NVIDIA went public in January 22, 1999, with the dot-com boom well under way, and its stock price popped by 64% on the offering date. At the time of its public offering, the company was money-making, but with small revenues of $160 million, making it a bit player in the business. As you can see in the graph below, those revenues grew between 2000 and 2005, to reach $2.4 billion in 2005. In the following decade (2006-2015), the annual revenue growth rate dropped back to 7-8% a year, but that growth allowed the company to make the top ten list of semiconductor companies by 2010. Well-timed bets on gaming and crypto created a surge in the revenue growth rate to 27.19% between 2016-2020, and that growth has continued into the last two years:


There are two impressive components to NVIDIA's history. The first is that it has been able to maintain impressive growth, even as the industry saw a slowing of revenue growth (3.97% between 2011-2020). The second is that this high revenue growth has been accompanied not just with profits, but with above-average profitability, as NVIDIA's gross and operating margins have run ahead of industry averages. NVIDIA has clearly embraced a strategy of investing ahead of, and going after, growth markets for the chip business, and that strategy has paid off well. Thus, its current dominant positioning in the AI chip business can be viewed as more evidence of that strategy at play.
    There is one final component to NVIDIA's business model that needs noting, both from a profitability and risk perspective. NVIDIA 's core business is built around research and chip design, not chip manufacturing, and it outsources almost all of its chip production to TSMC. Its margins then come from its capacity to mark up the prices of these chips and it is exposed to the risks that any future China-Taiwan tensions can disrupt its supply chain.

2. Large, albeit Productive Reinvestment

    While NVIDIA's growth and profitability have been impressive, the value cycle is not complete until you bring in the investment that the company has  had to make to deliver that growth. With a semiconductor company, that reinvestment includes not only investing in manufacturing capacity, but also in the R&D to create the next generation of chips, in terms of power and capability. As with the sector, I capitalized R&D at NVIDIA, using a 5-year life, and recalculated my operating income (since the reported version is built on the accounting mis-reading of R&D as an operating expense). That results in a corrected version of pre-tax operating margin for NVIDIA that was 37.83% and a pre-tax return on capital of 24.42% in 2021-2023:

I also computed a sales to capital ratio, measuring the dollars of sales for each dollar of capital invested. In 2022, that number, for NVIDIA, was 0.65, indicating that this is definitely not a capital-light business and that NVIDIA has invested heavily to get to where it is today, as a company.

3. With a Mega Market Payoff

    NVIDIA's success on the operating front has impressed financial markets, and its rise in market capitalization from its IPO days to a trillion-dollar value can be seen below:

I know that there are many who are regretting their lack of foresight, in not owning NVIDIA through its entire run, but recognize that this was not a smooth ride to the top. In fact, the company had near-death experiences, at least in market value term, in 2002 and 2008, losing more than 80% of its market value. That said, I owe my lucky run with NVIDIA to one of those downturns in 2018, when the company lost more than 50% of its market value, and it is a lesson that I hope will come through this chart. Even the biggest winners in the market have had periods when investors have turned intensely negative on their prospects, making them attractive as investments for value-focused investors.

AI: From Promise to Profits

    Since much of the run-up in NVIDIA in the last few months has come from talk about AI, it is worth taking a detour and examining why AI has become such a powerful market driver, and perhaps looking at the past for guidance on how it will play out for investors and businesses.

Revolutionary or Incremental Change?

    I am old enough to be both a believer and a skeptic on revolutionary changes in markets, having seen major disruptors play out both in my personal life and my portfolio, starting with personal computers in the 1980s, the dot-com/online revolution in the 1990s, followed by smartphones in the first decade of this century and social media in the last decade. What set these changes apart was that they not only affected wide swathes of businesses, some positively and some adversely, but that they also changed the ways that we live, work and interact. In parallel, we have also seen changes that are more incremental, and while significant in their capacity to create new businesses and disruption, don't quite qualify as revolutionary. I won't claim to have any special skills in being able to distinguish between the two (revolutionary versus incremental), but I have to keep trying, since failing to do so will result in my losing perspective and making investing mistakes. Thus, I was unable to share the belief that some seemed to have about the "Cloud" and "Metaverse" businesses being revolutionary, since I saw them more as more incremental than revolutionary change. 

    So, where does AI fall on this spectrum from revolutionary to incremental to minimalist change? A year ago, I would have put it in the incremental column, but ChatGPT has changed my perspective. That was not because ChatGPT was at the cutting edge of AI technology, which it is not, but because it made AI relatable to everyone. As I watched my wife, who teaches fifth grade, grapple with students using ChatGPT to do homework assignments. and with my own students asking ChatGPT questions about valuation that they would have asked me directly, the potential for AI to upend life and work is visible, though it is difficult to separate hype from reality.    

Business Effects

    If AI is revolutionary change and will be a key market driver for this decade, what does this mean for investors? Looking back at the revolutionary changes from the last four decades (PCs, dot-com/internet, smartphones and social media), there are some lessons that may have application to the AI business.

  1. A Net Positive for Markets? Does revolutionary change help the overall economy and/or equity markets? The results from the last four decades is mixed. The PC-driven tech revolution of the 1980s coincided with a decade of high stock market returns, as did the dot-com boom in the next decade, but the first decade of this century was one of the worst in market history as stock prices flatlined. Stocks did well again over the last decade, with technology as the big winner, and over the four decades of change (1980-2022), the annual return on stocks has been marginally higher than in the five decades prior. 
    Historical Stock Returns for US

    Given equity market volatility, four decades is a short time period, and the most that we can discern from this data is that the technological changes have been a net positive, for markets, albeit with added volatility for investors.
  2. With a few Big Winners and Lots of Wannabes and LosersIt is indisputable that each of the revolutionary changes of the last four decades has created winners within the space, but a few caveats have also emerged. The first is that these changes have given rise to businesses where there are a few big winners, with a few companies dominating the space, and we have seen this paradigm play out with software, online commerce, smartphones and social media. The second is that the early leaders in these businesses have often fallen to the wayside and not become the big winners. Finally, each of these businesses, successful though they have been in the aggregate, have seen more than their share of false starts and failures along the way. For investors, the lesson has to be that investing in revolutionary change, ahead of others in the market, does not translate into high returns, if you back the wrong players in the race, or more importantly, miss the big winners. It is true that at this very early stage of the AI game, the market has anointed NVIDIA and Microsoft as big winners, but it is entirely possible that a decade from now, we will be looking at different winners. At the stage of the hype cycle, it is also true that almost every company is trying to wear the AI mantle, just as every company in the 1990s aspired to have a dot-com presence and many companies claimed to have "user-intensive" platforms in the last one, As investors, separating the wheat from the chaff will only get more difficult in the coming months and years, and it is part of the learning process. To the argument that you could buy a portfolio of companies that will benefit from AI and make money from the few that succeed, past market experience suggests that this portfolio is more likely to be over than under priced.
  3. With DisruptionThe market is littered with the carcasses of what used to be successful businesses that have been disrupted by technological change. Investors in these disrupted companies not only lose money, as they get disrupted, but worse, invest even more in them, drawn by their "cheapness". This happened, just to provide two examples, with investors in the brick-and-mortar retail companies that were devastated by online retail, and with investors in the newspaper/traditional ad companies that were upended by online advertising. If AI succeeds in its promise, will there be businesses that are upended and disrupted? Of course, but we are in the hype phase, where much more will be promised than can be delivered, but the biggest targets will come into focus sooner rather than later.
The bottom line is that even if we all agree that AI will change the way businesses and individuals behave in future years, there is no low-risk path for investors to monetize this belief. 

Value Effects
    If history is any guide, we are in the hype phase of AI, where it is oversold as the solution to just about every problem known to man, and used to justify large price premiums for the companies in its orbit, without any attempt to quantify and back up these premiums. The primary argument that will be used by those selling these AI premiums is that there is too much uncertainty about how AI will affect numbers in the future, an argument that is at odds with paying numbers up front for those expectations. In short, if you are paying a high price for an AI effect in a company, it behooves you to put aside your aversion to making estimates, and use your judgment (and data) to arrive at the effect of AI on cashflows, growth and risk, and by extension, on value.
    In making these estimates, it does make sense to break down AI companies based upon what part of the AI ecosystem they inhabit, and I would suggest the following breakdown:
  • Hardware and Infrastructure: Every major change over the last few decades has brought with it requirements in terms of hardware and infrastructure, and AI is no exception. As you will see in the next section, the AI effect on NVIDIA comes from the increased demand for AI-optimized computer chips, and as that market is expected to grow exponentially, the companies that can grab a large share of this market will benefit.  There are undoubtedly other investments in infrastructure that will be needed to make the AI promise a reality, and the companies that are on a pathway to delivering this infrastructure will gain, as a consequence.
  • Software: AI hardware, by itself, has little value unless it is twinned with software that can take advantage of that computing power. This software can take multiple forms, from AI platforms, chatbots, deep learning algorithms (including image and voice recognition, as well as natural language processing) and machine learning, and while there is less form and more uncertainty to this part of the AI business, it potentially has much greater upside than hardware, precisely for the same reason.
    Source

  • Data: Since AI requires immense amounts of data, there will be businesses that will gain value from collecting and processing data specifically for AI applications. Big data, used more as a buzzword than a business proposition, over the last decade may finally find its place in the value chain, when twinned with AI, but that pathway will not be linear or predictable. 
  • Applications: For companies that are more consumers of AI than its purveyors, the promise of AI is that it will change the way they do business, with positive and negative implications. The biggest pluses of AI, at least as presented by its promoters, is that it will allow companies to reduce costs (primarily by replacing manual labor with AI-driven applications) and make them more efficient, and by extension, more profitable. Even if I concede the first claim (though I think that the AI replacements will be neither as efficient nor as cost-saving as promised),  I am even more wary of the second claim for a simple reason. If every company has AI, and AI reduces costs and increases efficiency as promised for all of them, it is far more likely that they will end up with lower prices for their products/services and not higher profits. At the risk of repeating one of my favorite sayings, "If everyone has it, no one does" and it is the basis for my argument that AI, if it succeeds, will make companies less profitable, in the aggregate. The other minus of AI is that if it delivers on even a portion of its promise of automating aspects of business, it will be damaging and perhaps even devastating for existing companies that derive their value currently from delivering these services for lucrative fees. In these businesses, AI will not just be a zero-sum game, but a negative-sum one.
On the specific questions of how AI will affect investing, in general, and active investing, in specific, I believe that if it is used as a tool, it can enrich valuation and investing, and I look forward to being able to develop valuation narratives and numbers, with its aid. For those who are active investors, individuals as well as institutions, I believe that AI will make a difficult game (delivering excess returns or alpha from investing) even more so. Any edge you have as an active investor will be more quickly replicated in an AI world, and to the extent that AI tools will be accessible and available to every investor, by itself, AI will not be a sustainable edge for any active investor. 

Social Effects

    Will AI make our lives easier or more difficult? More generally, will it make the world a better or worse place to inhabit? I know that there are some advocates of AI who paint a picture of goodness, where AI takes over the menial tasks that presumably cause us boredom  and brings an unbiased eye to data analysis that lead to better decisions. I know that there are others who see AI as an instrument that big companies will use to control minds and acquire power. With the experience of the big changes that have engulfed us in the last few decades still fresh, I would argue that they are both right. AI will be a plus is some occupations and aspects of our lives, just as it will create unintended and adverse consequences in others.

    There are some who believe that AI can be held in check and made to serve its more noble impulses, by restricting or regulating its development, but I am not as optimistic for many reasons. First, I believe that both regulators and legislators are woefully incapable of understanding the mechanics of AI, let alone pass sensible restrictions on its usage, and even if they do, their motives are not altruistic. Second, any regulation or law that is aimed at preventing AI's excesses will almost certainly set in motion unintended consequences, that at least in some cases will be worse than the problems that the regulation/law was supposed to hold in check. Third, having seen how badly regulators and legislators have handled the consequences of the social media explosion, I am skeptical that they will even know where to start with AI. While this is a pessimistic take, I believe that it a realistic one, and that just as with social media, it will be up to us, as consumers of AI products and services, to try to draw lines and separate good from bad. We may not succeed, but what choice do we have, but to try?

The AI Chip Story

    The AI story has particular resonance with NVIDIA because unlike most other companies, where it is mostly hand-waving about potential, it has substance in place already and a market that is its target. In particular, NVIDIA has spent much of the last few years investing and developing products for a nascent AI market. This lead time has given NVIDIA not just market leadership, but revenues and profits already. Much of the excited reaction to NVIDIA's most recent earnings report came from the company reporting a surge in its data center revenues, with much of the increase coming from AI chips. While the company does not explicitly break out how much of the data center revenues are from AI chips, it is estimated that the total market for those chips in 2022 was about $15 billion, with NVIDIA holding a dominant market share of about 80%. If those estimates are right, the bulk of the data center revenues for NVIDIA in 2022, which amounted to $15 billion in all, comes from AI-optimized chips.

    The ChatGPT jolt to market expectations has played out in increases in expected growth of the AI chip market over the next decade, with estimates for the overall AI chip market in 2030 ranging from $200 billion at the low end to close to $300 billion at the high end. While there is a huge amount of uncertainty about this estimate, there are two assertions that can be made about NVIDIA's presence in this business. The first is that this will be the growth engine for NVIDIA's revenues over the next decade, even as their gaming and other chip revenue growth levels off. The second is that NVIDIA has a lead over its competition, and while AMD, Intel and TSMC will all allocate resources to building their AI businesses, NVIDIA's dominance will not crack easily.

NVIDIA: Valuation and Decision Time

    As you look at NVIDIA's growth and success in the last decade, and its recent ascent into the rarefied air of "trillion dollar market cap" companies, there are two impulses that come into play. One is to extrapolate the past and assume that assume that the company will continue to not just succeed in the future, but do so in a way that beats the market's expectations for it. The other is to argue that the outsized success of the past has raised investors expectations so much that it will be difficult for the company to meet them. In my story, I will draw on both impulses, and try to thread the needle on the company.

Story and Valuation

        The driver of NVIDIA's success has been its high-performance GPU cards, but it is very likely that the businesses that bought these cards and drove NVIDIA's success in the last decade will be different from the businesses that will make it successful in the next one. For much of the last decade, it was gaming and crypto users that allowed the company to set itself apart from the competition, but the bad news is that both of these markets are maturing, with lower expected growth in the future. The good news, for NVIDIA, is that it has two other businesses that are ready to step in and contribute to growth. The first is AI, where NVIDIA commands a hefty market share of what is now a relatively small market, but one that is almost certain to grow ten-fold or greater over the decade. The other is in the automobiles business, where more powerful computing is seen as the ingredient needed to open up automated driving and other enhancements. NVIDIA is only a small player in this space, and while it does not enjoy the dominance that it does in AI, a growing market will allow NVIDIA to acquire a significant market share. 

    I will start with a familiar construct (at least to those who follow my valuations), and break down the inputs that drive value as a precursor to introducing my NVIDIA story:

Put simply, the value of a company is a function of four broad inputs - revenue growth, as a stand-in for its growth potential, a target operating margin as a proxy for profitability, a reinvestment scalar (I use sales to invested capital) as a measure of the efficiency with which it delivers growth and a cost of capital & failure rate to incorporate risk. 
    While all of NVIDIA's different businesses (AI, Auto, Gaming) share some common features in terms of gross and operating margins, and requiring R&D for innovation, the businesses are diverging in terms of revenue growth potential. 

  • Revenue Growth: NVIDIA will remain a high growth company for two reasons. The first is that in spite of its scaling up due to growth over the last decade, at least in terms of revenues, it has a modest market share of the overall semiconductor market, with revenues that are less than half of the revenues posted by Intel or TSMC. The second, and more important reason, is that while its gaming revenue growth is starting to flag, it is well-positioned in AI and Auto, two markets poised for rapid growth. In my story, I will assume that these markets will deliver on their growth promise and that NVIDIA will maintain a dominant, albeit lower, market share of the AI chip business, while gaining a significant share (15%) of the Auto chip business:
    Clearly, there is room for disagreement on both total market and market share for the AI and Auto businesses, and I will return to address the effects. I am still allowing the gaming and other business revenues to grow at 15% a year, a healthy number that reflects other businesses (like the omniverse) contributing to the top line.
  • Profitability: The semiconductor business has a cost structure that has relatively little flex to it, but I will assume in my NVIDIA story that the right margin to focus on is the R&D adjusted version, and that NVIDIA will bounce back quickly from its 2022 margin setback to deliver higher margins than its peer group. While my target R&D adjusted margin of 40% may look high, it is worth remembering that the company delivered 42.5% as margin in 2020 and 38.4% as margin in 2021.  As noted earlier, NVIDIA's dependence on TSMC for the production of the chips it sells implies that any increases in margins have to come more from price increases than cost efficiencies.
  • Investment Efficiency: NVIDIA has invested heavily in the last decade, generating only 65 cents in revenues for every dollar of capital invested (including the investment in R&D), in 2022. That investment has clearly been productive, as the company has been able to find growth and generate excess returns. I believe that given the company's larger scale, with the payoff from past investments augmenting revenues, the company's sales to invested capital will approach the global industry median, which is $1.15 in revenues for every dollar of capital invested.
  • Risk: As we noted in the section on the semiconductor business, this remains, even for its most successful proponents, a cyclical business, and that cyclicality contributes to keeping the cost of capital higher than for the median company. I estimated NVIDIA's cost of capital based upon its geographic exposure and very low debt ratio to be 13.13%, but chose to use the industry average for US semiconductor companies, which was 12.21%, as the cost of capital in the initial growth period. Over time, I will assume that this cost of capital will drift down towards the overall market average cost of capital of 8.85%.
With this story in place, and the resulting input numbers, the value that I get for NVIDIA is shown below:
Download spreadsheet

Based on story, the value per share that I arrive at for NVIDIA on June 10, 2023, is about $240, well below the stock price of $409 that the stock traded at on June 10, 2023. (The stock has risen since then to $434 a share on June 20, 2023.)

Simulation and Breakeven Analysis

    At the risk of stating the obvious, I am making assumptions about market growth and market share that you may or even should take issue with. In the interests of examining how value varies as a function of the assumptions, I fell back on an approach that I find helps me deal with estimation uncertainty, which is a simulation. I built the simulation around the key inputs, including:

  1. Revenues: In my base case valuation, incorporating high growth in the AI and Auto Chip businesses, and giving NVIDIA a dominant share of the first and a significant share of the second resulted in revenues of $267 billion in 2033. However, this is built on assumptions about the future for both markets that can be wrong, in either direction, and that uncertainty is incorporated into the simulation as distributions for each of the three segments of NVIDIA's revenues:
    As these distributions play out, there are simulations where NVIDIA's revenues exceed $600 billion and some where it is less than $100 billion, in 2033.
  2. Operating Margin: In my base case story, I increase NVIDIA's R&D adjusted margin to 35% next year, and target an operating margin of 40% in 2027, that it maintains in perpetuity after that. While I provide my justifications for those assumptions, it is entirely possible that I am being too optimistic, in raising margins that are already above industry-average levels to even higher values, or that I am being pessimistic, and not factoring in NVIDIA's higher pricing power in the AI and Auto businesses. I capture that uncertainty in my (triangular) distribution for the target operating margin in 2027 (and beyond), where I set the upper end of the range at 50%, which would be a significant premium over NVIDIA's own past margins, and the lower end at 30%, which would put them closer to their peer group.
  3. Reinvestment: The input that drives reinvestment is the sales to capital ratio, and while I set NVIDIA's sales to capital ratio at 1.15, the semiconductor industry average, it is possible that the company may continue to reinvest at closer to its historic average of 0.65 (leading to more reinvestment). Alternatively, it is also conceivable that the company's investments over the last decade, especially in its AI chips, will put it on a glide path to reinvesting a lot less in the next decade (a sales to capital ratio closer to 1.94, the 75th percentile of the semiconductor business.
  4. Risk: Ruling out failure risk, and focusing on the cost of capital, I center my estimates on 12.21%, the industry average that I used in the base case, but allow for the possibility that a growing AI business may reduce the cyclicality of revenues, lowering the cost of capital towards the market-average of 8.85%) or conversely, increase uncertainty and uncertainty, raising the cost of capital towards 15%, the 90th percentile of global companies):

With these estimates in place, the simulated value per share is shown below:

To the question of whether NVIDIA could be worth $400 a share or more, the answer is yes, but the odds, at least based on my estimates, are low. In fact, the current stock price is pushing towards the 95th percentile of my value distribution.

    An alternative look at what has to happen for NVIDIA's intrinsic value to exceed $400, I looked at the two key variables that determine its value: revenues in year 10 and operating margins:

Download spreadsheet

This table reinforces the findings in the simulation, insofar as it shows that there are plausible paths that lead to the current price being a fair value or under value, but these paths require a daunting combination of extraordinary revenue growth and super-normal margins. In my view, a target margin of 50% is pushing the limits of possibility, in the semiconductor business, and if NVIDIA finds a way to deliver value that justifies current pricing, it has to be through explosive revenue growth. Put simply, you need another market or two, with potential similar to the AI market, where NVIDIA can wield a dominant market share to justify its pricing.

Judgment Day

    As I noted at the start of this post, I have a selfish reason for valuing NVIDIA, which is that I own it shares and I am exposed to its price movements, and much more so now than I was when I bought the stock in 2018, as a result of its inflated pricing. I have also been open about the fact that my investment philosophy is built around value, buying when price is less than value and by the same token, selling when price is much higher than value.

NVIDIA as an Investment

    I love NVIDIA as a company, and have nothing but praise for Jensen Huang's leadership of the company. Operating in a business where revenue growth was becoming scarce (single digit revenue growth) and segments of the product market are commoditized (lowering margins), NVIDIA found a pathway to not just deliver growth, but growth with superior profit margins and excess returns. While some may argue that NVIDIA was lucky to catch a growth spurt in the gaming and crypto businesses, a closer look at its successes suggests that it was not luck, but foresight, that put the company in a position to succeed. In fact, as the AI and Auto businesses look poised to grow, NVIDIA's positioning in both indicates that this is a company that is built to be opportunistic. My valuation story for NVIDIA reflects all of these positive features, and assumes that they will continue into the next decade, but that upbeat narrative still yields a value well below the current price.

    I would be lying if I said that selling one of my biggest winners is easy, especially since there is a plausible pathway, albeit a low-probability one, that the company will be able to deliver solid returns, at current prices. I chose a path that splits the difference, selling half of my holdings and cashing in on my profits, and holding on to the other half, more for the optionality (that the company will find other new markets to enter in the next decade). The value purists can argue, with justification, that I am acting inconsistently, given my value philosophy, but I am pragmatist, not a purist, and this works for me. It does open up an interesting question of whether you should continue to hold a stock in your portfolio that you would not buy at today's stock prices, and it is one that I will return to in a future post.

NVIDIA as a Trade

    I have written many posts about the divide between investing and trading, arguing that the two are philosophically different. In investing, you assess the value of a stock, compare that value to the price, act on that difference (buying when price is less than value and selling when it is greater) and hope to make money as the gap between value and price closes. In trading, you buy at a low price, hoping to sell at a higher price, but you are agnostic about what causes the price to move and whether that movement is rational or not. 

Bringing this difference to play in NVIDIA, you can see why, no matter what you think about NVIDIA's value, you may continue to trade it. Thus, even if you believe that NVIDIA's value is well below its price, you may buy NVIDIA on the expectation that the stock will continue to rise, borne upwards by momentum or incremental information. Given the strength of momentum as a market-driver, you may very well generate high returns over the next weeks, months or even years, and you should not let "value scolds" get in the way of your enjoyment of your winnings. My only pushback would be against those who argue that momentum can carry a stock forward forever, since it is the gift that both gives and takes away. The strength of momentum in the rise in NVIDIA's stock price will be played out in the the opposite direction, when (not if) momentum shifts, and if you are trading NVIDIA, you should be working on indicators that give you early warning of those shifts, not worrying about value.

The Bottom Line

    As we hear the relentless pitches for AI, and how it will change our live and affect our investments, there are lessons, to draw on, from the other big changes that we have seen over our lifetime. The first is that even if you buy into the argument that AI will change the ways that we work and play, it does not necessarily follow that investing in AI-related companies will yield returns. In other words, you can get the macro story right, but you need to also consider how that story plays out across companies to be able to generate returns. The second, is that refusing to make estimates or judgments about how AI will affect the fundamentals (cash flows, growth and risk) in a  business, just because you face significant uncertainty, will not make that uncertainty go away. Instead, it will create a vacuum that will be filled by arbitrary AI premiums and make us more exposed to scams and wannabes. The third is that, as a society, it is unclear whether adding AI to the mix will make us better or worse off, since every big technological change seems to bring with it unintended consequences. To end, I was considering asking ChatGPT to write this post for me, using my own language and history, and I am open to the possibility that it could do a better job than I have. Stay tuned!

YouTube

Spreadsheets

  1. NVIDIA Valuation (June 2023)