In the first few weeks of 2022, we have had repeated reminders from the market that risk never goes away for good, even in the most buoyant markets, and that when it returns, investors still seem to be surprised that it is there. Investors all talk about risk, but there seems to be little consensus on what it is, how it should be measured, and how it plays out in the short and long term. In this post, I will start with a working definition of riskt that we can get some degree of agreement about, and then look at multiple measures of risk, both at the company and country level. In closing, I will talk about some of the more dangerous delusions that undercut good risk taking.
What is risk?
In the four decades that I have been teaching finance, I have always started my discussion of risk with a Chinese symbols for crisis, as a combination of danger plus opportunity:

Over the decades, though, I have been corrected dozens of times on how the symbols should be written, with each correction being challenged by a new reader. That said, thinking about risk as a combination of danger and opportunity is both healthy and all encompassing. It also brings home some self-evident truths about risk that we all tend to forget:
- Opportunity, without danger, is a delusion: If you seek out high returns (great opportunities), you have to be willing to live with risk (great danger). In fact, almost every investment scam in history, from the South Sea Bubble to Bernie Madoff, has offered investors the alluring combination of great opportunities with no or low danger, and induced by sweet talk, but made blind by greed, thousands have fallen prey.
- Danger, without opportunity, is foolhardy: In investing, taking on risk without an expectation of a reward is a road to ruin. If you are investing in a risky project or investment, your expected return should be higher to reflect that risk, even though fate may deliver actual returns that are worse than expected. Note that this common-sense statement leaves lots of details untouched, including how you measure risk and how you convert that risk measure into a higher "expected" or "required" return.
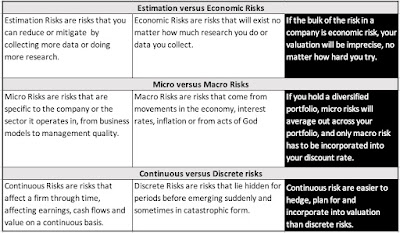
- It is uncertainty about outcomes, not expected outcomes, that comprise risk: In investing, we often make the mistake of assuming that risk comes from expected bad outcomes, when it is uncertainty about this expectation that drives risk. Let me use two illustrations to bring this home. In my last point on inflation, I noted that a currency with higher inflation can be expected to depreciate over time against a currency with lower inflation. That expected devaluation in the high-inflation currency is not risk, though, since it can and should be incorporated into your forecasts. It is uncertainty about whether and how much that devaluation will be, arising from shifting inflation expectations or market-induced noise, that is risk. In posts spread over many years, including this one, I have also argued against the notion that badly-managed firms are riskier than well-managed ones, and the reason is simple. If a firm is badly managed, and you expect it to remain badly managed, you can and should build in that expectation into your forecasts of that company's earnings and value. Thus, a badly managed firm, where you expect that to be the status quo, will be less risky than a well managed firm, where there is much more uncertainty about management turnover and quality in the future.
- Risk is in the future, not the past: Risk is always about the future, since the past has already revealed its secrets. That said, many of our perspectives about, and measures of, risk come from looking backwards, using the variability and outcomes of past data as an indicator of risk in the future. That may be unavoidable, but we have to be clear that this practice is built on the presumption that there have been no structural changes in the process being examined, and even if true, that the estimates that come from the past are noisy predictors of the future.
- Upside versus Downside Risk: If risk comes from actual outcomes being different from expectations, it is worth noting that those outcomes can come in better than expected (upside) or worse than expected. Since the entire basis of investing in risky assets is to benefit from the upside, it is downside risk that worries us, and in keeping with this perspective, there have to been attempts to derive risk measures that focus only on or more on downside risk. Thus, rather than use the variance in earnings or stock prices as a measure of risk, you compute the semi-variance, drawing on those periods where earnings and returns are less than expected. I think a more sensible path is to measure all risk, upside and downside, and think of good investing as a process of finding investments that have more upside risk than downside risk.
Risk and Hurdle Rates
In investing and corporate finance, we have no choice but to come up with measures of risk, flawed though they might be, that can be converted into numbers that drive decisions. In corporate finance, this takes the form of a hurdle rate, a minimum acceptable return on an investment, for it to be funded. In investing, it becomes a required return that you need to make an investment; you buy investments if you believe that you can make returns greater than their expected return and you sell investments if not. In this section, I will begin with a breakdown of risk's many components and use that structure to develop a framework for assessing the risk-adjusted required return on an investment.
The Components of Risk
1. Relative Risk Measures
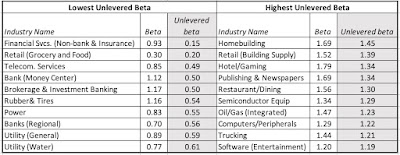
Before we embark on how to measure relative risk, where there can be substantial disagreement, let me start with a statement on which there should be agreement. Not all stocks are equally risky, and some stocks are more risky than others, and the objective of a relative risk measure is to capture that relative risk. The disagreements rise in how to measure this relative risk, and risk and return models in finance have tried, with varying degrees of success, to come up with this measure. At the risk of provoking the ire of those who dislike portfolio theory, the most widely model for risk, in practice, is the capital asset pricing model, and beta is the relative risk measure. Embedded in its usage is the assumption that the marginal investors in a stock, i.e., those large investors who set prices with their trading, are diversified, and that you can estimate the "non-diversifiable" risk in a stock, by regressing returns on a stock against a market index. I believe that a company's regression beta is an extremely noisy measure of its risk, and mistrust the betas reported on estimation services for that reason. I also believe that it is healthier to estimate the beta for a company by looking at the average of the regression betas of the companies in the sector that it operates in, and adjusting for the financial leverage choices of the company, since increasing dependence on debt also increases the relative risk of the company. As in prior years, I report industry-average betas, cleaned up for debt, at this link, for US companies, and you can sector-average beta for regional and global companies as well. At the start of 2022, the ten sectors (US) with the highest and lowest relative risk (unlettered betas), are shown below.
 |
| Download sector average betas (US, Global) |
2. Geographical Risk
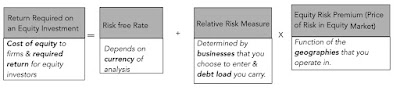
Beta measure the macro risk exposure of the businesses that a company operates in, but they are blunt instruments, incapable of capturing either country risk (from operating in the riskiest parts of the world) or discrete risk (from default, nationalization or other events that truncate a company's life). For measuring country risk, I fall back on an approach that I have used for the last three decades to estimate equity risk premiums for countries, where I start with the equity risk premium for the US and then augment that number with a country risk premium, estimated from the default spread for the country:

The equity risk premium for the US is the implied equity risk premium of 4.24%, the process of estimating which I described in an earlier data update post this year. The sovereign ratings for countries are obtained from Moody's and S&P, and the default spread for each ratings class comes from my estimates for the start of 2022. To illustrate, at the start of 2022, India was rated Baa3 by Moody's and the default spread (my estimate) for this rating was 1.87%. I scale that default spread up to reflect the higher volatility in stocks, relative to bonds, and I use 1.16, estimated from as the ratio of historical volatilities in S&P's emerging market stock to the volatility in an emerging bond indices. This approach yields a country risk premium of 2.18% for India, and an equity risk premium of 6.42%, to start 2022:
India's ERP at the start of 2022 = Mature Market ERP + Default Spread for India * Rel Vol of Equity
= 4.24% + 1.87% (1.16) = 6.42%
Using this approach to the rest of the world, here is what I get at the start of 2022:
 |
| Download country equity risk premiums |
3. Debt, Default Risk and Hurdle Rates
Almost all of the discussion so far has been about equity funding and its costs, but companies do raise funds from debt. While I will use a future post to talk about how debt levels changed in 2022, across the world, I want to talk about the cost of debt in this one. Specifically, the cost of debt for a company is the rate at which it can borrow money, long term, and today, and not the cost of the debt that is already on its books. The build up to a cost of debt is simple:
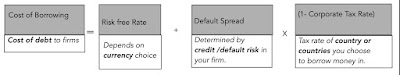
A company's default spread reflects concerns that lenders have about its capacity to meet its contractual commitments, and it clearly will be a function not only of the level and stability of its earnings, but even of the country in which it is incorporated.
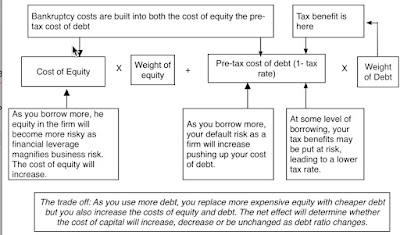
As companies raise money from both debt and equity, they face an overall cost of funding, which will reflect how much of each component they use, and the resulting number is the cost of capital. The picture below illustrates the linkages between the costs of equity and debt, and how as you borrow more, the effects on cost of capital are unpredictable, pushing it down initially as you replace more expensive equity with cheaper debt, but then pushing it up as the negative effects of debt offset its benefits:
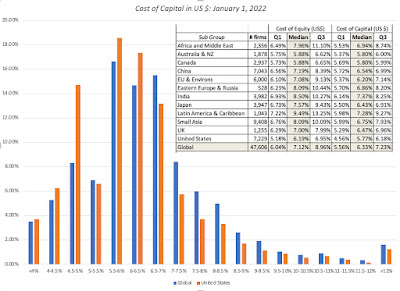
At the start of 2022, the median global company has a cost of capital of 6.33%, in US$ terms, and the median US company has a cost of capital of 5.77%. (To convert these values into other currencies, use the approach that I used in the last post, of adding differential inflation to the number).
Hurdle Rate Delusions
The two biggest forces that drive corporate financial and investor decision making are me-too-ism and inertia. The former (me-too-ism) leads companies to do what others in their peer group are doing, borrowing when they are, paying dividends because they do and even embarking on acquisitions to be part of the crowd. The latter (inertia) results in firms staying with policies and practices that worked for them in the past, on the presumption that they will continue to work in the future. Not surprisingly, both these forces play a role in how companies and investors set hurdle rates. Both individual investors and companies seem to operate under the delusion that hurdle rates should reflect what they want to make on investments, rather than what they need to make. The difference is illustrated every time an equity investor, in this market, posits that he or she will not buy shares in a company, unless he or she can make at least double digit returns, or a company, again in this market, contends that it uses a hurdle rate of 12% or 15%, in deciding whether to take projects. Individual investors who demand unrealistically high returns in a market that is priced to deliver 6-7% returns on stocks will end up holding cash, and many of them have been doing so for the bulk of the last decade. Companies that institute hurdle rates that are too high will be unable to find investments that can deliver higher returns, and will lose out to competitors who have more realistic hurdle rates. In short, companies and investors, demanding double digit returns, have to decide whether they want to remain delusional and be shut out of markets, or recalibrate their expectations to reflect the world we live in.
YouTube Video
Datasets
- Equity Risk Premiums, by country - January 1, 2022
- Betas by Sector (US, Global, Emerging Markets, Europe, Japan)
- Costs of Capital by Sector (US, Global, Emerging Markets, Europe, Japan)
No comments:
Post a Comment