In my last post, I talked about the ritual that I go through every year ahead of my teaching each spring, and in this one, I will start on the first of a series of posts that I make at the start of each year, where I look at data, both macro and company-level. In this post, I will provide a motivation, if you need one, for why I create and share the data updates, followed up by a description of my data sample, which includes publicly traded companies listed and traded across the world, as well as the data variables that I estimate and report.
Data: Trickle to a Flood!
It is perhaps a reflection of my age that I remember when getting data to do corporate financial analysis or valuation was a chore. To obtain company-level information, you needed to find its annual reports in physical form and for industry-level data, you were dependent on services that computed and reported industry averages, such as Value Line and S&P. The times have changed, and if there is a problem now, it is that we have too much data, rather than too little. As I noted in my posts on data disclosure last year, this has led to at least three unhealthy developments.
Data distractions: Faced with massive amounts of data, quantitative as well as qualitative, many investors and analysts find themselves distracted by immaterial, irrelevant and sometimes misleading data points along the way.
Data as a crutch: At the other extreme, there are some who believe that they answer to every question lies in the data, and that when seeking an input for valuation and corporate financial analysis, the data will provide it. Rather than make their best judgments or reason their way, when faced with estimation challenges, these investors and analysts embark on a search for more data, and if they do not find that data, they give up.
Data bias: There is the canard that data is objective, as opposed to estimates or judgments, which are considered subjective. That is not true! In my experience, data is malleable, and if there is enough of it at your disposal, you can screen it and selectively choose the data to support whatever viewpoint you want to advance.
During the course of my corporate finance and valuation journey, I have been guilty of all three of these sins, and it is to counter these pre-dispositions that I started spending the first week of every year looking at data with four objectives:
Get perspective: One of the challenges that anyone doing business analysis, investing or valuation faces is getting a measure of what comprises a reasonable value for a business metric. Thus, without a sense of what comprises a high or low profit margin for a firm, or what the cost of capital is for the typical company, it is easy to create "fairy tale" valuations and analyses. By the same token, it is impossible to use a pricing metric (PE or EV to EBITDA), without a sense of the cross sectional distribution of that metric at the time.
Mean reversion: I am not a knee-jerk believer in mean reversion, but the tendency for numbers to move back towards averages is a strong one. That said, to use mean reversion in analysis or investing, you need to know what these averages are, either over time or across companies, and data can help in that pursuit.
Counter made-up numbers: It remains true that people (analysts, market experts, politicians) often make assertions based upon either incomplete or flawed data, or no data at all. For instance, is it true, as some assert, that inflation was high last year because companies raised prices to increase profits? Or, do US companies pay far less in taxes than companies incorporated in the rest of the world? Rather than indulge in endless debates, where each side provides anecdotal evidence, data can prove to be the tie-breaker.
Check rules of thumb: Investing and corporate finance are full of rules of thumb, many of long standing. For example, I have seen it asserted that a stock that trades at less than book value is cheap or that a stock that trades at more than twenty times EBITDA is expensive. These assertions may very well be true, but cheap and expensive, at least in pricing terms, is relative, and looking at the data can help you detect rules of thumb that work from those that do not.
When valuing or analyzing a company, I find myself looking for and using macro data (risk premiums, default spreads, tax rates) and industry-level data on profitability, risk and leverage. Rather than collecting this data each time I do an analysis, I realized that having these numbers computed and ready to go ahead of the analysis not only saves me time, but also allows me to focus more on the company that I am valuing and analyzing. I also realized that while these numbers are useful to me, they could be useful to others doing analysis as well, and I could not think of a single reason not to share what I had on hand.
Data: Sources and Description
My first attempt at sharing data was in 1997, and it was limited to about a dozen data sets, all related to US companies, and I never expected very many people to use my data. That has changed, and this year, I am posting two hundred data sets, including more than a thousand data items, and extended the coverage to global companies. While I hope that you find this data useful, I also hope that you will spend a few minutes reading what I have to say about the companies that comprise my data universe, the data items I report on, the timing of the data and caveats.
Data Universe and Grouping
At first sight, computing an industry average seems like a simple computation, where you take individual company numbers in an industry group and average them out. However, embedded in this statement are multiple estimation choices that you have to make that affect the reported numbers, and it behooves me to describe my choices:
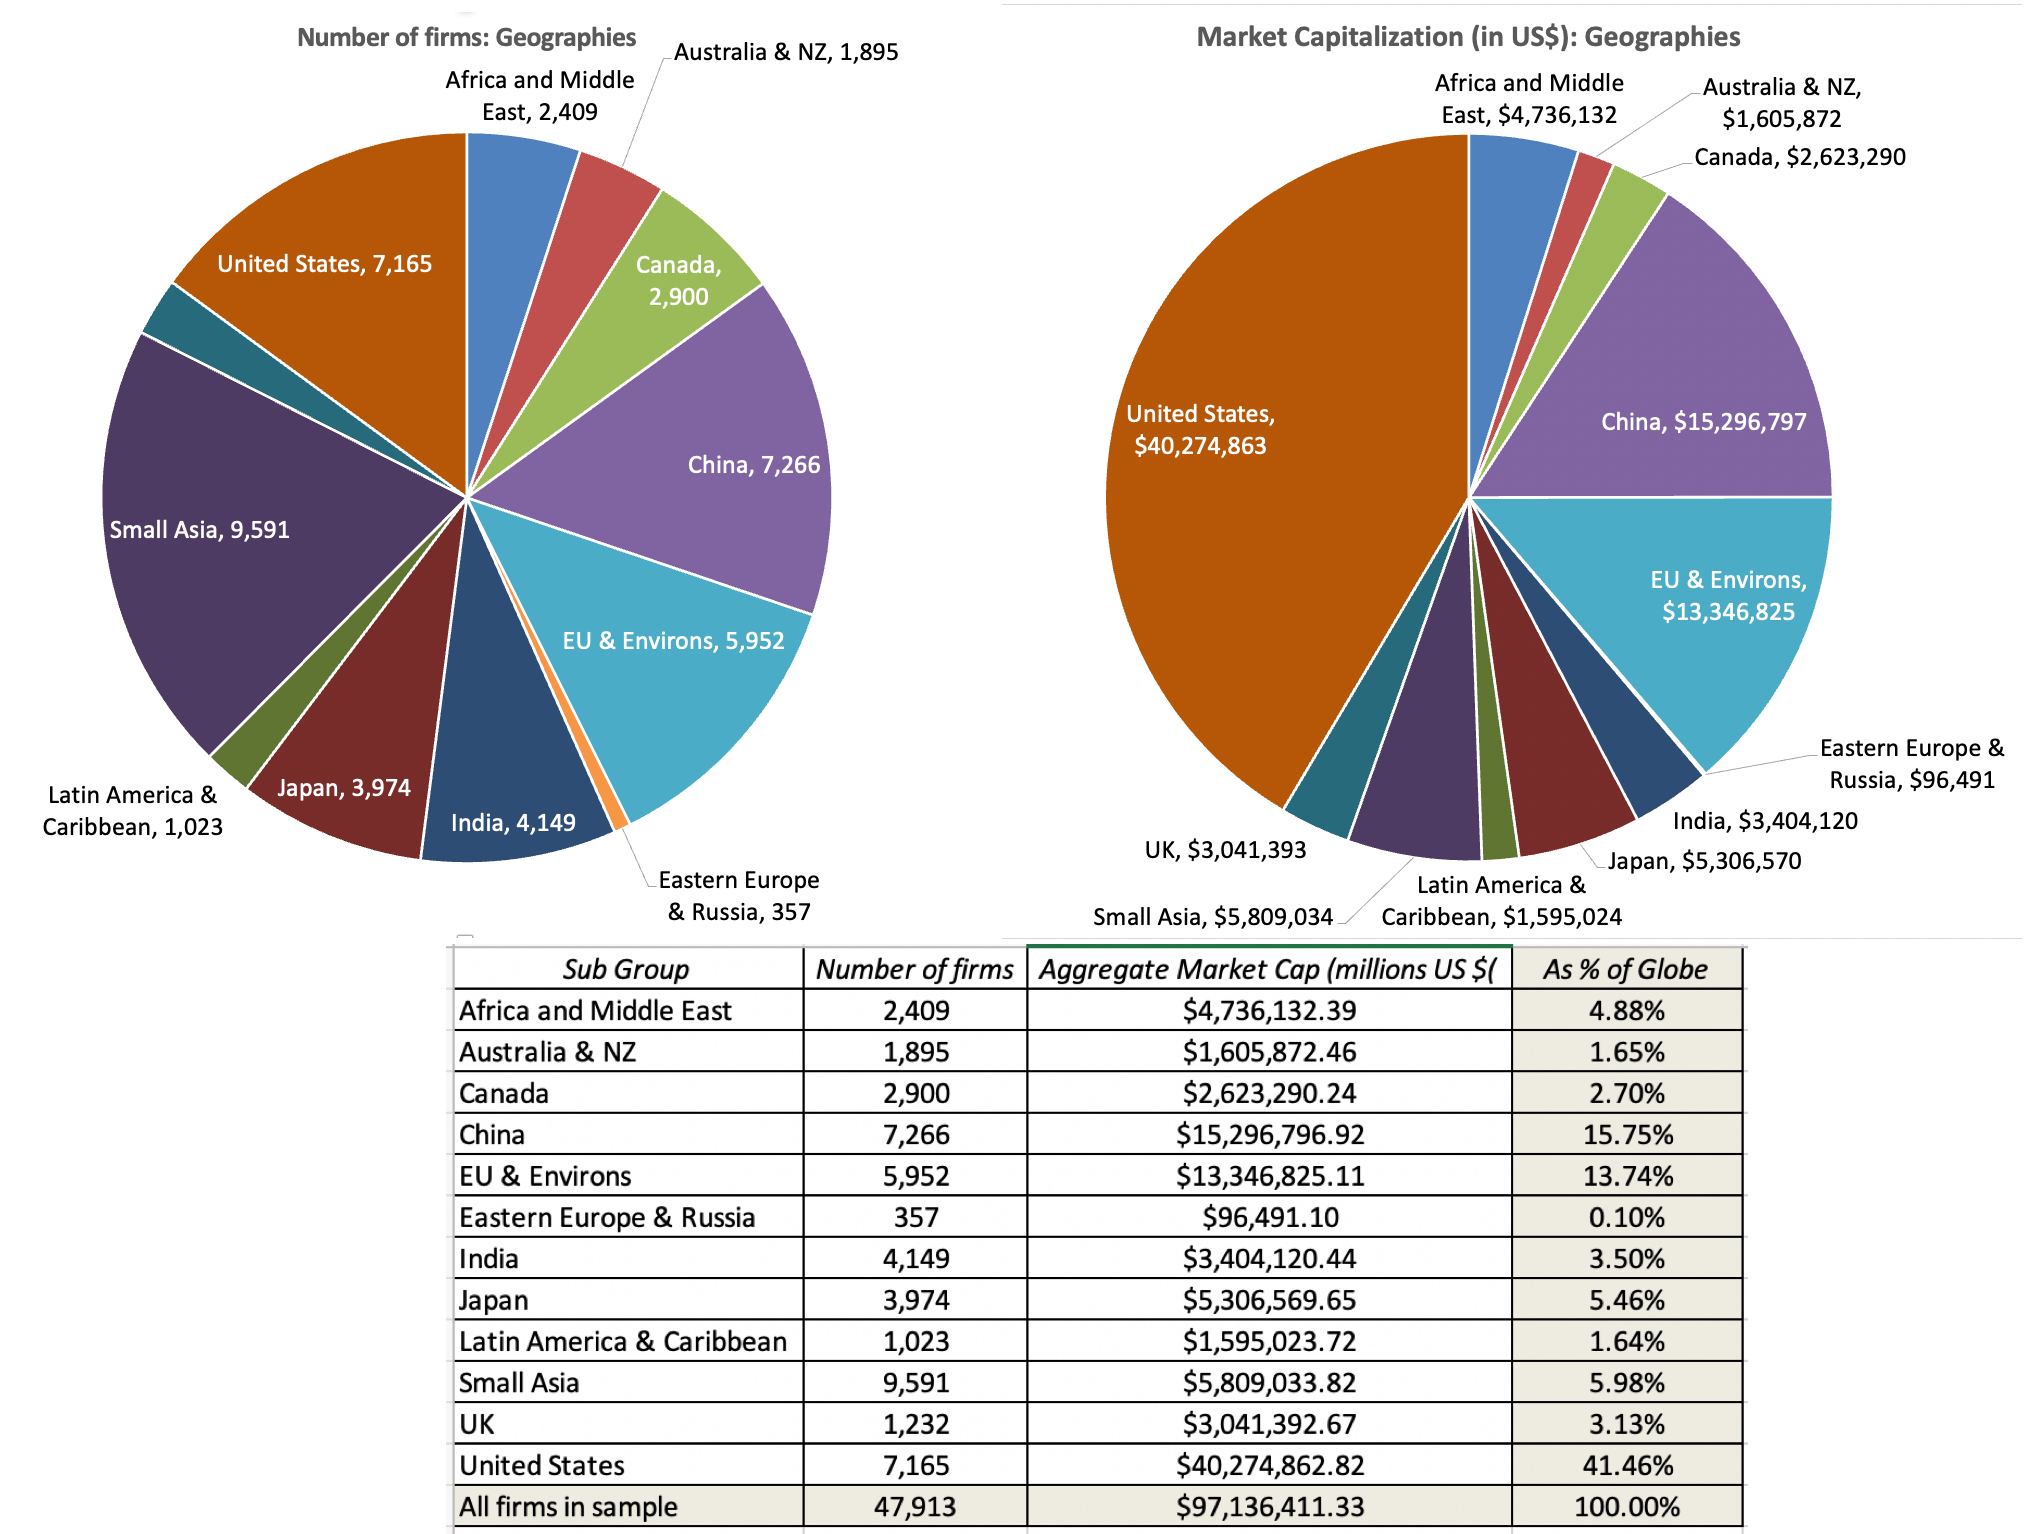
1. Data universe: In my sample, I include all publicly traded firms with market capitalizations that exceed zero, traded anywhere in the world. While there are risks bringing in very small and lightly-traded companies, with shaky data, into the sample, I include them to avoid the biases that will be created in industry averages by looking at just larger publicly traded companies, or just US-listed companies. In January 2023, I ended up with 47,913 publicly traded firms in my sample, with the pie chart below providing a geographic breakdown.
Speaking of biases, I do exclude privately owned (non-listed) companies for two reasons. The first is that in much of the world, these companies are not required to make their financial statements public, thus making it impossible to get the data. The second is that for data items that require market prices, including all the pricing metrics, private businesses cannot be included, since they have no market values.
2. Sectors and Industries: To make data useful for corporate financial analysis and valuation, I break the companies down into groupings, based upon the sectors and industries that they operate in. For the former, I use S&P's sector categorization and for the latter, I create 95 industry groups, built to allow users of my data to compare statistics over time. The sector breakdown of my overall sample is reported below:
My industry groupings are open to questioning for many reasons. First, for multi-business companies, I use the company's primary business (in terms of revenues) for categorization. Second, for some companies, it is not clear what industry group best fits the company. Thus, for Apple, it is unclear whether to put the company into company hardware, reflecting its history as a computer maker, or telecommunication equipment, reflecting its current dependence on the iPhone.
Data Items
Much of my focus, when it comes to data, is on company-specific variables, rather than macro economic data, for two reasons. The first is that there are other and much better sources for raw macroeconomic data than mine, and my favorite remains. Federal Reserve Economic Data (FRED): This is hands down, in my view, the best site for macroeconomic data in the world. While its focus is naturally on the US economy, inflation and rates, there is data for the rest of the world as well. I do report on a few market-wide data items especially on risk premiums for both equity and debt. The second is that in my line of work, which is corporate finance and valuation, the numbers I need lie in micro or company-level data, not in the macro space.
At the company-level, I provide data on risk, profitability, leverage and dividends, broken down by industry-groups, to be used in both corporate finance and valuation. I also report on pricing statistics, again broken down by industry grouping, with equity (PE, Price to Book, Price to Sales) and enterprise value (EV/EBIT, EV/EBITDA, EV/Sales, EV/Invested Capital) multiples. The table below shows a subset of the data items that I have on my website, with the links to the US versions of the data sets, in html. To get to the excel versions of this data, or the excel versions by region (Emerging Markets, Europe, Australia & Canada, Japan) as well as globally, please go the current data page of my website:
If you are interested in the archived data from prior years, you can get them by going to this link. For a description of the variables (and how I compute them), please try this link.
Data Timing
There is one final estimation detail that needs clarification. I did my updates in the last week (January 1- January 5, 2023), and used the most updated data that I could find on each company.
For market data, where the updating is continuous, that is data as of the January 1, 2023. Thus, market capitalization, interest rates and risk premiums, the data is as of that date.
For accounting flow items, in income statements and statements of cash flows, such as revenues, earnings and expenses, I used the data in the most recent twelve months of reporting; for most firms, that data is from October 2021 to September 2022.
For accounting stock items, from balance sheets, I use the numbers from the most recent balance sheet; again, for most firms, the numbers are from the balance sheets, as of September 30, 2022 or the most recent quarterly statements.
While these timing differences may strike some as inconsistent, they do meet my timing consistency test, which is that they are the most updated numbers that decision-makers (CFOs and investors) would have as of January 1, 2023.
Data Caveats
I have no qualms about sharing my data, since there is nothing particularly original or unique about what I do, and I am glad that there are some to whom the data is proving useful. If I save analysts and investors time in their decision making, I consider the time spent on my data analysis to have earned its required returns and more. Given the wide range of uses to which my data is put, I do have some caveats on its usage.
Mistakes and Errors: I am a team of one, reflecting more my desire for control that unwillingness on the part of others to help. That said, working with a data sheet with 47,913 companies and hundreds of data items can get daunting, as is updating individual excel sheets, by variable and region. If you find a mistake or mistakes, please bring it to my attention and I will fix it.
Judgment calls: I have made judgment calls starting with my creation of industry groups (which you may not like) and my assignment of companies into groups. Some take issue with my regional classifications, arguing that Mexico should be North America (geographically, you are absolutely right) rather than in Latin America (which is where I put it).
Company-level data: I do not provide company-level data for two reasons. One is that it would violate agreements that I (or NYU) have with my raw data providers and the other is that getting company-level data has become trivial. I know that most of you cannot afford a Bloomberg terminal or S&P Capital IQ, but you can get the data not just from Yahoo! Finance but also from a variety of online data services that are affordable and very well done.
Agenda: If you are using my data to advance a point of view that you hold, you are welcome to do so, but please be clear that this is your reading of my data, not mine. If you are in a fight (legal or online) and using my data as ammunition, you are entirely on your own, and I will not enter the fight on either side, unless you have a clarification question.
Staleness: I update my data once a year, and I will not return to do an update until January 2024; the equity risk premiums for the US will get updated every month and the equity risk premiums for other countries will get a mid-year update. While I have no compunctions continuing to use industry averages for risk, profitability and leverage over the course of the year, the pricing metrics (PE, EV/EBITDA etc.) will become dated as the year goes on, and especially so if the market moves up or down significantly.
You owe nothing to me for the data, and if it does get you into trouble, feel free to blame me. If you really want to offer something in return, the best favor you can do for me is to help someone else out there.
The Posts to come
In the posts to come, I will talk about what the numbers tell us about the state of the market and the companies that inhabit them, as of the start of 2023. It is undeniable that 2022 was a tumultuous year, with inflation taking center stage, and driving markets. In my next three posts, I will look at inflation's effects on equity markets (in post 2), government and corporate bond markets (in post 3) and other asset classes (real estate, collectibles and cryptos). For those who had become somnolent about country risk, the year provided a reminder of how quickly country risk can flare up and change, with Russia's invasion of Ukraine a precipitating factor, and in my fifth post, I will look at the evolution of country risk during the year. In the three posts that follow, I will look at the shifts in corporate hurdle rates (in post 6), debt loads and worries (in post 7) and dividends/cash returned in post 8. In the ninth post, I will look at how market pricing changed during 2022, across sectors/industries (with technology taking the biggest hit) as well as across growth and corporate life cycles. There is always the chance that I will get distracted along the way, since I want to value Tesla later this month and return to my FANGAM valuations in February!
I spent the first week of 2021 in the same way that I have spent the first week of every year since 1995, collecting data on publicly traded companies and analyzing how they navigated the cross currents of the prior year, both in operating and market value terms. I knew that this year would be more challenging than most other years, for two reasons. The first was that the shut down of the global economy, initiated by the spreading of COVID early last year, had significant effects on the operations of companies in different sectors, and across the world. The second was that, starting mid-year in 2020, equity markets and the real economy moved in different directions, with the former rising on the expectations a post-virus future, and the latter languishing, as most of the world continued to operate with significant constraints. In this post, I will start with a rationalization of why I do this data analysis every year, follow up with a description (geographic and sector) of the overall universe of companies that are in my analysis, list out the variables that I estimate and report, and conclude with a short caveat about 2020 data.
Data: A Pragmatist View
We live in the age of data worship, where investors, analysts and businesses all seem to have bought into the idea that big data has answers for every question and that collecting the data (or paying for it) will create positive payoffs. I am a skeptic and I have noted that to make money on big data, two conditions have to be met:
If everyone has it, no one does: I believe that if everyone has a resource or easy access to that resource, it is difficult to make money off that resource. Applying that concept to data, the most valuable data is unique and exclusively available to its owner, and the further away you get from exclusivity, the less valuable data becomes.
Data is not dollars: Data is valuable only if it can be converted into a product or service, or improvements thereof, allowing a company to capture higher earnings and cash flows from those actions. Data that is interesting but that cannot be easily monetized through products or services is not as valuable.
All of the data that I use in my data analysis is in the public domain, and while I am lucky enough to have access to large (and expensive) databases like Bloomberg and S&P, there are tens of thousands of investors who have similar access. Put simply, I possess no exclusivity here, and staying consistent with my thesis, I don't expect to expect to make money by investing based upon this data. So, why bother? I believe that there are four purposes that are served:
Gain perspective: One of the challenges of being a business or an investor is developing and maintaining perspective, i.e., a big picture view of what comprises normal, high or low. Consider, for instance, an investor who picks stocks based upon price to book ratios, who finds a stock trading at a price to book ratio of 1.5. To make a judgment on whether that stock is cheap or expensive, she would need to know what the distribution of price to book ratios is for companies in the sector that the company operates in, and perhaps in the market in which it is traded.
Clear tunnel vision: Investors are creatures of habit, staying in their preferred markets, and often within those markets, in their favored sectors. Equity research analysts are even more focused on handfuls of companies in their assigned industries. So what? By focusing so much attention on a small subset of companies, you risk developing tunnel vision, especially when doing peer group comparisons. Thus, an analyst who follows young technology companies may decide that paying ten times revenues for a company is a bargain, if all of the companies that he tracks trade at multiples greater than ten times revenues. Nothing is lost, and a great deal is gained, by stepping back from your corner of the market and looking at how stocks are priced across industries and markets.
Expose BS: I know that everyone is entitled to their opinions, but they are not entitled to their facts. I am tired of market experts and analysts who make assertions, often based upon anecdotal evidence and plainly untrue, to advance a thesis or agenda. Are US companies more levered than they were a decade ago? Do US companies pay less in taxes than companies in other parts of the world? Are companies that buy back stocks more financially fragile than companies that do not? These are questions that beg to be addressed with data, not emotions or opinions. (I know.. I know... You would like those answers now, but stay tuned to the rest of my data updates and the data will speak for itself.)
Challenge rules of thumb and conventional wisdom: Investing has always had rules of thumb on how and when to invest, ranging from using historical PE or CAPE ratios to decide if markets are over valued, to simplistic rules (eg. buy stocks that trade at less than book value or trade at PEG ratios less than one) for individual stocks. It is very likely that these rules of thumb were developed from data and observation, but at a different point in time. As markets and companies have moved on, many of them no longer work, but investors continue to use them. To illustrate, consider a practice in valuation, where analysts are trained to add a small cap premium to discount rates for smaller companies, on the intuition that they are riskier than larger companies. The small cap premium was uncovered in the the early 1980s, when researchers found that small cap stocks in the US earned significantly higher returns than large cap stocks, based upon data from 1926 to 1980. In the decades since, the small cap premium has disappeared in returns, but inertia and laziness have kept the practice of adding small cap premium alive.
In closing, I also want to dispense with the notion that data is objective and that numbers-focused people have no bias. If you have a bias or a preconception, it is amazing how quickly you can bend the data to reflect that bias or preconception. As an exercise, take a look at my updated industry averages for taxes paid by US companies in 2021. From past experience, I predict that numbers in this table will be quoted by journalists, economists and even politicians, with very different agendas, but the tax rate measure (since I report several different measures) that they quote will reflect their biases. Put simply, if you find my data quoted elsewhere, I would suggest that you visit the source and make your own judgments.
The Sample
The focus in markets is often on subsets of firms, usually with good reason. In general, larger firms (especially in market value terms) get more attention that smaller ones, because their movements in their value are more consequential for more investors Also, publicly traded firms generally garner more attention than privately owned businesses, partly because they are larger, but also because there are is more information disclosed and investment opportunity with the former. Finally, fair or not, companies in developed and more liquid markets are in the spotlight more than their counterparts in emerging markets. That said, focusing on just large or developed market companies can create biased samples and skew assessments about market and operating performance. It is to avoid this that I started by looking at all publicly traded companies that were traded on January 1, 2021, and arrived at a sample of 46,579 firms, spread across 136 countries.
While the universe of companies is diverse, with approximately half of all firms from emerging markets, it is more concentrated in market capitalization, with the US accounting for 40% of global market capitalization at the start of the year. Using the S&P categorization of global companies into sectors, the data universe looks as follows:
It should come as no surprise, especially given their performance over the last year, that the technology sector is the largest in terms of market capitalization. While some of the companies in this data trace their existence back decades, there is a healthy proportion of younger companies, many in emerging markets and new industries.
Finally, it is worth noting that, notwithstanding the travails of last year, the number of firms in the data universe increased from 44,394 firms at the start of 2020 to 46,579 firms, a 4.9% increase over the year, as new listings outnumbered companies that defaulted during the course of the year.
If there is a hole in my sample, it is the absence of privately owned businesses. One reason is that these businesses are not only not required to publicly disclose their financial details in most parts of the world, but often follow more malleable accounting standards, making the data less reliable and comparable. The other is that even in those parts of the world, where private company information is available, the data is limited and market price data is missing (since the companies are not traded). That said, it does mean that any broad conclusions (about profitability and revenues) that emerge from my data apply to public companies, and it may be dangerous to extrapolate to private businesses, especially in a year like 2020 where private businesses could have been affected more adversely by COVID shutdowns than public companies.
The Data
As more data has become publicly available, and access to the data becomes easier, the challenge that we face in investing and valuation is that we often have too much data, and information overload is a clear and present danger. In this section, I will list the data that I estimate and report, as well as explain how I consolidate company-level data into more usable group statistics.
General Details
While there are advantages to looking across all firms, small and large, listed anywhere in the world, there are challenges that come from casting such a wide net. I have tried my best to keep them from overwhelming the analysis, and in the interests of openness, here are some of the details:
Currency: One of the challenges of dealing with a global sample is that you are working with accounting and market numbers quoted in multiple currencies, and since you cannot aggregate or average across them, I will employ two techniques. First, all value numbers (like market capitalization, debt or revenues) that I aggregate or average will be converted into US dollars to ensure currency consistency. Second, most of the numbers that I report will be ratios, where the currencies are no longer an issue; a PE ratio for a Turkish company, with market cap and earnings denominated in Turkish Lira, can be compared to the PE ratio for a US company, with market cap and earnings denominated in US $. It is true that the Turkish company will face more risk because of its location, but that is an issue separate from currency.
Missing Data: Information disclosure requirements vary across the world, and there are some data items that are available for some companies or some markets, and not for others. Rather than remove all firms with missing data, which will eliminate a large portion of my sample, I keep the firms in the sample and report only the variable/metric that is affected by the missing item as "NA". For instance, I have always computed the present value of lease commitments in future years and treated that value as debt, a practice that IFRS and GAAP have adopted in 2019, but that computation requires explicit disclosures of lease commitments in future years. That is standard practice in the United States, but not in many emerging markets, but rather than not do the computation for all companies or remove all companies with missing lease commitments, I compute lease debt for those companies that report commitments and report it as zero for those companies that do not, an imperfect solution but the least imperfect of the many choices.
Accounting Differences: In addition to disclosure differences, there are also accounting differences in revenue recognition, expensing rules, depreciation methods and other details across markets. I work with the publicly available data, recognizing that net income for a Japanese company may be measured differently than earnings for an Indian company, and accept that this may skew the results. However, it is worth noting that accounting rules around the world have converged over the last four decades, and they share a lot more in common than they have as differences.
Source Reliability and Errors: I obtain my raw data from S&P, Bloomberg and others, and I am grateful that I can do that, because I could never hand collect and input data on 40,000+ companies. They, in turn, obtain the data from computerized databases in different markets that collect public filings, and at every stage in this process, there is the possibility of errors. I do run some simple error checks to eliminate obvious mistakes, but I am sure that there are others that I miss. My defense is that, unless the mistake is on a very large scale, the impact it has on my group statistics is small, simply because of my sample size. In addition, there is also the possibility of accounting fraud in some companies, and there is little or nothing that can be done about them.
I am not trying to pass the buck or evade responsibility for any mistakes that persist but if you do find odd looking values for some variables that I report, especially for small samples, take them with a grain of salt.
Macro Data
I do not report much macroeconomic data for two reasons. The first is that I do not have a macro focus, and my interests in macro variables occur only in the context of corporate finance or valuation issues. The second is that there are great (and free) sources for macro economic data, ranging from the Federal Reserve (FRED) to the World Bank and I don’t see the point of replicating something that they already do well. The macro variables that I track on my site relate to the price of risk, a key input into valuation, in both equity and debt markets:
US Equity Risk Premiums: The equity risk premium is the price of risk in equity markets. In my view, it is the most comprehensive measure (much more so than PE ratios or other pricing multiples) of how stocks are being priced, with a higher (lower) equity risk premium correlating with lower (higher) stock prices. The conventional approach to measuring this premium is looking at past returns on stocks and treasuries (or something close to riskfree) and measuring the difference in historical returns and I report the updated levels (through 2020) for historical premiums for stocks over treasuries in this dataset. I have argued that this approach is both backward looking and static, and have computed and reported forward-looking and dynamic equity risk premiums, based upon current stock price levels and expected future cash flows; you can find both the current level and past values in this dataset.
Country Risk Premiums: In a world where both investing and business is globalized, we need equity risk premiums for markets around the world, not only to value companies listed in those markets, but also to value companies that have operations in those countries. I will not delve into the details here, but I use the same approach that I have used for the last 30 years to estimate the additional risk premiums that I would charge for investing in other markets to get equity risk premiums for almost every country in the world in this dataset.
Bond Default Spreads: The bond default spread is the price of risk in corporate bond (lending) markets, and as with the equity risk premium, higher (lower) spreads go with lower (higher) corporate bond prices. In the same dataset where I compute historical equity risk premiums, I report historical returns on corporate bonds in two ratings classes (Moody’s Aaa and Baa ratings). I also report estimates of the default spreads based upon current yields on bonds in different ratings classes and the current riskfree rate.
I am not an interest rate prognosticator, but since today’s low rate environment seems to have made everyone a forecaster of interest rates, I do compute an intrinsic version of the US treasury rate and compare it to current levels in this dataset.
Micro Data
The focus of my data collection is understanding how companies are operating and how investors are pricing them. That said, you will not find individual company data on my site for two reasons. The first is that I bear a responsibility (ethical and legal) to my raw data providers to not undercut their businesses by giving away that data for free. The second is that you don’t need my site or any public site to get data on an individual company; if you want to get data on a company, there is no better way to do it than go to the source, which is the company’s annual or quarterly filings. To understand and use the data, here are some specifics that you may (or may not) find useful:
Industry: Data can be consolidated by geography, industry or company size, and I use all three, to some extent or the other. My primary consolidation is by industry and I break down my sample of 46,579 firms into 94 industry groupings. To make this classification, I start with the industry classifications that are in my raw data, but create my own industry groups, again to prevent stepping on the toes of my data providers. I know that this description is opaque, but the best way to understand my industry groups is to go to this dataset, where I report the companies that I include in each industry.
Geography: There is one dataset where I look at companies broken down by country, and I report a number of different statistics for 136 countries. I would caution you to take this data with a grain of salt, since there are only a handful of listings in some country. I do report much more data for a broader geographical classification, where I classify firms into six broad geographical groupings: Note that while emerging markets is a very large and diverse group, I do report statistics for India and China, two of the bigger components, separately.
Averaging: I hope it does not sound patronizing, but I want to explain how I compute group values (averages), because it is not as obvious as it sounds. To illustrate why, consider the challenge of computing the PE ratio for companies in the software industry. You could compute the PE ratio for each company in the group and take a simple average, but that approach has two problems. First, it weights small firms as much as large firms, and outliers can cause the average to take on outlandish values. Second, it eliminates firms that have negative earnings (and thus have no PE ratios) from the sample, potentially creating biased samples. Using a weighted average PE ratio can counter the first problem and using a median can reduce the outlier effect, but neither approach can deal with the second problem (of sample bias). For most of my industry averaging, I use an aggregation approach, where I compute ratios using aggregated values; to compute the PE ratio for chemical companies, I add up the market capitalizations of all chemical companies and divide that number by the aggregate net income of all chemical companies (including money losers). This ensures that (a) all companies are counted, (b) the computed number is weighted since larger companies contribute more to the aggregate and (c) the risk of outliers is reduced, since it is less likely to occur in a large sample than for an individual firm.
Current data: The focus of this data update is to report on how companies did in 2020, rather than to provide historical time series. Since I am updating the data in early January 2021, and the complete numbers for 2020 will not be available until March or April at the earliest, I will be using the trailing twelve month numbers for operating variables (like revenues and operating income) to compute ratios. For accounting numbers, that will effectively be the twelve months through September 30, 2020, that will be captured in the data. This practice of focusing on current data can cause the computed numbers to be volatile, but I do have the archived data going back in time (more than 20 years in the US, less for other parts of the world) at this link.
Variables
I confess that I have a primary constituency when I think of the variables that I would like to estimate, and that (selfishly) is me. Since my interests lie in corporate finance and valuation, the statistics that I compute are numbers that I will find useful when doing a corporate financial analysis or valuation of a company. Since I compute and report on dozens of variables, the best way of summarizing what you will find on my website in the following picture:
With each variable, I report the industry averages by geography. With cost of capital, for instance, I report the cost of capital by industry for the US at this link, and datasets that can be downloaded by geography: Europe, Emerging Markets (China and India), Australia, NZ & Canada, Japan & Global).
COVID Effects
I would normally not belabor the fact that my data is focused on the most recent year, but 2020 was an unusual year. Starting in February and extending for most of the rest of the year, the economic shutdown created turmoil in both financial markets an the real economy. While markets, for the most part, have recovered strongly, large segments of the real economy have not. Consequently, there are a couple of considerations if you use this year’s numbers:
COVID effects: To capture how COVID has played out in different sectors and geographies, I computed the changes in aggregate market capitalization during 2020 broken down by sub periods (1/1/20 - 2/14, 2/14- 3/20, 3/20 - 9/1 and 9/1 - 12/31/20), reflecting the ups and downs in the overall market. I also looked at the change in revenues and operating income over the last twelve months (October 2019 - September 2020) compared to revenues in the year prior (October 2018 - September 2019). Since the worst effects of the crises were in the second and third quarters of 2020, this comparison should provide insight into how much damage was wrought by the viral shutdown. Just as a preview of how consequential the year was for stock prices, take a look at the median percentage change in market capitalization in the table below:
Operating metrics: My computations for operating margins and accounting returns (returns on equity and capital) reflect the COVID effect on earnings in 2020, and not surprisingly, you will see that their values are much lower for the most damaged sectors (restaurants, airlines) than in prior years. If you are comparing across companies in these sectors, that may not be an issue, but if you are valuing companies and want to find a target value for margins or accounting returns, you will be better served using my archived values for these variables from 2019.
Pricing metrics: I compute and report a range of pricing multiples from PE ratios to Enterprise Value (EV) to sales ratios, but as with the operating metrics, COVID has left its imprint on the numbers this year. As market capitalizations have quickly retraced their losses, but operating variables have not, the multiples reflect that disconnect. They are either not meaningful in some sectors, which are reporting aggregated losses, or at elevated levels in others (where the collective earnings are down significantly, but market values are not). Again, while this should not be an issue with cross company comparisons, there are two cautionary notes. The first is that investors who come in with strong preconceptions of what comprises cheap or expensive in pricing ratio terms or historic norms will find that everything looks exorbitantly priced. The other is that you will lose large segments of your peer groups if you stick with multiples like PE ratios for comparisons, since so many companies will be money losing.
Access and Use of Data
I know that the numbers (in terms of companies and variables) makes this data update sound like daunting work, but I will make a confession. I enjoy the process, even including the messy details, and it prepares me for the year to come. In fact, the time that this aggregated data saves me through the year, when I value and analyze companies, represents a huge multiple of the time I spend putting it together. Put simply, if you are tempted to anoint me for sainthood for sharing my data, you are overreaching because I would do it anyway, and sharing it costs nothing, while potentially benefiting you. If you decide to use the data, here are some things that I hope you will consider:
Data access: The data is accessible on my website, if you click on data. The data for 2020 is available under current data, and data from previous years under archived data. If you do click on current data, you will see the data classified into groupings based upon how I see the world (corporate governance, risk, investment returns, debt, dividends and pricing). You can see the data online for US companies by clicking on the links next to the data item, but I would strongly recommend that you download the excel spreadsheets that contain the data instead. Not only will this let you access data for other geographical regions, but each excel spreadsheet includes descriptions of the variables reported in that dataset and many include short YouTube videos explaining the data.
Data Use: I know that those who download my data use it in many different contexts. If you use it at their jobs as corporate finance or equity analysts, I am glad to take some of that burden off you, and I hope that you find more enjoyable uses for the time you save. If you use my data to buttress an argument or debunk someone else’s, I wish you the best, as long as you don’t make it personal. If you use is it to back your case in legal settings, go ahead, but please do not involve me formally. I believe that courts are a graveyard for good valuation practices and while I do not begrudge you, I have no interest in playing that game.
Data Questions: If you have a question about how a variable is computed, please check the website first, since the question has probably been answered already, but if you cannot find that answer, you know how to find me, and I will try to address your issues. As I mentioned earlier, the excel spreadsheets that contain the data include the descriptions of how I compute the variables.
Suggestions and Complaints: Before you send off angry or impassioned emails to my team, about my data, you should know that this team has only one member and it is me. I am not a full time data service, and I cannot provide customized data solutions. If you find a mistake in a computation or a typo, please do let me know, and I will fix the error, perhaps not as quickly as you would like me to, but I will.
In sum, I hope you find the data that I provide useful. In the next month, I will add about a dozen posts on what I see in the data, but I will do so with the recognition that change is the only constant and that assuming that things always revert back to historic norms is not an investment philosophy.
Starting in the early 1990s, I have spent the first week or two of every new year playing my version of Moneyball, downloading raw market and accounting data on publicly traded companies and using that data to compute operating, pricing and risk metrics for them. This year, I got a later start than usual on January 6, but as the week draws to a close, the results of my data exploration are posted on my website and will be the basis for a series of posts here over the next six weeks. As you look at the data, you will find that the choices I have made on how to classify companies and compute metrics affect my findings, and I will use this post to cast some light on those choices.
The Data
Raw Data: We live in an age when accessing raw data is easy, albeit not always cheap, and the tools to analyze that data are also widely available. My raw data is drawn from a variety of sources, ranging from S&P Capital IQ to Bloomberg to the Federal Reserve, and there are two rules that I try to follow. The first is to be careful about attributing sources for the raw data, and the second is to not undercut my raw data providers by replicating their data on my site, if they have commercial interests.
Data Analysis: Broadly speaking, I would categorize my data updates into three groups. The first is macro data, where my ambitions tend to be modest, and the only numbers that I update are numbers that I need and use in my valuation and corporate financial analysis. The second is business data, where I consolidate the company-level data into industry groupings, and report statistics on how companies invest, finance their operations and return cash (dividends and buybacks). The third are my data archives, where you can look at trend lines in the statistics by accessing my statistics from prior years.
A. Macro Data
I am not a market timer or a macro economist, and my interests in macro data are therefore limited to numbers that I cannot easily look up, or access, on a public database. Thus, there is no point in my reporting exchange rates between major currencies, when you have FRED, the Federal Reserve site , that I cannot praise more highly for its reach and its accessibility. I do report and update the following:
Risk free rates in currencies: The way in which currencies are dealt with in valuation and corporate finance leaves us exposed to multiple problems, and I have written about both why risk free rates vary across currencies and why government bond rates are not always risk free. At the start of every year, I update my currency risk free rates, starting with the government bond rates, and then netting out default spreads and report them here. As risk free rates in developed market currencies hit new lows, and central banks are blamed for the phenomenon, I also update an intrinsic measure of the US dollar risk free rate, obtained by adding the inflation rate to real GDP growth each year, and report the time series in this dataset.
Equity Risk Premiums: The equity risk premium is the price of risk in equity markets and plays a key role in both corporate finance and valuation. The conventional approach to estimating this risk premium is to look at history, and to compare the returns that you would have earned investing in stocks, as opposed to investing in risk free investments. I update the historical risk premium for US stocks, by bringing in 2019 returns on stocks, treasury bonds and treasury bills in this dataset; my updated geometric average premium for stocks over US treasuries. I don't like the approach, both because it is backward looking and because the risk premium estimates are noisy, and have argued for a forward looking or implied ERP. I estimate the implied ERP to be 5.20% at the start of 2020 and report the year-end estimates of the premium going back to 1960 in this dataset.
Corporate Default Spreads: Just as equity risk premiums measure the price of risk in equity markets, default spreads measure the price of risk in the debt markets. I break down bonds into bond rating classes (S&P and Moody's) and report my estimates of default spreads at the start of 2020 in this spreadsheet (and it includes a way of estimating a bond rating for a firm that does not have one).
Corporate Tax Rates: Ultimately, companies and investors count on after-tax income, though companies are adept at keeping taxes paid low. While I will report the effective tax rates that companies actually pay in my corporate data, I am grateful to KPMG for going through tax codes in different countries and compiling corporate tax rates, which I reproduce in this dataset.
Country Risk Premiums: As companies expand their operations beyond domestic markets, we are faced with the challenge of bringing in the risk of foreign markets into our corporate financial analyses and valuation. I have spent much of the last 25 years trying to come up with better ways of estimating risk premiums for countries, and I describe the process I use in excruciating detail in this paper. At the start of 2020, I use my approach, flaws and all, to estimate equity risk premiums for 170 countries and report them in this dataset.
With macro data, it is generally good practice in both corporate finance and valuation to bring in the numbers as they are today, rather than have a strong directional view. So, uncomfortable though it may make you, you should be using today's risk free rates and risk premiums, rather than normalized values, when valuing companies or making investment assessments.
B. Micro Data
The sample: All data analysis is biased and the bias starts with the sampling approach used to arrive at the data set. My data sample includes all publicly traded companies, listed anywhere in the world, and the only criteria that I impose is that they have a market capitalization number available as of December 31, 2019. The resulting sample of 44,394 firms includes firms from 150 countries, some of which have very illiquid markets and questionable disclosure practices. Rather than remove these firms from my sample, which creates its own biases, I will keep them in my sample and deal with the consequences when I compute my statistics.
While this is a comprehensive sample, it is still biased because it includes just publicly listed companies. There are tens of thousands of private businesses that are part of the competitive landscape that are not included here, and the reason is pragmatic: most of these companies are not required to make public disclosures and there are few reliable databases that include data on these firms.
The Industry Groupings: While I do have a (very large) spreadsheet that has the data at the company level, I am afraid that my raw data providers do not allow me to share that data, even though it is entirely comprised of numbers that I estimate. I consolidate that data into 94 industry groupings, which are loosely based on the industry groupings I created from Value Line in the 1990s when I first started creating my datasets. To see my industry grouping and what companies fall into each one, try this dataset. As you look at individual companies, there are two challenges that I face. First, there are companies that are in many businesses and I classify these companies into the industry groups from which they derive the most revenues. Second, some companies are shape shifters when it comes to industry grouping, and it is unclear which grouping they belong to; for a few high profile examples, consider Apple and Amazon. There is little that I can do about either problem, but consider yourselves forewarned.
The statistics: My interests lie in corporate finance and valuation and selfishly, I report the statistics that matter to me in that pursuit. Luckily, as I described it in my post a few weeks ago, corporate finance is the ultimate big picture class and the statistics cover the spectrum, and I think the best way to organize them is based upon broad corporate finance principles:
If you are interested, you will find more in-depth descriptions of how I compute the statistics that I report both in the datasets themselves as well as in this glossary. The timing: I use a mix of market and accounting data and that creates a timing problem, since the accounting data is updated at the end of each quarter and the market data is updated continuously. Using the logic that I should be accessing the most updated data for every item, my January 1, 2020, updated has market data (for share prices, interest rates etc) as of December 31, 2019 and the accounting data as of the most recent financial statement (usually September 30, 2019 for most companies). I don't view this an inconsistent but a reflection of the reality that investors face.
C. Archived Data
When I first started compiling my datasets, I did not expect them to be widely used, and certainly did not believe that they would be referenced over time. As I starting getting requests for datasets from earlier years, I decided that it would save both me and you a great deal of time to create an archive of past datasets. As you look at these archives, you will notice that not all datasets go back in time to the 1990s, reflecting first the expansion of my analysis from just US companies to global companies about 15 years ago and second the adding on of variables that I either did not or could not report in earlier years.
The Rationale
If you are wondering why I collect and analyze the data, let me make a confession, at the risk of sounding like a geek. I enjoy working with the data and more importantly, the data analysis is a gift that keeps on giving for the rest of the year, as I value companies and do corporate financial analysis.
It gives me perspective: In a world where we suffer from data overload, the week that I spend looking at the numbers gives me perspective not only on what comprises normal in corporate financial behavior, but also on the differences across sectors and geographies.
Possible, Plausible and Probable: I have long argued that the valuation of a company always starts with a story but that a critical part of the process of converting narrative to value is checking the story for possibility, plausibility and probability. Having the global data aggregated and analyzed can help significantly in making this assessment, since you can see the cross section of revenues and profit margins of companies in the business and see if your assessments are out of line, and if so, whether you have a justification.
Rules of thumb: In spite of all of the data that we now have available, investors and companies seem to still rely on rules of thumb devised in a different time and market. Thus, we are told that companies that trade at less than book value, or six times EBITDA, are cheap, and that the target or right debt ratio for a manufacturing company is 40%. Using the global data, we can back up or dispel these rules of thumb and perhaps replace them with more dynamic and meaningful decision rules.
Fact-based opinions: Many market prognosticators and economists seem to have no qualms about making up stuff about investor and corporate behavior and stating them as facts. Thus, it has become conventional wisdom that US companies are paying less in taxes that companies operating elsewhere in the globe, and that they have borrowed immense amounts of cash over the last decade to buy back stock. Those "facts" are now driving political debate and may well lead to change in policy, but these are more opinions than facts, and the data can be arbiter.
If you are wondering why I am sharing the data, let's get real. Nothing that I am doing is unique, and I have no secret data stashes. In short, anyone with access to data (and there are literally tens of thousands who do) can do the same analysis. I lose nothing by sharing, and I get immense karmic payoffs. So, please use whatever data you want, and in whatever context, and I hope that it saves you time and helps you in your decision making and analysis.
The Caveats
The last decade has seen big data and crowd wisdom sold as the answers to all of our problems, and as I listen to the sales pitches for both, I would offer a few cautionary notes, born out of spending much of my life time working with data:
Data is not objective: The notion that using data makes you objective is nonsense. In fact, the most egregious biases are data-backed, as people with agendas pick and choose the data that confirms their priors. Just as an example, take a look at the data that I have in what US companies paid in taxes in 2019 in this dataset. I have reported a variety of tax rates, not with the intent to confuse, but to note how the numbers change, depending on how you compute them. If you believe, like some do, that US companies are shirking their tax obligations, you can point to average tax rate of 7.32% that I report for all US companies, and note that this is well below the federal corporate tax rate of 21%. However, someone on the other side of this debate can point to the 19.01% average tax rate across only money making companies (since only profits get taxed) as evidence that companies are paying their taxes.
Crowds are not always wise: One of the strongest forces in corporate finance is me-tooism, where companies decide how to invest, how much to borrow and what to pay in dividends by looking at what their peers do. In my datasets, I offer them guidance in this process, by reporting debt ratios and dividend payout ratios for sectors, as well as regional breakdowns. The implicit assumption is that what other companies do, on average, must be sensible, but that assumption is not always true. This warning is particularly relevant when you look at the pricing metrics (PE, EV to EBITDA etc.) that I report, by sector and by region. The market may be right, on average, but it can also over price or under price a sector, at times.
I respect data, but I don't revere it. I don't believe that just having data will give me an advantage over other investors or make me a better investor, but harnessing that data with intuition and logic may give me a leg up (or at least I hope it does).