In my last three posts, I looked at the macro (equity risk premiums, default spreads, risk free rates) and micro (company risk measures) that feed into the expected returns we demand on investments, and argued that these expected returns become hurdle rates for businesses, in the form of costs of equity and capital. Since businesses invest that capital in their operations, generally, and in individual projects (or assets), specifically, the big question is whether they generate enough in profits to meet these hurdle rate requirements. In this post, I start by looking at the end game for businesses, and how that choice plays out in investment rules for these businesses, and then examine how much businesses generated in profits in 2023, scaled to both revenues and invested capital.
The End Game in Business
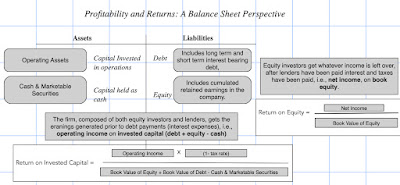
If you start a business, what is your end game? Your answer to that question will determine not just how you approach running the business, but also the details of how you pick investments, choose a financing mix and decide how much to return to shareholders, as dividend or buybacks. While private businesses are often described as profit maximizers, the truth is that if they should be value maximizers. In fact, that objective of value maximization drives every aspect of the business, as can be seen in this big picture perspective in corporate finance:
For some companies, especially mature ones, value and profit maximization may converge, but for most, they will not. Thus, a company with growth potential may be willing to generate less in profits now, or even make losses, to advance its growth prospects. In fact, the biggest critique of the companies that have emerged in this century, many in social media, tech and green energy, is that they have prioritized scaling up and growth so much that they have failed to pay enough attention to their business models and profitability.
For decades, the notion of maximizing value has been central to corporate finance, though there have been disagreements about whether maximizing stock prices would get you the same outcome, since that latter requires assumptions about market efficiency. In the last two decades, though, there are many who have argued that maximizing value and stockholder wealth is far too narrow an objective, for businesses, because it puts shareholders ahead of the other stakeholders in enterprises:
It is the belief that stockholder wealth maximization shortchanges other stakeholders that has given rise to stakeholder wealth maximization, a misguided concept where the end game for businesses is redefined to maximize the interests of all stakeholders. In addition to being impractical, it misses the fact that shareholders are given primacy in businesses because they are the only claim holders that have no contractual claims against the business, accepting residual cash flows, If stakeholder wealth maximization is allowed to play out, it will result in confused corporatism, good for top managers who use stakeholder interests to become accountable to none of the stakeholders:
As you can see, I am not a fan of confused corporatism, arguing that giving a business multiple objectives will mangle decision making, leaving businesses looking like government companies and universities, wasteful entities unsure about their missions. In fact, it is that skepticism that has made me a critic of ESG and sustainability, offshoots of stakeholder wealth maximization, suffering from all of its faults, with greed and messy scoring making them worse.
It may seem odd to you that I am spending so much time defending the centrality of profitability to a business, but it is a sign of how distorted this discussion has become that it is even necessary. In fact, you may find my full-throated defense of generating profits and creating value to be distasteful, but if you are an advocate for the point of view that businesses have broader social purposes, the reality is that for businesses to do good, they have to be financial healthy and profitable. Consequently, you should be just as interested, as I am, in the profitability of companies around the world, albeit for different reasons. My interest is in judging them on their capacity to generate value, and yours would be to see if they are generating enough as surplus so that they can do good for the world.
Profitability: Measures and Scalars
Measuring profitability at a business is messier than you may think, since it is not just enough for a business to make money, but it has to make enough money to justify the capital invested in it. The first step is understanding profitability is recognizing that there are multiple measures of profit, and that each measure they captures a different aspect of a business:
It is worth emphasizing that these profit numbers reflect two influences, both of which can skew the numbers. The first is the explicit role of accountants in measuring profits implies that inconsistent accounting rules will lead to profits being systematically mis-measured, a point I have made in my posts on how R&D is routinely mis-categorized by accountants. The other is the implicit effect of tax laws, since taxes are based upon earnings, creating an incentive to understate earnings or even report losses, on the part of some businesses. That said, global (US) companies collectively generated $5.3 trillion ($1.8 trillion) in net income in 2023, and the pie charts below provide the sector breakdowns for global and US companies:
Notwithstanding their trials and tribulations since 2008, financial service firms (banks, insurance companies, investment banks and brokerage firms) account for the largest slice of the income pie, for both US and global companies, with energy and technology next on the list.
Profit Margins
While aggregate income earned is an important number, it is an inadequate measure of profitability, especially when comparisons across firms, when it is not scaled to something that companies share. As as a first scalar, I look at profits, relative to revenues, which yields margins, with multiple measures, depending upon the profit measure used:
Looking across US and global companies, broken down by sector, I look at profit margins in 2023:
Note that financial service companies are conspicuously absent from the margin list, for a simple reason. Most financial service firms have no revenues, though they have their analogs - loans for banks, insurance premiums for insurance companies etc. Among the sectors, energy stands out, generating the highest margins globally, and the second highest, after technology firms in the United States. Before the sector gets targeted as being excessively profitable, it is also one that is subject to volatility, caused by swings in oil prices; in 2020, the sector was the worst performing on profitability, as oil prices plummeted that year.
Does profitability vary across the globe? To answer that question, I look at differences in margins across sub-regions of the world:
You may be surprised to see Eastern European and Russian companies with the highest margins in the world, but that can be explained by two phenomena. The first is the preponderance of natural resource companies in this region, and energy companies had a profitable year in 2023. The second is that the sanctions imposed after 2021 on doing business in Russia drove foreign competitors out of the market, leaving the market almost entirely to domestic companies. At the other end of the spectrum, Chinese and Southeast Asian companies have the lowest net margins, highlighting the reality that big markets are not always profitable ones.
Finally, there is a relationship between corporate age and profitability, with younger companies often struggling more to deliver profits, with business models still in flux and no economies of scale. In the fact, the pathway of a company through the life cycle can be seen through the lens of profit margins:
Early in the life cycle, the focus will be on gross margins, partly because there are losses on almost every other earnings measure. As companies enter growth, the focus will shift to operating margins, albeit before taxes, as companies still are sheltered from paying taxes by past losses. In maturity, with debt entering the financing mix, net margins become good measures of profitability, and in decline, as earnings decline and capital expenditures ease, EBITDA margins dominate. In the table below, I look at global companies, broken down into decals, based upon corporate age, and compute profit margins across the deciles:
The youngest companies hold their own on gross and EBITDA margins, but they drop off as you move to operating nnd net margins.
In summary, profit margins are a useful measure of profitability, but they vary across sectors for many reasons, and you can have great companies with low margins and below-average companies that have higher margins. Costco has sub-par operating margins, barely hitting 5%, but makes up for it with high sales volume, whereas there are luxury retailers with two or three times higher margins that struggle to create value.
Return on Investment
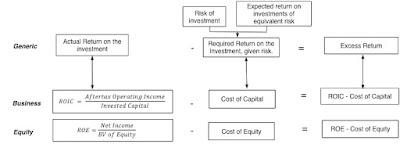
The second scalar for profits is the capital invested in the assets that generate these profits. Here again, there are two paths to measuring returns on investment, and the best way to differentiate them is to think of them in the context of a financial balance sheet:
The accounting return on equity is computed by dividing the net income, the equity investor's income measure, by the book value of equity and the return on invested capital is computed, relative to the book value of invested capital, the cumulative values of book values of equity and debt, with cash netted out. Looking at accounting returns, broken down by sector, for US and global companies, here is what 2023 delivered:
In both the US and globally, technology companies deliver the highest accounting returns, but these returns are skewed by the accounting inconsistencies in capitalizing R&D expenses. While I partially correct for this by capitalizing R&D expenses, it is only a partial correction, and the returns are still overstated. The worst accounting returns are delivered by real estate companies, though they too are skewed by tax considerations, with expensing to reduce taxes paid, rather than getting earnings right.
Excess Returns
In the final assessment, I bring together the costs of equity and capital estimated in the last post and the accounting returns in this one, to answer a critical question that every business faces, i.e,, whether the returns earned on its investment exceed its hurdle rate. As with the measurement of returns, excess returns require consistent comparisons, with accounting returns on equity compared to costs of equity, and returns on capital to costs of capital:
These excess returns are not perfect or precise, by any stretch of the imagination, with mistakes made in assessing risk parameters (betas and ratings) causing errors in the cost of capital and accounting choices and inconsistencies affecting accounting returns. That said, they remain noisy estimates of a company's competitive advantages and moats, with strong moats going with positive excess returns, no moats translating into excess returns close to zero and bad businesses generating negative excess returns.
I start again by looking at the sector breakdown, both US and global, of excess returns in 2023, in the table below:
In computing excess returns, I did add a qualifier, which is that I would do the comparison only among money making companies; after all, money losing companies will have accounting returns that are negative and less than hurdle rates. With each sector, to assess profitability, you have to look at the percentage of companies that make money and then at the percent of these money making firms that earn more than the hurdle rate. With financial service firms, where only the return on equity is meaningful, 57% (64%) of US (global) firms have positive net income, and of these firms, 82% (60%) generated returns on equity that exceeded their cost of equity. In contrast, with health care firms, only 13% (35%) of US (global) firms have positive net income, and about 68% (53%) of these firms earn returns on equity that exceed the cost of equity.
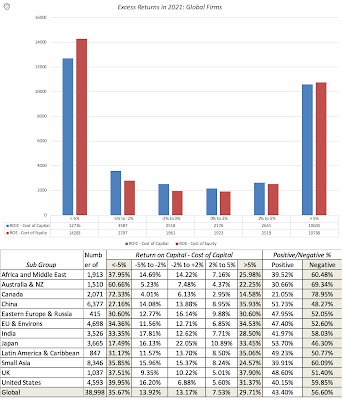
In a final cut, I looked at excess returns by region of the world, again looking at only money-making companies in each region:
To assess the profitability of companies in each region, I again look at t the percent of companies that are money-making, and then at the percent of these money-making companies that generate accounting returns that exceed the cost of capital. To provide an example, 82% of Japanese companies make money, the highest percentage of money-makers in the world, but only 40% of these money-making companies earn returns that exceed the hurdle rate, second only to China on that statistic. The US has the highest percentage (73%) of money-making companies that generate returns on equity that exceed their hurdle rates, but only 37% of US companies have positive net income. Australian and Canadian companies stand out again, in terms of percentages of companies that are money losers, and out of curiosity, I did take a closer look at the individual companies in these markets. It turns out that the money-losing is endemic among smaller publicly traded companies in these markets, with many operating in materials and mining, and the losses reflect both company health and life cycle, as well as the tax code (which allows generous depreciation of assets). In fact, the largest companies in Australia and Canada deliver enough profits to carry the aggregated accounting returns (estimated by dividing the total earnings across all companies by the total invested capital) to respectable levels.
In the most sobering statistic, if you aggregate money-losers with the companies that earn less than their hurdle rates, as you should, there is not a single sector or region of the world, where a majority of firms earn more than their hurdle rates.
In 2023, close to 80% of all firms globally earned returns on capital that lagged their costs of capital. Creating value is clearly far more difficult in practice than on paper or in case studies!
A Wrap!
I started this post by talking about the end game in business, arguing for profitability as a starting point and value as the end goal. The critics of that view, who want to expand the end game to include more stakeholders and a broader mission (ESG, Sustainability) seem to be operating on the presumption that shareholders are getting a much larger slice of the pie than they deserve. That may be true, if you look at the biggest winners in the economy and markets, but in the aggregate, the game of business has only become harder to play over time, as globalization has left companies scrabbling to earn their costs of capital. In fact, a decade of low interest rates and inflation have only made things worse, by making risk capital accessible to young companies, eager to disrupt the status quo.
As I have argued in all four of my posts, so far, about 2022, it was year when we saw a return to normalcy on many fronts, as treasury rates reverted back to pre-2008 levels, and risk capital discovered that risk has a downside. During the course of the year, investors also rediscovered that the essence of business is not growing revenues or adding users, but making profits from that growth. In this post, I will focus on trend lines in profitability at companies in 2022, with the intent of addressing multiple questions. The first is to see how the increase in inflation in 2021 and 2021 has played out in profitability for companies, since inflation can increase profits for some firms, and lower them for others. The second is on whether these profit effects vary across geographies and sectors, by estimating profitability measures across regions and industries. The third is to revisit the link between profitability and value at companies, since making money is a first step for any business to survive, but making enough money to create value in business is a much more stringent test for businesses, and one that many fail.
Profits: Levels and Trends
The end game for any business, no matter how noble its mission and how much good its products and services do, is to make money, since without profits, the business will soon run out of capital and sink into oblivion. That said, if you own the business, you may decide to accept less profits in return for social good, as you pursue your business, but you may not get the same degrees of freedom, if you are a manager at a publicly traded company, since you will now be doing good, with other people's money. Even in these cases, where you constrain your profits for the greater good, you still cannot stay on an endless path of losses. That said, there is surprising confusion about what it means for a company to make money, with different measures of profit used by investors, analysts and companies to bolster their priors about companies. To set the stage, I will start by laying out the differences measure of earnings that reported on an income statement:
At the top of the profit ladder is gross income, the earnings left over after a company has covered the direct cost of producing whatever it sells. Netting out other operating expenses, not directly related to units sold but still an integral part of operating a business (like selling and G&A expenses) yields operating income. Subtracting out interest expenses, and adding interest income and income from non-operating assets results in taxable income or pre-tax profit, and after taxes, you have the proverbial bottom line, the net income.
Not surprising, there is many a cost between the gross and the net versions of earnings, and while there remain a few firms, especially young and start-up, with negative gross income, the likelihood of losses gets progressively greater as you move down the income statement. In the graph below, I look at all publicly traded firms, listed globally at the start of 2023, and at the percent of firms, within each sector, that have positive earnings using gross, pre-tax operating and net income:
Not surprisingly, while more than 85-90% of all firms report positive gross income, that number drops down to just about 60%, with net income. All of the sectors are subject to the same phenomenon, but there are outliers in both directions, with health care have the highest drop off in money makers, as you go from gross to net income, and real estate and utilities having the smallest.
Finally, I look at the aggregated values across all companies on all three income measures, across all global companies, again broken down by sector:
Collectively, global companies reported $16.9 billion in gross profit in the last twelve months leading into 2023, but operating income drops off to $6.4 billion and need income is only $4.3 billion. With financial service firms, where gross and operating income are meaningless, we report only net income, and the sector remains the largest contributor to net income across companies.
Profit Margins
While absolute profits are a useful measure of profitability, you have to scale profits to a common scaling variable, to compare companies of different scale. One common scaling measure is revenues, and that scaling, of course, yields profit margins. The graph below draws a distinction between a medley of margins that are in use:
In addition to scaling gross, operating and net profits to revenues, to get to gross, operating and net margins, I have also added two variants. One is to compute the taxes you would have paid on operating income, if it had been fully taxable, to get after-tax operating income and margin, and the other is to add back depreciation to operating income to get EBITDA and EBITDA margin.
Starting with gross margins, and computing the number for all non-financial service firms, we report the distribution of gross margins across publicly traded companies at the start of 2023, again based upon gross income and sales in the most recent twelve months:
While the median gross margin across all publicly traded global firms is about 30%., there are variations across the globe, with Chinese companies reporting the lowest gross margins and Australian companies having the highest. Some of that variation can be attributed to different mixes of businesses in different regions, since unit economics will result in higher gross margins for technology companies and commodity companies, in years when commodity prices are high, and lower gross margins for heavy manufacturing and retail businesses.
To explore differences in profit margins across industry groups, I broke stocks down into 94 industry groups, and sorted industries, based upon operating margin, from highest to lowest. In the table below, I list the ten industry groups with the lowest margins in the twelve months leading into 2023 and the ten industry groups with the highest:
The money-losers include four industry group from the retail space, a business with a history of low operating margins, a young industry in online software, a couple of industries in long-term trouble in airlines and hotel/gaming. The money makers include a large number of energy groupings, reflecting oil prices being elevated through much of the reporting period (October 2021-September 2022), a few technology groupings (software and semiconductors) and a declining, but high-profit business in tobacco.
Accounting Returns
While profit margins tell a part of the profitability story, a high margin, by itself, may be insufficient to make a judgment on whether a business is a good one, i.e,, a business that consistently generates returns that exceed the cost of funding it. It is to remedy this defect that analysts scale profits to invested capital, with equity and capital variants:
In the equity version, you divide net income by book equity to estimate a return on equity, a measure of what equity investors are generating on the capital they have invested in a company. In the firm version, you divide after-tax operating income, again acting like the entire operating income would have been taxable, by total invested capital, the sum of book equity and book debt, with cash netted out, to obtain return on capital. The latter has several different names (return on capital employed, return on invested capital) with some mild variants on calculation, but all sharing the same end game. Both accounting returns are computed based upon book value, not because we have suddenly developed trust in accounting, but because the objective is to estimate what investors have earned on what they originally invested in a company, rather than an updated or a marked-to market value. I know that ROIC has acquired a loyal, perhaps even fanatical, following among financial analysts, and there are a few like Michael Mauboussin who use it to extract valuable insights about business economics and value creation, but I find that many analysts who use the measure are unaware, or unwilling, to learn about the limits of accounting returns. I have a long and extremely boring paper on the fixes that you need to make to the computation, especially with older companies and companies where accounting is inconsistent in its classification of expenses.
Notwithstanding its many limits, I do think there is value in knowing what return on invested capital a company is generating, and I do compute the return on invested capital for every publicly traded non-financial firm in the world, and the calculation details are below:
The distribution of resulting returns on capital for the 42,000 publicly traded, non-financial firms are shown below:
The after-tax returns on capital, at least in the aggregate, are unimpressive, with the median return on capital of a US (global) firm being 7.44% (5.19%). There are a significant number of outliers in both directions, with about 10% of all firms having returns on capital that exceed 50% and 10% of all firms delivering returns that are worse than -50%.
Excess Returns
If your reaction to the median return on capital being 7.44% for US companies and 5.19% for global companies is that they are making money, you are right, but when you invest capital in risky businesses you need to not just make money, but make enough to cover what you could have earned on investments of equivalent risk. It was in attempting to estimate the latter that I computed the costs of equity in my second post and costs of capital in my third. In fact, comparing the accounting returns from the last section to the costs of equity and capital that we computed earlier allows us to compute excess returns to equity and the firm:
Put simply, value creation comes from delivering returns on equity and capital that are higher than the costs of equity and capital, and while you can take issue with using accounting returns from the most twelve months as a proxy for long term returns, the comparison is still a useful one to make:
As you can see in this table, almost 70% of all listed companies earned accounting returns that were lower than their costs of equity or capital. On a regional basis, US companies have the highest percent of companies that earn more than the cost of capital, but still falling short of 50%, and Canadian companies performed the worst, with more than 80% of companies delivering returns that were lower than the cost of capital.
It is certainly true that while the typical company had trouble making its costs of equity or capital, there are industry groups that generate returns that significantly exceed their costs, just as there are industry groups that operate as drags on the market. I look at the ten industry groups with the most positive and the most negative excess returns in the table below:
The rankings are similar to those that we got with margins, but it is clearly an ESG advocate's nightmare, as the list of companies that deliver the most positive excess returns are a who's who of companies that would be classified as bad, with tobacco, oil and mining dominating the list.
Conclusion
If 2022 was a reminder to investors that the end game for every business is to not just generate profits, but to generate enough profits to cover its opportunity costs, i.e, the returns you can make on investments of equivalent risk, and that game became a lot more difficult to win in 2022. As I noted in my second and third posts, a combination of rising risk free rates and surging risk premiums (equity risk premiums and default spreads) has conspired to push the cost of capital of both US and global companies more than any year in my recorded history (which goes back to 1960). A company generating a 7.44% return on capital (the median value at the start of 2023) in the US, would have comfortably cleared the 5.60% cost of capital that prevailed at the start of 2022, but not the 9.63% cost of capital at the start of 2023. There will be, and has already been, investor remorse about investments taken a year or more ago, but hoping that the cost of capital will come back to 2021 levels is not the solution. While there is little that can be done about past mistakes, we can at least stop adding to those mistakes, and one place to start is by updating hurdle rates, as investors and businesses, to reflect the world we live in, rather than some normalized past version of it.
The proverbial bottom line for success in business is the capacity to deliver profits, at least in the long term. Even though we live in an age where user platforms and hyper revenue growth can drive company valuations, that adage remains true. In fact, questions about profitability seem to have taken center place again, not only because a market pull back is a reminder that growth, by itself, cannot deliver value, but also because there are still unresolved debates about how much damage the COVID crisis did to earnings power at companies, and whether this damage has been healed, as economies have opened up. In this post, I will look at corporate profitability, in all its different dimensions, and how companies across the globe, and across industries, measured up in the most recent years.
Measuring Profitability
The question of whether a company is making or losing money should be a simple one to answer, especially in an age where accounting statements are governed by a myriad of rules, and a legion of number-crunchers follow these rules to report profits generated by a firm. In practice, though, measuring profitability is anything but straightforward, as accountants have devised multiple measures of profitability, reserving discretion on how to compute each one, and many different ways of scaling these profits, for comparisons.
Accounting Profit Measures
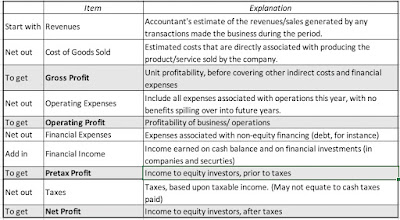
To understand the different measures of accounting profit, let us look at how each measure of profit is computed in an income statement. In the table below, I describe four different measures of earnings in an income statement, from gross profit, the most aggregated profit measure, to net profit, the earnings left for equity investors after taxes:
For non-financial service firms, the gross profit is a measure of what companies earn on the products/services that they sell, net of what it costs them to produce those products/services. Netting out other operating expenses, that are not directly tied to producing the goods and services (such as selling and G&A expenses), from gross profits, yields operating income. Income from financial holdings (including cash balances, investments in financial securities and minority holdings in other businesses) are added back, and interest expenses on debt are subtracted out to get to taxable income. After paying taxes on this income, the residual amount represents net income, the final measure of equity earnings, and the basis for computing earnings per share and other widely used measures of profitability used by equity investors.
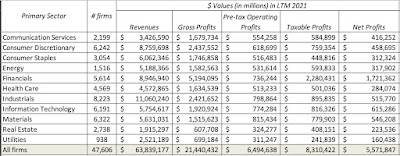
Looking across all publicly traded companies, listed globally, and aggregating revenues on all four measures of earnings (gross, operating, taxable, net), by sector, and aggregating the numbers yields the following:
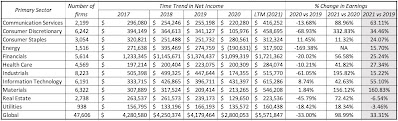
Note that for financial service firms, where debt is raw material (rather than a source of capital) and line between financial and operating assets is difficult to draw, the only measures of income that are relevant are taxable and net income. That said, about 31% of the net profits of all publicly traded firms listed globally in 2021 were generated by financial service firms; that percent is lower in the US and higher in emerging markets. The last few years have been eventful for all companies, with the COVID crisis and ensuing economic shut down causing pain for companies, with recovery coming in 2021, as the global economy opened up again. In the table below, I report the aggregated net income, by sector, from 2017 to 2021 (with the 2021 numbers representing last twelve month numbers, through September 2021):
It is clear that there was substantial damage done to earnings in 2020, across sectors, with energy, consumer discretionary and industrials showing the most negative effects; across all companies, aggregated earnings declined by 15.03% in 2020. In 2021, companies recovered entirely from the damage done in 2021, at least in the aggregate, with earnings in 2021 higher than 2019 earnings, by almost 33%. Real estate and utilities are the two sectors that have not come back fully from the COVID effect, but materials, technology and communication services are now reporting significantly higher earnings that before the shut down.
Profit Margins
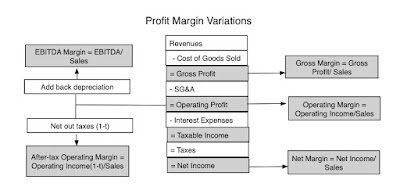
Comparing absolute profits across companies and across time can be difficult, since larger firms will generate more profits than smaller ones, all else held equal. To make comparisons, profits are scaled to common metrics, with revenues and book value of investment being the most common scalar. When profits are scaled to revenues, you get margins, and as with absolute earnings, margins come in various forms, as can be seen below:
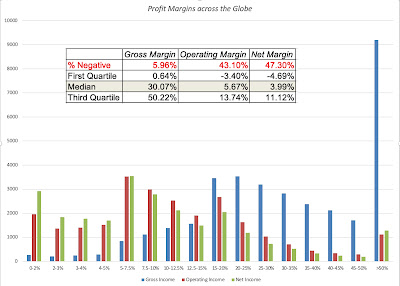
In addition to margins based upon income measures (gross, operating, after-tax operating and net), there are other margin variations, with EBITDA and after-tax operating margins coming into play. To get a sense of variation in margins across companies globally, we looked at the distribution of gross, operating and net margins in 2021:
Earnings from LTM 2021, divided by revenues generated during that period
In computing operating margins, I capitalized R&D for all companies, because R&D is a capital expense, rather than an operating expense, and extended the capitalization of operating leases to all global companies. (IFRS and GAAP now treat as leases as debt, but that is still not the case in many other markets that are not covered by either standard). The numbers yield interesting insights.
First, note that while less than 6% of the 47,606 firms in the sample have negative gross margins, the number is significantly higher for operating margins (43.1%) and net margins (47.3%).
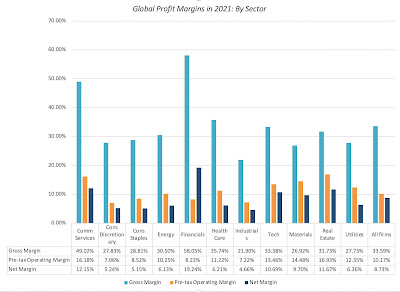
Second, while it is no surprise that gross margins are significantly higher than operating and net margins, the magnitude of the difference is striking; the median gross margin across all global companies in 2021 is 30.07%, but it melts down to a median operating margin of 5.67% and a median net margins of less than 4%. These margins vary widely across companies, and in the table below, we report on the statistics across sectors:
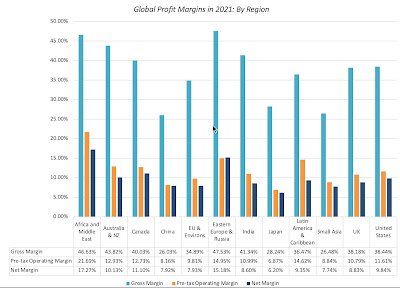
These sectors obviously are broad and each covers a range of industries. If you are interested in industry-level margins, you can find them at this link. In the graph below, I look at differences in margins across geographical regions:
Eastern Europe (including Russia) and Africa contain some risky markets, but firms in those regions have the highest profit margins in the world. One reason is that domestic players in these markets face less foreign competition that companies in the rest of the world. The lowest profit margins in the world are in Asia, with gross margins less than 30% in China, Japan and South East Asia, but India remains an outlier, delivering higher margins. As companies from around the globe look to Asia for growth, the ensuing competition is pushing margins down there, relative to the rest of the world.
Returns on Invested Capital (or Equity)
Scaling profits to capital invested in a company provides a different pathway to measuring profitability, with more consequential effects on value. This scaling can either be done from the perspective of just the equity investors in the company, with a return on equity, or from the perspective of all capital providers (debt and equity), with a return on invested capital:
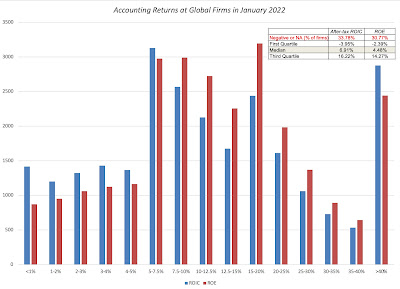
These measures are dependent on accounting estimates of not only earnings, but investment in the firm, in the form of book values of equity and invested capital, and that is their biggest weakness. To the extent that accountants mis-categorize expenses like leases and R&D, returns can be skewed, as can restructuring and one-time charges. With those caveats in place, and with my adjustments to earnings for R&D and lease capitalization, I computed the returns on equity and invested capital for all publicly traded firms at the start of 2022, using earnings in the last twelve months in the numerator and invested capital at the start of those twelve months in the denominator:
As with margins, almost a third of all firms have negative or missing accounting returns and the median return on equity, in US dollar terms, across all global firms is 4.48%, and the median return on invested capital, in US dollar terms, across firms is 6.91%. In my last post, I noted the decline in costs of capital for firms over time, noting that the median cost of capital at the start of 2022 is only 6.33%, across global firms, and argued that companies that demand double-digit hurdle rates risk being shut out of investments. That point is amplified by the accounting returns computations, since it looks like the actual returns earned by firms on their investments don't meet their own expectations.
Implications
It is true that profitability measures, standing alone, give you only a snapshot of a company, in time, but used in context, they are conduits for almost every qualitative factor in investing, and put in a framework, a way of thinking of the value of growth and competitive landscapes.
Business Buzz Words
Buzzwords and catchy phrases has long been part of business, with consultants and experts offering them as recipes for corporate turnarounds, and companies using them to justify everything from acquisitions to significant business course changes. While their allure is understandable, their casual usage can lead to money ill-spent and catastrophic mistakes, and I have long argued that the best way to bring discipline to decision making is to convert these buzzwords into numbers that drive value. Put simply, every action, no matter how consequential it is framed as being, can affect value in one of three ways: by changing the growth trajectory for revenues, by altering the profitability of the business model or by modifying the risk in the business. Just to illustrate, I have a looked at some of widely used buzzwords with a link to profitability:
Buzzword
Profitability Effect
Reasoning
Powerful Brand Name
Higher operating profit margins, relative to peer group
Brand name allows you to charge higher price for the same products.
Economies of scale
Operating margin improves as revenues increase
Costs grow at a slower rate than revenues
Superior unit economics
High gross margins
Extra unit costs little to produce, relative to price.
Strong competitive advantages
High return on capital, relative to peer group
Barriers to entry earn and sustain high returns
Canny borrower
High return on equity, relative to return on capital
Benefits from difference between return on capital and after-tax cost of debt.
Tax player
After-tax operating income is close to pre-tax operating income
Lower effective tax rate, across all income.
Note that I have steered away from the fuzzier phrases, such a "great management", which could mean everything or nothing, or "ESG", where goodness is not only in the eye of the beholder, but finding a link to anything that drives value resembles a wild goose chase.
A Life Cycle View
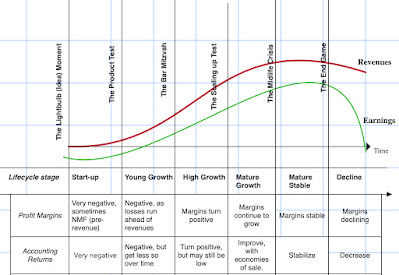
If you have been reading my posts for a while, you know that I find the corporate life cycle a useful device in explaining everything from what companies should focus on, in corporate finance, to the balance between stories and numbers, when investor value companies. Profit margins and returns also follow the life cycle, albeit with wide differences across firms:
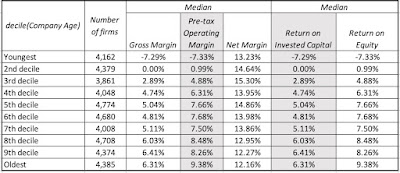
As you can see, young companies tend to be money-losers, and margins improve as companies make it through to maturity, before dropping as companies decline. Accounting returns follow a similar path, though they tend to peak a little later in the cycle, before declining in the last stages of the life cycle again. I am aware that there are many who disagree with my life cycle view of companies, but one way of testing whether it is a reasonable approximation of the real world is to look at the data. In the table below, I report on profit margins and accounting returns for firms, broken down by corporate age (measured from the founding year to 2021), across global companies at the start of 2022:
Corporate Age = Years since founding
It is just one table, but the patterns of margins/returns matches a life cycle view, low for young companies, rising as companies mature, before declining as companies age.
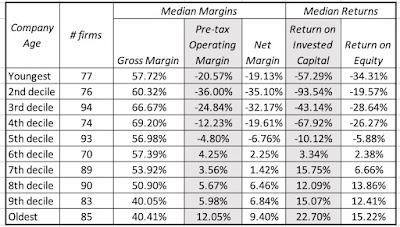
The largest sector, in the US, in terms of market capitalization, is information technology and I have argued that tech companies age in "dog years", with compressed life cycles. The tech sector in the United States is composed of some companies like Apple, Microsoft, HP and Intel, which are ancient by tech company standards, and other companies like Uber, Palantir and Zoom, young and money-losing, that have gone public just in the last few years. In the table below, I break down US tech companies into age cohorts, based upon corporate age (measured from founding year), and looking at profitability measures across these cohorts, in the table below:
All companies in S&P technology sector
This table illustrates the dangers of lumping all tech companies together as high growth or money losing, since older tech companies have become the profit engines in this market, delivering a combination of high margins and accounting returns that the stars of the twentieth century, mostly manufacturing and service businesses, would have envied. It also illustrates why some value investors who have an aversion to all tech companies, often for the most meaningless of reasons (such as not having a tangible book value), have lagged the market for close to two decades.
The Value of Growth
As investor tastes have shifted from earnings power to growth, there has been a tendency to put growth on a pedestal, and view it as an unalloyed good, but it is not. In fact, growth requires trade offs, where a company invests more back into itself in the near term, denying payouts (dividends or buybacks) to its investors, during that period, for higher earnings in the future. Not surprisingly, then, the net effect of growth will depend on how much is reinvested back, relative to what the company can harvest as future growth. While a full assessment of this value will require making explicit assumptions about growth and reinvestment, there is a short hand that is useful in making this assessment, and that is a comparison of the returns that a company makes on its investments to the cost of funding those investments. If you use accounting returns as a proxy for project returns, and the costs of equity and capital as measures of the costs of funding, you can compute excess returns to equity investors, by comparing return on equity to the cost of equity, and excess returns to all capital providers, by netting cost of capital from return on invested capital:
Using the accounting returns and costs of equity/capital that I computed for all publicly traded firms at the start of 2022, I looked at the distribution of excess return measures across companies in the graph below:
Close to 57% of firms globally earn returns lower than their funding costs, and while this may be temporary for some, it has become a permanent feature for many businesses. If you believe that the poor returns that you see in this table are a residue of COVID and economic short downs, I would suggest that you look at data that I have, on excess returns, going back almost a decade, and you will see similar results in the pre-COVID years. I will use this data to draw three broad conclusions:
Low Hurdle Rate ≠ Positive Excess Returns: The notion that lower interest rates, and the resulting lower hurdle rates that companies face, has been a boon for business is clearly not supported by the facts. If anything, as rates have decreased over the last decade, and costs of capital for companies hit historic lows, companies are finding it more difficult to earn returns that exceed their costs of capital.
Good and Bad Businesses: It is an undeniable truth that some businesses are easier to generate value in, than others, and that a bad business is one where most of the companies operating in it, no matter how well managed, have trouble earning their costs of capital. Using the excess returns estimated from 2021, I estimated the excess returns (ROIC - Cost of capital) in 94 industry groups, and the ten "best" and "worst" industries, in terms of median excess return, are listed below:
If you look at the worst businesses, there are a couple that show up every year, like airlines and hotel/gaming, where COVID exacerbated problems that are long term and structural. The airline and hotel businesses are broken, and have been for a long time, and there is no easy fix in sight. Biotechnology companies can claim, with some justification, that their presence on the bad business list reflects the fact that many in the sector are young companies that are a breakthrough away from being blockbuster winners and that they will resemble the pharmaceutical business (which does earn positive excess returns), in maturity. I am sure that there will be ESG advocates who will claim credit for fossil fuel and mining businesses that show up in the worst business list, but not only will their rankings change quickly if oil and commodity prices rises, but the best business of all, in 2021, in terms of delivering excess returns, is the tobacco business, not a paragon of virtue. While the technology boom has created winners in information and computer services, building-related businesses (from materials to furnishings to retail) and chemical companies also seem to have found ways to deliver returns that exceed their costs.
Disruption's Dark Side: Among the bad businesses, note the presence of entertainment, a historically good business that has seen its business model disrupted, by new entrants into the business. Netflix, in particular, has upended how entertainment gets made, distributed and consumed, and in the process, drained value from established players. While this is a phenomenon that has played out in business after business, over the last two decades, there are a couple of common themes that have emerged in the excess return data. Disruption, almost invariably, leads to lower returns for the status quo, i.e., the disrupted companies in the business, but disruptors often don't end up as beneficiaries. Consider the car business, where ride sharing has destroyed cab and traditional car service businesses, but Uber, Lyft, Didi, Grab and Ola all continue to lose money. Put bluntly, disruption is easy, but making money on disruption is difficult, and disruption creates lots of losers, but does not necessarily replace them with winners.
If I were to sum up my findings, it would be to conclude that generating value from running a business has become more difficult, not less, in the last two decades and that while there are companies that seem to have found pathways to sustainable, high earnings, most companies are involved in trench warfare, fighting disruptors and facing significantly more macro economic risk in their operations.
In an age, where scaling up and growth seems to have won out over building business models and profitability, as the most desirable business traits, it is worth stating the obvious. The measure of a good business is its capacity to generate not just profits, but also to convert these profits into cash flows that investors can collect. If we needed a reminder of this age-old premise, the last three weeks should have provided a wake-up call. In fact, if your central concern is about the negative economic consequences of the viral meltdown, in the short and the long term, higher growth and margin companies will be best suited to not just survive them, but emerge stronger in the post-virus economy. In this post, I will try to look at growth, earnings and cash flows, and how they interact in value, and use that framework to examine how companies around the world, in different sectors, measure up.
Growth, Profits and Cash Flows
The trickiest part of valuation is negotiating a balance between growth, profitability and reinvestment, with a plausible story holding them together, to derive value.
The Scaling Factor: Growth plays the 'good guy' role, allowing small companies to become big, and big firms to become even bigger. While a growth rate can be computed on any metric, the metric that best reflects operating growth is revenue growth, accomplished by either selling more units or raising prices.
The Profitability Driver: Growth, by itself, can only scale up a firm's operations and revenues, but for that scaling up to pay off, it has to become profitable. Again, while there are many measures of profitability, scaling profits to revenues to arrive at profit margins makes the most sense.
The Reinvestment Lever: To grow, a company has to reinvest in capacity, in whatever form, and this reinvestment can drain cash flows. This reinvestment can be tied to earnings, as a retention ratio or a reinvestment rate, or to sales, as a sales to invested capital ratio.
If that sounds familiar, it is perhaps because you have seen me value many companies on this blog, using these three variables, added on to a risk component, to value companies as diverse as Kraft Heinz to Tesla to Beyond Meat. In fact, the cash flows that you observe for a firm can be captured by the interactions between these three forces, and those interactions let us differentiate between great, average and bad firms:
The extremes represent the best and worst possible combinations of these variables. Great firms pull off the trifecta, scaling up revenues with relatively little reinvestment, while deliver high margins. Terrible firms are saddled with the worst possible mix of low revenue growth, low or even negative margins and large capital investment requirements to deliver even their growth. The bulk of the business world falls in the middle, facing tradeoffs that determine value. Some trade off low margins for high growth, hoping that the dollar profits they deliver will be large enough, simply because of scale. Others are willing to reinvest more in the short term, to build barriers to entry and generate higher and more sustainable margins and returns for the long term. In the rest of this post, I plan to look at how companies around the world measure up on each of these dimensions, beginning with the growth that they have recorded in the recent past, moving on to measures of profitability and ending with reinvestment numbers. I will then close by bringing in the hurdle rates that I estimated in my last post as benchmarks, to measure how firms measure up on value creation or destruction.
Growth
The first variable that I will look at is growth, and focus primarily on past growth in different metrics, ranging from revenues (the top line) to net income (the bottom line). Along the way, I will argue that the way growth rates are estimated and the periods used for the estimation can have large effects on the numbers that emerge, and that bias, as with everything else in valuation, can affect choices.
Growth Metrics
Investors often make the mistake of assuming that, since the past is behind the, a historical growth rate for a company is a fact, not an estimate. That is a myth, since the historical growth rate that is reported for a company is a function of multiple choices made on estimation, as can be seen in the picture below:
So what? First, it is worth remembering that that the biases an investor brings to the table will often determine how, and in what metric, growth is computed. In general, at least in good times, earnings per share growth will be the mantra of bullish investors in a stock, whereas top line growth will the number offered by more pessimistic about the stock. Second, if you are using growth rates for companies from a data service, it is always worth asking questions about the approach used to compute growth (arithmetic or compounded) and time period used (starting and ending years), since they can skew growth rates up or down.
Growth Rates - A Global Overview
In keeping with the theme that with growth rates, it behooves us to be transparent about estimation choices, I will start by explaining my choices when it comes to growth. For historical growth rates, computed at the start of 2020, I use the compounded average growth rate in the previous five financial years. For most firms in my sample, this is the geometric average growth rate from 2014, as the base year, to 2019, as the final year in the sample. I will also compute growth rates in revenues (top line) and net income (the proverbial bottom line). With the latter, there will no growth rates computed for companies that are money losing, since the growth rate becomes a meaningless number. With that lead-in, I start by estimating growth rates by industry group, and in the table below, I list the ten industries with the highest growth rate in revenues in the last 5 years (2014-19) and the ten with the lowest:
Note that even before the crisis, oil companies were shrinking, computers/peripherals had close to flat sales, and software dominates the list of high growth businesses. For a full list of growth rates, by industry, please click here. To see if there are differences in growth in different parts of the world, I then break down growth rates in revenues and net income, by region, between 2014 and 2019.
Note that more than a quarter of all publicly traded firms saw revenues shrink, in US dollar terms, over the last five years, and that across all firms, the median growth rate in net income is much higher than the median growth rate in revenues, across all regions. However, the range on net income growth is wider than the range on revenue growth. Finally, it is worth noting that investing is based upon future growth, not past growth, and I use estimates of expected growth rate in earnings per share as my proxy. Notwithstanding the biases that analysts bring into this estimation process, it remains a forward-looking number, and I look at how expected growth in earnings per share varies across companies in different PE ratio classes:
While this data is too raw to draw big conclusions from, higher PE stocks have, not surprisingly, have higher expected growth rates than low PE stocks. As investors, though, that tells you little about whether high PE stocks are good, bad or neutral investments, since the enduring question becomes whether (a) the high expected growth reflects reality or hopeful thinking on the part of analysts and (b) the PE ratio fully, under or over reflects this expected growth rate. It is one reason that I remain wary of using pricing screens to pick stocks, since there is no short cut or formula, that will answer this question. That will require a deep dive into the company's business model and full forecasting of earnings, cash flows and risk, i.e., an intrinsic valuation.
Profitability
Growth is only one part of the valuation puzzle, since without profits that come with it, it will be wasted. In this section, I will look at profitability across regions, sectors and subsets of stocks, again with the intent of eking out lessons that I can to in corporate finance, investing and valuation.
Margin Definitions & Usage
With profit margins, you scale profits to revenues, and as with growth, there are multiple metrics that can be used to compute margins, and which one is used is often a reflection of the biases that investors bring to the game. In the picture below, I look at a list of possible profit margins, and what each one is trying to measure:
By itself, each margin serves a purpose and tells a tale, and is worth calculating. Thus, the contribution margin measures the pure profits that you generate with every marginal unit you sell, since it nets out only the variable cost associated with producing that unit, giving many software companies close to 100% contribution margins. Gross margins are a close relative, providing a direct measure of marginal profitability and an indirect measure of how revenue increases flow into profits. To illustrate, Zoom, one of the few stocks that has seen its value increase during the crisis, reported a gross margin of 92% in 2019. Operating margins measure what is left after the other operating expenses of the company, which cannot be directly traced to individual unit sales, but are nevertheless necessary for its operations. Thus, R&D expenses and SG&A costs are netted out from gross profit to get to operating profit, yielding a measure that will capture economies of scale, as the company scales up. Netting out taxes and interest expenses, and adding back income from cash and cross holdings, yields net margin, a measure of what equity investors get to keep out of every dollar of revenues. It is a mixed and noisy measure, reflecting a company's operating model, its tax liabilities and its financial leverage (since debt creates interest expenses and affects taxes), as well as non-operating assets. Along the way, there are diversions. If you take the operating income, act like you have no debt and net the taxes you would have paid on that operating income, you get after-tax operating margin, a measure of operating profitability that takes into account taxes. If you take operating income, and add back depreciation and amortization, you get EBITDA margin, a measure of operating cash flows, before reinvestment. In recent year, companies with large stock based employee compensation have taken the tack that since it is in the form of shares or options, it is not an expense, and have added back this and other "extraordinary" expenses (with lots of leeway on what comprises extraordinary) to compute adjusted EBITDA margins that supposedly capture even better the cash flows at the firm.
As you look at margins, whether reported by a company or computed by a third party (including me), here are some general principles to keep in mind. First, desperation drives a money-losing company up the income statement to use more expansive forms of margin. Notice that Microsoft, which has operating margins of close to 35% and net margins of 20% plus, never talks about gross margins, whereas some of Tesla's biggest promoters keep bring up the fact that its gross margin is 25%. Boasting that your gross margin is positive is akin to being on a diet and claiming that you consume only 1800 calories a day, but that is before you count the calories in the second courses at meals, desserts and snacks. Second, not all adjustments are created equal. I have long argued that while adding back depreciation and amortization to get to an EBITDA margin may be justifiable, adding back stock based compensation is not, since it is effectively using a barter system to evade cash flows. Put differently, you could have issued those restricted shares or options in the market, and used the cash to pay your employees, and chose not to.
Margins: A Global Overview
As with growth rates, I am going to begin by offering some background on the data that I use to compute my margins, and the adjustments that I make along the way. I use the revenues and income numbers from the trailing 12 months, which at the start of 2020, would give me the financials for most firms from October 2018 to September 2019. While that may seem short sighted, I have the archived numbers from the last decade on my website, for you to download and make your own judgments. Of course, with the market crisis fully upon us and a recession looming, you will be well served looking at the historical data. I start looking at margins across industries, to get a rough measure of how revenues flow through as earnings to the firm and its equity investors. In the table below, I list the ten industry groups with the highest and lowest operating margins, using global companies:
Note that retail is particularly exposed in this crisis, simply because margins were low to begin with, though the question of how much will vary across retail. Thus, grocery and online retail may be more resilient than automotive and general retail from a prolonged shut down of commerce. Among the highest margin businesses, there are many that will see margins deteriorate very quickly from this crisis, with energy (both oil and green) showing the biggest near term hits. Real estate will also be exposed if there is a deep recession, but software, beverages and tobacco should see profitability hold up better. Looking across regions, I compute profitability measures across all companies in each region, recognizing that the industries that dominate each region be very different.
Note that the Asia had the lowest margins in 2019, a warning that high growth does not always translate into profitability. Conversely, Eastern European & Russian companies have high margins, albeit with low growth. African and Middle Eastern companies have sky high margins, reflecting domestic companies that dominate local markets with little competition.
Reinvestment Efficiency
If revenue growth captures the scaling up factor, and margins the profitability of a business, the last part of the story has to be about the efficiency with which the growth is delivered. For manufacturing companies, this will be captured in how much they spend in adding production capacity, and how efficiently they use this added capacity to produce more units. For non-manufacturing companies, the investment may be in research and development, acquisitions and other "intangibles", but it too is reinvestment and its payoff in growth affects value. For retail firms, it may take the form of inventory, accounts receivable and other ingredients of working capital, and how well they can manage these as they grow.
Reinvestment Efficiency: Definitions & Usage
Unlike revenue growth and margins, which has widely accepted proxies and measures, reinvestment efficiency remains more of a smorgasbord of different measures. Broadly speaking, these measures scale how much capital is invested either to the operating income that is created, in returns on capital measures, or to revenues, by relating capital invested to revenue growth.
In sum, reinvestment in any period is defined broadly to include not just investments in plant and capacity, the accountant's traditional cap ex measure, but also working capital, acquisitions and investments in research and development and intangible assets.
Reinvestment = (Cap Ex - Depreciation & Amortization) + Change in non-cash Working Capital + Acquisitions + (R&D expenses - Amortization of R&D)
That reinvestment accumulated over time comprises the invested capital of the firm, and both numbers (reinvestment and invested capital) can be scaled to either after-tax operating income or to revenues. When margins are stable, the two approaches are equivalent, but when the margins are changing, the revenue-scaled measures become more useful.
Reinvestment Measures: A Global Overview
I noted at the start of this post that "ease of scaling up" has become a central theme of young growth companies reaching into new and often very large markets. While this has always been a selling point for conventional software and technology firms, it has expanded its reach into other businesses, from Uber in car service/logistics to Casper in mattress sales. In essence, the selling point for these models is that they can reinvest much more efficiently than their established competitors, though their growth pitch is still more focused on sales than on profits. In this section, I report on investment efficiency numbers, staying true to my premise that reinvestment has to include acquisitions and R&D. To get a sense of how investment efficiency varies across industries, I computed sales to invested capital and returns on capital, across industry groups, and in the table below, I report on the ten most and ten least efficient industries, at least when it comes to delivering revenues for every dollar of capital invested.
Note that the concentration of natural resource companies in Australia, New Zealand and Canada, which lowered profitability, is also showing up as lower returns on capital. The more troubling number is the 4.55% median return on capital delivered by the median global company in 2019, not only well below the cost of capital globally, but also likely to see a major hit this year, as the Corona Virus works through the global economy.
Excess Returns
I talked about risk and hurdle rates in my four earlier data posts, where I started with the price of risk in markets (equity risk premiums and default spreads) and then about relative risk measures. In this last section, I will bring together the return measures discussed in the last section with the hurdle rates estimated in prior posts to create composite measures of excess returns, as measures of value creation.
Excess Returns Definitions and Usage
While businesses that make money are viewed as successful, that is a low hurdle for success. After all, capital is invested in businesses and that capital invested elsewhere, in equivalent risk investments, could have earned a return. That return is what we were trying to estimate, with all of its complications, in my previous updates on risk free rates, equity risk premiums and relative risk measures.
These comparisons, which are at first sight simple, are complicated by how well we can measure how much capital is invested in a project or existing assets and how closely the accounting earnings capture true earnings. Adding to the measurement issues is the fact that earnings are volatile and using a single year's number can skew our conclusions.
Excess Returns: A Global Overview
With the caveat in mind that the returns on capital that I compute for individual companies reflects operating income in 2019, a potential problem given that it is just one year and a number that clearly will change (and fairly dramatically so) because of the virus, I compared the return on capital to the cost of capital for each of the 39,000 non-financial service companies in my sample and used that comparison to create a global distribution of excess returns:
The story here is a depressing one, at least for this comparison, as 54% of global companies generated returns on capital that were lower than their costs of capital by 2% or more, and 32% of global companies earned returns that exceeded their costs of capital by 2% or more; 14% of companies earned returns that were within 2% of their costs of capital. The only part of the world where more companies earned more than their cost of capital than earned less was Japan, and even there, there are questions about whether this is an artifact of Japanese accounting practices rather than a sign of value creation. To complete the assessment, I looked at excess returns generated, by industry, and created a listing of the five industry groups with the most positive and the five with most negative median excess returns:
You may be surprised to see biotechnology and healthcare IT at the top of the list of negative excess return businesses, but given that many of the companies in these industries are still young, money-losing firms with promising products in the pipeline, this may be more a reflection of the limitations of using return on capital with young companies, than a true measure of excess returns. The presence of mining and oil/gas on the list is more troubling, since it suggests that even before the brutal shocks meted out in markets in the last few weeks, these sectors were struggling. It should be no surprise that the businesses that have the highest excess returns are mostly service companies, with low capital intensity, with the exception of tobacco, a high-margin business that also has the benefit of providing a non-discretionary product.
Wrapping up
Heading into a post-virus economy, where there will be wrenching changes in most sectors, you may wonder why I even bother looking at the profitability and excess returns from 2019. After all, every one of the numbers reported in this post will be dated, as companies update their financials to reflect the damage done. That said, I think it still makes sense to look at growth, profitability and reinvesting, pre-crisis, to get a sense of how much punishment companies can take. In businesses that already had anemic revenue growth, low margins and poor investment efficiency, the effects of the crisis will be far more devastating than in businesses with higher growth, margins and efficient investment. There is a reason why airlines, retail and oil are in the front lines of this war, suffering the most casualties, and why technology and heath care are doing better.