Tuesday, October 25, 2022

Earnings and Cash Flows: A Primer on Free Cash Flow

It is never pleasant to be in the midst of a market correction, but a market correction does operate as a cleanser for excesses that enter into even the most disciplined investors' playbooks in the good times. This correction has been no exception, as the threat of losing investment capital has focused the minds of investors, and led many to reexamine practices adopted during the last decade. In particular, there has been more talk of earnings than of revenue or user growth this year, and the notion of cashflows driving value seems to be back in vogue. As someone who believes that intrinsic value comes from expected cash flows, I find that development welcome, but I do find myself doing double takes when I see concoctions of free cash flow that violate first financial principles. While I understand that there is no one overriding definition of cash flow that trumps others, it is essential that we define what we mean when we talk about free cash flows, and get perspective on what companies look like, on these cash flow measures.

Free Cash Flows: The What and The Why!

    Free cash flow is one of the most dangerous terms in finance, and I am astonished by how it can be bent to mean whatever investors or managers want it to, and used to advance their sales pitches. I have seen analysts and managers argue that adding back depreciation to earnings gives you free cash flow, an intermediate stop, at best, if you truly are intent on computing free cash flow. In the last two decades, I have seen free cash flow measures stretched to cover adjusted EBITDA, where stock-based compensation is added back to EBITDA, and with WeWork, to community-adjusted EBITDA, where almost all expenses get added back to get to the adjusted value.  I will use this section to clarify what free cash flows are trying to measure, how they get used in investing and valuation, and the measurement questions that can cause measurement divergences.

What is Free cash flow (FCF)?

    I believe that any measurement of free cash flow has to begin with a definition of to whom those cash flows accrue. Since a business can raise capital from owners (equity) and lenders (debt), the free cash flows that you compute can be to just the equity investors in the business, in which case it is free cash flow to equity, or to all capital providers in the business, as free cash flow to the firm.    

In short, the free cash flow to equity is the cash flow that a business generates after taxes, reinvestment and debt payments (interest and principal). The free cash flow to the firm is a pre-debt cash flow, before interest payments and debt repayments or issuances, but still after taxes and reinvestment. An alternate way of describing free cash flow to the firm is that it measures the cash flows that would have been available for equity investors, if there were no debt in the firm, and it is for this reason that some call it an unlevered cash flow.

To measure free cash flows for equity, you have to define reinvestment and debt cash flows, and we do that below on the left.  Note that we start with net income, earnings that is already after interest expenses and taxes, and that we consider reinvestment in both short term assets (change in non-cash working capital) as well in long term assets (as the difference between capital expenditures and depreciation). To complete the calculation, we incorporate the cash inflows that equity investors receive when they issue new debt and the cash outflows from repaying debt

Since FCFF is a pre-debt cashflow, starting with net income which is after interest expenses would be inconsistent. Thus, we start with operating income or earnings before interest and taxes (EBIT) replacing net income. (I know that you can start with net income and add back after-tax interest expenses, but it leaves embedded other items that can create distortions in FCFF). The taxes that are netted out from operating income are not actual taxes paid (accrued or cash) but hypothetical taxes, on the assumption that all of operating income would be taxed, in the absence of interest expenses (since you are working as if you have no debt), but the reinvestment in long term and short term assets is identical to the calculation used for FCFE. 

Estimation of FCFE

    If you have to compute the FCFE for a firm, you can see that every item that you need for the calculation should be accessible in its statement of cash flows, and there seems to be little room for disagreement. However, you will wrestle with what items to include and which ones to exclude, when computing the FCFE for a firm. To illustrate, we have used the statement of cash flows for Microsoft for the 2021 fiscal year (from July 2020- June 2021) as the basis for computing its FCFE in the figure below:

Source: Microsoft Annual Report for FY 2021 (Year ended June 2021)

To estimate the FCFE, I start with net income and add back depreciation & amortization and non-cash gains reported during the year. I do not add back stock-based compensation, and will provide a rationale for why in the next section, but I do subtract out the changes in non-cash working capital (provided in broken down form in the cash flow statement, but consolidated in my FCFE calculation). I net out capital expenditures and cash acquisitions, as reported, to get to FCFE prior to debt of $41,901 million. Since Microsoft did not raise any new debt, while repaying $5,504 million in existing debt, the FCFE after debt cash flows is $36,397 million. Another way of presenting this FCFE is to consolidate the working capital, capital expenditure and depreciation items into a reinvestment number ($19,370 million) and net this reinvestment out of net income to estimate FCFE. Estimating the free cash flow to the firm will require leaving the confines of the statement of cash flows and obtaining two numbers from the income statement - the operating income for the company and its effective tax rate, computed as taxes paid divided by taxable income. For Microsoft, this would yield values of $69,916 million for operating income and an effective tax rate of 13.83% in 2021, resulting in a FCFF of $40,879 million in 2021.
As you can see, the FCFE and FCFF share a common foundation, insofar that they are both after taxes and reinvestment, but FCFE adds a layer of cash flows to and from debt that can sometimes make it higher than FCFF and sometimes lower.

Using Free Cash Flows

   While there are facile reasons that you can give for computing free cash flows, including the usual “we don’t trust accounting earnings” and  “cash is king”, calculating it does involve added computations and there are three contexts where free cash flows get used. The first is that is that computing free cash flows for a past period helps in explaining what happened at a business during that period, in operating, investing and financing terms. The second is that it is that the free cash flows that you compute for a past period can be used as the basis for forecasting expected free cash flows in the future, a key ingredient if you are doing intrinsic valuation. The third is to compute the free cash flow as a base to be used to compare pricing across companies, where the market price is scaled to free cash flow, rather than to earnings. Since each of these missions has a different end game, there can be consequences for how we estimate free cash flows in each one; put simply, the free cash flow you compute, if you just want to explain what a firm did last year, can be different from the free cash flow you compute as the base year number for intrinsic valuation, which, in turn, can be different from the free cash flow that you estimate, if you are computing a pricing multiple.

1. Explain the past

    It is true that when investing in a company, it is what happens in the future that will determine whether you make money, but it is also true that to make these future assessments, a good place to start is by understanding what that company has done in the past. Notwithstanding the mission bloat that has bedeviled accounting in the last few decades, where the notion of fair value has distracted accountants, explaining what a company has done in the past, and where it stands now remains the core mission that should animate financial statements. As a believer in cash flows, I have always gravitated to the statement of cash flows as the accounting disclosure that is least contaminated by accounting overreach and the one that best reflects the true operations of a business. 

Note that the statement of cash flows looks at cash flows through the eyes of equity investors, starting as it does with net income and working its way down through investing and financing cash flows, before concluding with an explanation of the change in the company’s cash balance. As you can see in my earlier computation of FCFE for Microsoft, every item that you need for the calculation is in the FCFE, with your key decisions becoming which items not to count (any cash flows to equity, investments in securities etc.) and which ones to include (cash acquisitions, foreign exchange gains or losses etc.)

An intuitive reading of the FCFE is that it is cash available to be returned to equity investors, either in the form of dividends or as cash buybacks. It is the rare firm that follows a residual cash policy, returning its FCFE every year as dividends and/or buybacks. Some firms hold back and return less than they can, for good reasons (buffer against future bad years, set aside to cover investment opportunities) as well as bad ones (managers/insiders control the cash, over priced acquisitions); when they do hold back, the difference adds to their cash balances. Others choose to return more cash than they should be, and funding the difference from cash balances accumulated in the past and in some cases, fresh equity issuances, again for good reasons (a cyclical or commodity company riding out a down phase of a cycle) and for bad ones (inertia, an unwillingness to cut dividends, me-tooism on dividend policy or buybacks).

Companies with negative FCFE start in a hole, and even if they do not return any cash, they will find themselves with declining cash balances and/or new equity issuances, and if they do choose to pay dividends or buy back stock, they will make the cash deficits bigger. This approach of computing FCFE and comparing it actual cash return can be a device that can explain how some companies end up with huge cash balances and why other companies, especially young and money losing, will be dependent on equity infusions to stay alive. 

One of the limitations of focusing of free cash flows to equity is that you can get tunnel vision, since borrowing money operates as a cash inflow, inflating free cash flow to equity. That can explain why a firm with moderate or even below-average profitability can use debt to fund large dividends and buybacks, and to the extent that the firm is borrowing too much, it can dig a hole for itself. Estimating free cash flows to the firm can alert you to this occurrence, since it is a pre-debt cash flow and new debt issuances or repayments cannot alter it. In fact, the free cash flows to the firm, while less intuitive, are the source of cash flows to all claim holders (lenders as well as equity investors):

Mapping out these cash flows can provide a big picture perspective on where a firm’s cash flows are coming from and going, as well as a better assessment of the operating health of its business. It can also provide advance warning of the company’s exposure to downside risk, since the cash flows to lenders (interest and debt payments) are contractually set.

2. Intrinsic Valuation

    In intrinsic value, the value of an asset, business or equity stake in a business is the present value of the expected cash flows on it. Thus, in intrinsic valuation, the free cash flows (to equity or the firm) that you compute for the most recent year or time period is never part of value, but is useful only because it provides a base for forecasting the future. The question of whether you should be estimating free cash flows to equity or to the firm cannot be answered until you decide whether you are valuing just the equity in a business or the entire operating assets of the business.

  • If you are valuing just the equity, you’ll be estimate the free cash flows to equity in future years, and discounting back at the cost of equity, i.e., the rate of return that equity investors can make on other investments in the public market, of equivalent risk.
  • If you are valuing all operating assets in a business, you will estimate free flows the entire firm or business, and discount these cash flows back to today at a weighted average of the costs of equity and debt, with the weights reflecting the proportions of each funding type.
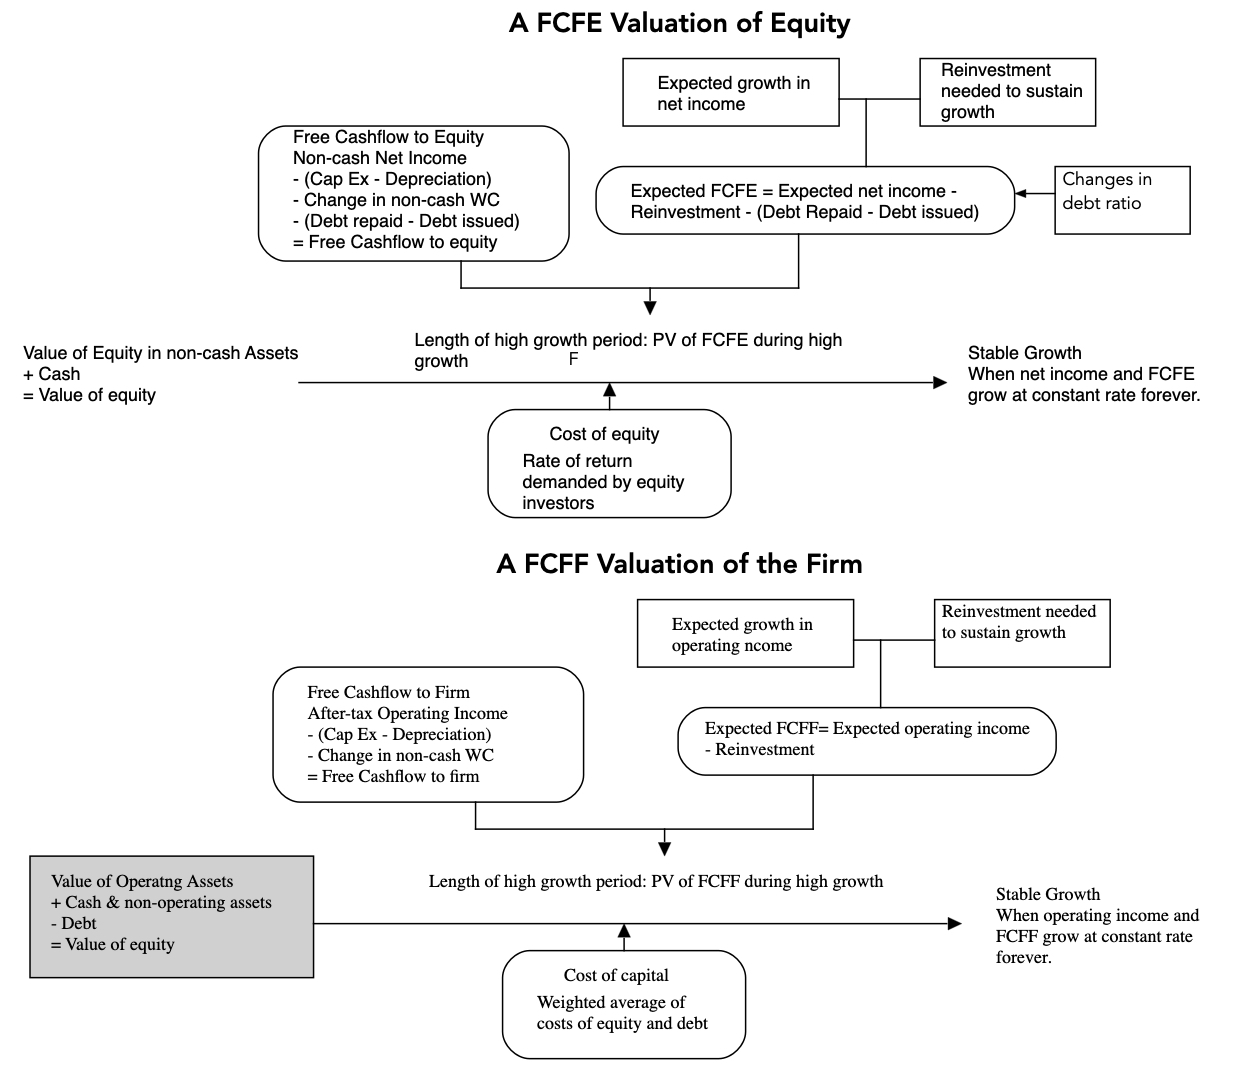
The picture below provides the contrasting uses of FCFE and FCFF in valuation:


With either estimate of free cash flow, the end game is estimating the free cash flows in the future, and the way we compute free cash flows  can be different from when we computed free cash flow for explaining the past. Here are a few reasons why:
  1. Unusual or Extraordinary items: When explaining last year’s cash flows, you should consider all items, even if they are one-time or extraordinary, since they are cash flows. However, if you are computing cash flows as a base for forecasting the future, you should eliminate any items that you don’t expect to recur in the future. Thus, a cash inflow from a one-time divestiture of a division or a cash outflow due to a loss in a lawsuit, though part of free cash flows last year, will be excluded, if you are computing a base-year free cash flow for estimating future cash flows.
  2. Normalized vs Actual numbers: For items that are recurring, but volatile, there is a good case to be made that while you will use the actual values, if computing free cash flows for the most recent year, you should be normalizing them, though the methods you use for normalization can vary across items. With the change in non-cash working capital, a notoriously volatile item on a year-to-year basis, I have found that looking at non-cash working capital as a percent of revenues, and using that statistic to reestimate the change in non-cash working capital in the most recent year provides a better base year foundation. In the Microsoft FCFE calculation, shown in the earlier section, using the historical average of non-cash working as percent of revenues of -10.18% (average from 2012-21), would have yielded a change in non-cash working capital of -$2,552 million in the base year, making it a cash inflow, rather than the outflow of $1,086 million that we attributed to working capital that year. With cash acquisitions, where a company may do only one big acquisition every three or four years, taking a long time series and averaging acquistions over that period will yield a better recurring value.
  3. Stock-based Compensation and Acquisitions: The most hotly discussed item in cash flow estimation is stock-based compensation, in the form of restricted stock or options. A simplistic reading is to argue that is non-cash and add it back, just as you depreciation and amortization, but stock-based compensation is not comparable. While depreciation and amortization are truly non-cash, stock-based compensation is more of an in-kind expense, where you give away shares of equity in the company instead of paying cash. If you are estimate free cash flows (to the firm or to equity), with the intent of valuing that firm, adding back stock-based compensation is equivalent to arguing that you can either stop paying employees in the future (and still hold on to them) or that you can keep giving away equity stakes in your company with no consequences for value per share. In short, there is no justification for adding back stock-based compensation to get to cash flows, and none of the numerous variants of adjusted EBITDA that you see populating annual reports or prospectuses holds up to scrutiny. Using the logic that paying for something with shares, instead of cash, still has an effect on free cash flows, we would argue that a company that plans to grow through acquisitions, using its own stock as currency, is reinvesting, and that this reinvestment should reduce expected free cash flows to equity, to existing shareholders. During the 2021 fiscal year, Microsoft bought Nuance Communications for $19.76 billion in all stock transaction, and that amount should be treated as reinvestment for the year, even though it is technically non-cash.
  4. Taxes: With free cash flows to equity, you start with net income but that net income can be skewed up if the company had a low effective tax rate that year, either because of write offs or losses carried forward into that year, or down, if it faced an unusually high tax rate that year. With free cash flows to the firm, the effective tax rate plays an even more direct role in determining cash flows, when you use it compute your after-tax operating income. In both cases, it makes sense to leave the effective tax rate at its actual level, when computing free cash flows for the past, but to rethink that when your objective is to forecast future free cash flows. I would suggest looking at an average effective tax rate over a longer period, in computing the base year free cash flow, and then also targeting the marginal tax rate, as you forecast taxes for the future. In the Microsoft FCFF calculation, this would imply replacing the effective tax rate of 13.83% with an average effective tax rate of 22%, using the 2017-2021 time period, which would lower free cash flows to the firm.
  5. Accounting Inconsistencies: I have written about the inconsistency in how accountants calculate capital expenditure at firms with significant investments in intangible assets and R&D, and that inconsistency can play out in your FCFE computation. While R&D remains a cash outflow, whether you treat it as an operating or a capital expenditure, moving it from operating to capital expenditures can alter your perception of a company's operations. In the case of Microsoft, for instance, capitalizing the $20,716 million that the company spent on R&D in 2021, will increase the net income for the company, while also raising the reinvestment by an equivalent amount. Put simply, Microsoft is much more profitable than the accounting statements lead you to believe, while reinvesting more than you thought it was, and both of those conclusions will have implications for valuation
In short, in intrinsic valuation, where your objective is get the best estimates that you can for the future, you have a great deal more flexibility and discretion in which items you include (and exclude) in computing free cash flows, and how you estimate values for those items. If you are wondering whether it makes enough of a difference to bother, consider what Microsoft's FCFE look like with all five adjustments made to them below:
The capitalization of R&D adds about $3.7 billion to net income, about $17 billion to depreciation and amortization and about $20.7 billion to cap ex, netting out to no effect on FCFE but with significant changes to profits and reinvestment. Incorporating the stock-based acquisition pushed up total reinvestment substantially, though the question of whether this should be built in as a recurrent component will depend on the story you tell about Microsoft.

Pricing
    The final arena where free cash flows can be used is in pricing, and more specifically, in scaling market price. Again, the question of which variants (FCFE or FCFF) can be used depends on whether you are using an equity pricing multiple (where the market cap or share price is in the numerator) or an enterprise value multiple (where it is the market value of operating assets in the numerator):
  • With equity multiples, you can scale the market value of equity (or market capitalization) of a company to its free cash flow to equity, to estimate a Price to FCFE multiple, and offer it as an alternative to the much more widely used PE ratio, where market capitalization is scaled to net income. 
  • With enterprise value multiples, you can scale enterprise value to FCFF, instead of using EBITDA or revenues as your scalar. Again, you could argue for the benefits of a more complete measure of cash flow, but as with FCFE, FCFF will be more volatile than revenues or EBITDA, making it difficult to pass pricing judgment. 
The logic that analysts use for the use of free cash flows is simple and seems compelling. If the value of a business is the present value of its expected cash flows, as we argue in intrinsic valuation, it seems reasonable to also argue that the free cash flow that a business generates is a better measure of its value than the accounting earnings. 
In sum, there is nothing inherently better about using free cash flows instead of earnings in a pricing setting, and you can argue that the additional volatility and loss of perspective that comes with free cash flow numbers yields worse pricing. I agree, with one caveat. Even if you choose to stay with PE ratios, as your pricing multiple, knowing how much of earnings gets reinvested back into the firm is a useful input in making your pricing judgments.

Free Cash Flows: Perspective

    With that long lead in on free cash flows, let us talk about why free cash flows vary across companies and across time. To make the connection, I am going to fall back on a structure that I have used before, the corporate life cycle, to look at the evolution of FCFE, as companies age, and use that structure to also examine how these FCFE play out as cash returned to shareholders, over time.

The Life Cycle Effect

    In a corporate life cycle structure, you trace a business from start-up (birth) to the toddler years (very young businesses) through their teenage years into middle and old age. I have found it useful in explaining why the focus of a business changes from finding investment opportunities, when young, to finessing capital structure, as middle age companies, to deciding how best to return cash to investors, in old age, as well as why the challenges you face in valuation are different for young companies than more mature businesses. The corporate life cycle also provides a framework for explaining how free cash flows evolve, as companies move through the life cycle:

Focusing on free cash flows to equity, you should expect to see negative values, early in the life cycle, as businesses struggle to make money and have to reinvest to deliver on their growth potential at the same time, and a resultant dependence on raising fresh equity capital (from VCs and public market investors) to keep going. As their business models take form, and they turn the corner on profitability, you should continue to see negative cash flows because of the need to reinvest to grow; in general, you should expect to see positive cash flows lag positive earnings. At mature businesses, you should expect to see free cash flows to equity to not only stay positive, but also to grow faster than earnings, and in decline, while earnings will follow revenues on their path down, divestitures and asset sales can allow FCFE to be higher than earnings. To see how net income and FCFE evolve, as a company ages, I computed the net income and FCFE for Tesla every year from 2006 to 2021:

Source: Capital IQ

For much of its existence, Tesla has been a money-losing company, reflecting its young, high growth status. It turned the profitability corner in 2020, though FCFE stayed mildly negative that year, and in 2021, the FCFE also turned positive. In corporate life cycle terms, Tesla is growing up, which is good news in terms of profitability and cash flows but bad news, if growth is what rings your bell.

To see if the corporate life cycle has relevance in explaining differences in free cash flows to equity across companies, I looked at US companies, broken down by age, into ten deciles, from youngest to oldest, and computed each component of the FCFE, by decile:

As you can see in the table, among the youngest companies (in the lowest decile), more than 73% are money-losing and more than three quarters of these companies have negative free cash flows to equity. As companies age, the proportion of companies that are money making increasing, as does the percent that has positive FCFE. In relative terms, the companies in the middle of the corporate life cycle, deliver the highest FCFE as a percent of market capitalization

Dividends and Buybacks
    You can critique FCFE as an abstraction, since shareholders cannot lay claim on them, and argue that it is only cash flows that are paid out to equity investors that count. You could focus just on dividends, but by doing so, you are missing a large proportion of cash returned by companies; in 2021, more than two thirds of all cash flows returned to shareholders were in the form of buybacks. Staying with the corporate life cycle construct, we looked at dividends and stock buybacks by companies in each age decile: 

Consistent with what we unearthed in the FCFE table, where younger companies are more likely to be money losing and have negative FCFE, we see that the a much higher percent of older companies pay dividends and buy back stock than younger companies. In the aggregate, this table suggests that it is the presence or absence of FCFE that drives dividend policy, with most firms that have negative FCFE choosing not to return cash and many that have positive FCFE deciding to return cash. 

Pricing
    Earlier, we noted that there are some analysts who use free cash flows, as a basis for pricing, than for intrinsic valuation, with price to FCFE replacing price earnings ratios in equity pricing, and EV to FCFF taking the place of EV to EBITDA multiples, in enterprise valuation. While there are some cash flow purists who prefer cash flow multiples to earnings multiples, they will never be widely used for two reasons. First, the reason that investors like to price companies, using multiples, is because they have frames of reference on these multiples, i.e., a sense of what a typical number should like like in a sector. With PE ratios, their long history of usage has left investors with frames of reference that they can use, rightfully or wrongfully, in pricing stocks, but with Price to FCFE ratios, there is no such reference frame. Second, as you can see from how FCFE is computed, with the netting out of reinvestment and incorporating debt cash flows, it will always be a more volatile number than earnings, with much of the additional volatility telling you little about current earnings power.
   If one problem with using a price to FCFE ratio to judge whether a stock is cheap and expensive is a lack of perspective on what comprises a high, low or typical value, we can counter this problem by estimating the price to FCFE ratio for every publicly traded company globally and compare the distribution of the ratio to distribution for PE ratios.

Source: S&P Capital IQ

The good news is that the distribution for price to FCFE resembles the distribution for PE ratios, but the bad news is that you are replacing a multiple where you lose almost half the firms in your sample, with PE ratios, with an even more flawed multiple in Price to FCFE, which cannot be calculated in more than 63% of publicly traded companies. Put simply, if you start with a peer group of 25 firms, you may end up with a final sample of 10 firms or less, if you are pricing with a price to FCFE multiple. Moreover, price to FCFE ratios show more divergence than PE ratios, as can be seen in the spread between the first and third quartiles of each one.
    I did the same assessment for EV to FCFF, with the contrast drawn to EV to EBITDA, both to see contrasts and get perspective:
Source: S&P Capital IQ
Not surprisingly, the multiple of EBITDA, a pre-tax and pre-reinvestment cash flows, is lower than the multiple of FCFF, which is post-tax and after reinvestment. While you lose about 42% of firms with EV to EBITDA multiples, where EBITDA is negative, you lose close to 55% of global firms, because of negative FCFF. 
    As a cash flow advocate, it pains me to say this, but if your game is pricing stocks, I see little benefit from replacing traditional multiples (like PE and EV to EBITDA) with free cash flow scaled pricing measures. That is because a single year’s free cash flow (to equity or the firm) actually has more noise in it, and is less informative about a company’s operating health, than a single year’s earnings (net income or EBITDA). 


YouTube Video


Monday, September 26, 2022

Reaping the Whirlwind: A September 2022 Inflation Update!

In my early 2021 posts on inflation, I argued that while the higher inflation that we were just starting to see could be explained by COVID and supply chain issues, prudence on the part of policy makers required that it be taken as a long term threat and dealt with quickly. Not only did they not do so, but the fiscal and monetary actions they took in 2021 exacerbated inflationary pressures. By the start of 2022, the window for early action had closed and for much of this year, inflation has been the elephant in the room, driving markets and forcing central banks to be reactive, and its presence has already induced me to write three posts on its impact. In my first on May 6, 2022, I put the surge in inflation, in 2022, in historical context and argued that it is unexpected inflation that shakes up the economy and caused damage to financial assets, and that until we reached a steady state, where expectations and actual inflation converge, markets would continue to be unsettled. In a follow-up post on May 20, I looked at the disparate effects of inflation on individual companies, positing that safer companies with pricing power are more protected against inflation than riskier companies in competitive businesses. In a third post on July 1, 2022, I pointed to inflation as a key culprit in the retreat of risk capital, i.e., capital invested in the riskiest segments of every market, and presented evidence of the impact on risk premiums (bond default spreads and equity risk premiums) in markets. In terms of content, I am afraid this post will contain nothing new, but the fresh uncertainties about inflation, and its impact, that have opened up this summer require at least an updating of the numbers. 

Inflation: Actual and Expected

In September 2022, there is no denying that inflation is back, and with a vengeance, though we can still debate how quickly it will fade, and to what level. The happy talk of 2021, where many policy makers and investors were dismissive of its emergence, attributing it almost entirely to the COVID recover and supply chain problems, has largely faded and a grim acceptance has set in that we have an inflation problem, the solution to which may be perhaps as painful as the problem. One reason investors and businesses are struggling with this latest bout of inflation is that they have been spoiled by a decade of low and stable inflation, and as a consequence, have neither planned for high and unstable inflation, in their business models, nor developed analytical tools to deal with that inflation. To see the inflation break in 2022, relative to history, I report on four widely used measures of inflation in the US - the consumer price index (CPI ), with & without seasonal adjustments, the producer price index (PPI) and the GDP Price Deflator below:

Source: Federal Reserve, St. Louis (FRED)
On every measure, inflation exploded in the first half of 2022, with a leveling off, albeit at high rates in the summer. The table below the graph also backs up my point about the 2011-2020 time period being an outlier, in terms of inflation being low (with the average at 1.73%) and stable (with the standard deviation across the years of 0.81%). The graph above is one of actual inflation, but as I have emphasized all through this year, it is expected inflation that drives markets, and it is on measures that try to capture inflation expectations that you see the turn in 2022. While spending the bulk of 2021 in denial, investors seem to have woken up, and expected inflation numbers are reflecting that. In the charts below, I graph out the inflation that consumers are expecting in two different surveys, one from the University of Michigan and the other from the NY Fed that show the rise in expected inflation:
As you can see, in both surveys, the expected inflation number has risen, to 5.20% in the University of Michigan survey and to 5.7% in the NY Fed survey. This rise in expected inflation also shows up in a different survey of expectations, from the Fed (St. Louis), measuring the probabilities of expected inflation in consumer expenditures:

Fed Reserve, St. Louis
After a decade where most expected inflation to be less than 1.5%, with a small percentage even expecting deflation, more than 80% now expect inflation to be higher than 2.5%, in the future and none expect deflation. The problem with survey-based expectations is that they are volatile and often are responses to recent experiences with inflation. There is a market-based estimate of inflation that comes from the US treasury market, where a comparison of yields on a treasury bond with that on a inflation-protected treasury bond of equivalent maturity provides a measure of expected inflation. This measure is reported, for the 10-year US Treasuries, from 2003 through September 2022, in the graph below:

On September 23, 2022, the market-imputed inflation number stood at 2.37%, the difference between the 10-year T.Bond rate of 3.69% and the 10-year TIPs rate of 1.32% on that day. It is lower than the survey-based inflation expectations, but  it a long term expected inflation rate, and you can use the term structure of Treasury and TIPs rate to extract an expected inflation term structure:

Put simply, investors are expecting inflation to peak over the next year and subside in the long term, close to the levels that we saw in the last decade. That may be hopeful thinking, and the returns on stocks and bonds over the rest of the decade will be determined by the correctness of this assessment; if investors are under estimating expected inflation in the long term, as they did in the 1970s, we are in for an extended period of malaise in markets.

Inflation’s First Order Effects: Interest Rates and Exchange Rates

Since 2008, it has become fashionable to attribute all movements in interest rates to Fed action or inaction, and as a consequence, we have lost sight of the fundamentals that determine interest rates. The most critical fundamental, and the one that best explains big movements in rates, over time, is expected inflation. For the last decade, it was not quantitative easing or Fed alchemy that kept interest rates low, but low inflation, in conjunction with anemic real growth. 

As investor expectations of inflation have risen in 2022, treasury rates have risen inexorably, across the term structure:

In keeping with our earlier assessment of investors expecting higher inflation in the near term, than the long term, rates have risen across the term structure, but short term treasuries have risen more than long term treasuries. To get a measure of the damage done to bond prices as a consequence, note that the increase in the 10-year treasury rate from 1.51% to 3.69%, in 2022, has resulted in a return of -16.45% on a constant maturity bond.

As rates have risen at different rates in the short and the long term, the US treasury yield curve, which started the year with a steep upward slope has become distorted, and on September 23, 2022, the 2-year rate, at 4.20%, was higher than the 10-year rate, at 3.69%, with a relatively flat curve beyond 10 years:

Source: US Treasury
While I am remain a skeptic on inverted yield curves as cannot-fail predictors of recessions, the message in the distortions in the yield curve on September 23, 2022, is not a positive one about the future of the economy. 

The other first order effect from inflation, and the Fed's reaction to it, has also been in the currency market, where the US dollar has soared against almost every currency, with the Euro and the British pound trading at or close to historic lows. 

At one level, this is interest rate parity at play, as US interest rate rise faster than rates in other countries. At another, it is a flight to safety, as worries about the global economy and markets take hold. At every level, though, exchange rate movements that are this strong create chaos and disruption in the economies of both the strengthening and weakening currencies.

Second Order Effects: Risk Capital and Risk Premia

If the only consequence of higher expected inflation was higher interest rates, the damage from it would be contained and perhaps even neutralized by earnings and cash flows growing at higher rates, aided by inflation. However, higher inflation almost always seems to be accompanied with more uncertainty about inflation, and it is this second order impact that does real damage, in terms of how it impacts risk capital. In my July 2022 post, I defined risk capital broadly as capital invested in the riskiest segments of each asset class, and used the picture below to illustrate its reach:

Note the contrast between risk capital and safety capital, and in a healthy market, you need a balance between the two, with the excess of safety capital leading to stagnant economies and markets, and an excess of risk capital creating bubbles in markets and distortions in the economy. The last decade, for better or worse, has seen an explosion of risk capital, aided and abetted by central banks and policy makers. Inflation’s return to the center stage has, at least for the moment, broken the spell, and risk capital has withdrawn significantly from markets. 

  • Venture capital: The VC focus on start-ups and young companies makes it a focal point of any measure of risk capital, and it has ebbed and flowed over time, with sharp pullbacks in the aftermath of the dot-com bust in 2001 and the banking crisis in 2008. The graph below updates venture capital investments, by quarter, from the first quarter of 2020 to July/August 2022:
    Source: Crunchbase

    Note the drop off in venture capital in the first quarter of 2022, and the even steeper decline in the second quarter suggests that this may not be a temporary retreat.
  • Initial Public Offerings: The exit path for the most successful of the ventures backed by VCs is an initial public offering, and the number and dollar value of initial public offerings operates as a proxy for the availability of and access to risk capital. In the graph below, we look at the this statistic across time, updated again through 2022:
    Source: Jay Ritter for historical and Pitchbook for recent IPO data
    Here again, the drop off in initial public offerings, both in number and value in 2022 has been dramatic, and if history is any guide, there will not be a quick comeback.

  • High Yield Bonds: High yield debt has always been part of the landscape of corporate bond markets, but for much of the last century, it was composed of investment grade debt that had been downgraded, as a consequence of corporate distress. Since the 1980s, companies with low ratings have been able to make issuances of their debt, with the demand for this original issuance high yield debt coming from bond buyers willing to take on additional risk. In the graph below, I track the issuance of high yield bonds over time, with a focus on the most recent quarters:
    Source: SIFMA

    As with VC capital and IPOs, note the drop off in high yield debt issuances in 2022, both in dollar value terms, and as a percent of total bond issuance.

As risk capital has moved to the sidelines, the price of risk, i.e., the premium that investors demand for taking on risk has surged. You can see this in rising default spreads in corporate and sovereign bond markets, where spreads, which started 2022 at close to historic lows have risen, and more so for the lowest ratings. 

Source: FRED

In the equity market, the only immediate weapon that equity investors have for adjusting their price of risk assessment, i.e., the equity risk premium, is the stock price, pushing stock prices down, if they want higher equity risk premiums. It is for that reason that my assessments of equity risk premiums are model-agnostic and are based upon stock prices today and expected cash flows in the future being used to back out an expected return on stocks. Those assessments in the long term (1960-2021) and in the last two years (from January 2022 to September 23, 2022) are shown below:

There are two things that stand out about equity markets in 2022. The first is the surge in the equity risk premium from from 4.24% on January 1, 2022, to 6.05%, on September 23, 2022, an increase on par with what we have seen during market crises (2001, 2008 and 2020) in the past. The second is that as equity risk premiums have jumped, the treasury bond rate has more than doubled, from 1.51% on January 1, 2022, to 3.69% on September 23, 2022. In contrast to the afore-mentioned crises, where the treasury bond rate dropped, offsetting some of the impact of the rise in equity risk premiums, this inflation-induced market reaction has caused the expected return on stocks to rise from 5.75% on January 1, 2022, to 9.75%, on September 23, 2022; that increase of 4% dwarfs the increases in expected returns that we witnessed in the last quarter of 2008 or the first quarter of 2020.

Third Order Effects: The Economy and Psyches

The first and second order effects of inflation have been significant and damaging, but the question that remains unanswered is about the long term effects on the economy, and more importantly, on investor and consumer psyches. As you have probably noticed, perceptions of where the economy is headed have worsened, as we have gone through 2022, even in the face of relatively good news on unemployment. Much of the blame for the darkening forecasts has been directed toward Jerome Powell and the Federal Reserve, and while there is much that you can critique about how the Fed has played its cards during this crisis, it is inflation that is in the driver’s seat, not the Fed. Interest rates have risen this year because of inflation expectations rising, and it is these higher rates (and expected inflation) that are leading the Fed to act. In short, the Fed has two choices, neither of which is appealing. It can do nothing, which is the path that some of its critics would rather have it take, and interest rates will continue to rise, perhaps at an even faster rate, as inflation expectations surge. Alternatively, it can try to reclaim the narrative, by acting to slow the economy down,  perhaps even putting it into a recession, with length and severity still to be determined. Rock, meet hard place!

As investors, our assessments of how inflation and the economy will evolve in the coming years will determine how much we should pay for stocks and bonds today. Having chronicled how inflation has changed the level of interest rates and the price of risk, let us bring in the remaining questions on earnings, cash flows and growth that we need to address to evaluate whether the market has under or over reacted to inflation:

In the sections below, I will focus on how I see inflation playing out in  assessments of earning and growth, for the S&P 500 companies, as well as in their cash returns (dividends and buybacks).
  1. Earnings: At the start of 2022, optimism was pervasive among analysts that the economy would continue to show strength and that earnings at US companies, up almost 47% in 2021, would grow strongly in 2022 and 2023. That optimism about the economy has faded, but there has not been a concurrent drop in estimated earnings, as you can see in the table below:
    Source: Factset, Ed Yardeni
    The earnings estimate for 2023, for S&P 500 companies, stood at 243.46, down only 0.6% from what it was on January 1. There are some subtle signs that forecasts of a recession are finding their way into earnings estimates. First, as you can see in the table, analyst estimates for what companies would generate as earnings in 2023 rose every month from January to June, but have dropped, albeit only slightly, during the summer. Second, the percentage of companies that are offering negative guidance about future earnings stood at 54%% in September 2022, suggesting that they see stormy weather ahead. 
    Source: Factset

  2. Cash Flows: Investors in public equities have no direct claim on earnings, and are reliant on companies returning cash to them in dividends, and increasingly over the last few decades, in stock buybacks. The dividends paid change relatively little from period to period, making them sticky, but stock buybacks are more volatile, with sharp cutbacks during crises or when companies become more concerned about their economic futures. The table below graphs dividends and buybacks, by year, going back to 2001, and also the dividends and buybacks, by quarter, just for the last four years:

    Note the rising proportion of cash returned in buybacks, over the last 20 years, and the pullbacks in 2008/2009 and the first two quarters of 2020, in response to crises. That buyback number has largely recovered from its COVID swoon, and hit an all time high in 2021, with $734 billion in stock buybacks, across the S&P 500 companies. After rising again in the first quarter of 2022, we did see a pullback, albeit a small one, in the second quarter of 2022, with the possibility that there will be more coming in the third and fourth quarters of the year.
  3. Long term inflation and interest rates: Having spent all of 2022 trying to hit a moving target on expected inflation, and the resulting interest rate, the one guarantee for the future is that there is more change coming. To make a judgment of direction, we have no choice but to take a stand on where inflation will settle in after supply chains are fixed, COVID is in the past and perhaps after the economy has cooled down. If we will revert back to inflation of 1-2%, as the market seems to believe we will, we will face a very different end game than if we revert back to 1980s levels of 3-4%. 
With the caveat that I have absolutely no new insights or information into this process, I did make my estimates for the S&P 500, with the resulting valuation shown below:
Download spreadsheet

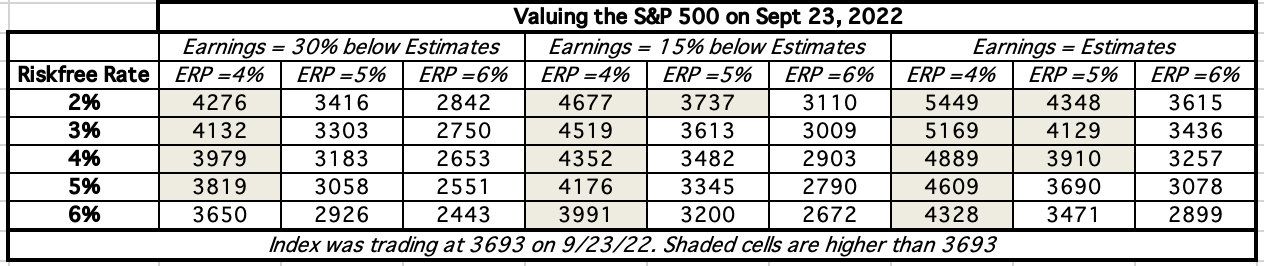
I think that the given market pricing today, and my expectations of expected earnings and cash flows, stocks are very mildly over valued on September 23, 2022. I trust my judgments enough that I will leave my existing equity holdings intact, but I am not quite ready to jump in and make bets on market direction now. Clearly, your assumptions for the future will be different from mine, and I have a Do-It-Yourself (DIY) valuation of the S&P 500 that you can use to make your own judgment. In the table below, I list out the valuations that I get for the index with various combinations of 10-year treasury bond rates, equity risk premiums and assumptions about earnings in the future, relative to analyst forecasts:
S&P 500 Intrinsic Value Scenarios
If you are bullish, the assumption that makes the biggest difference is where you see equity risk premiums converging, with premiums closer to 4% yielding undervaluation on the index, even with significant earnings shocks built in. At the other end of the spectrum, if the equity risk premium stays at 6% or higher, the only scenario where you arrive at a value close to the index is if the 10-year T.Bond rate drops to 2% and earnings estimates come in as expected, with significant corrections to come, in scenarios where rates stay higher and/or earnings come in below estimates. 
    Given a choice between allowing inflation to play itself out and initiating polices that trigger a recession, there are some who are pushing for the former, arguing that trading off the certain pain that comes with a recession for the uncertain benefits of lower inflation is not good policy. I sympathize, but the dangers of letting inflation play out is that if it does so in unpleasant ways, where it stays high and volatile, its effects are going to be far more long term and more damaging. High and volatile inflation corrodes economies and markets from the inside out, destroying faith in currencies and making  investors and businesses behave in dysfunctional ways. 

YouTube Video

Spreadsheets
Datasets


Wednesday, July 27, 2022

A Zomato 2022 Update: Value, Pricing and the Gap

On July 21, 2021, I valued Zomato just ahead of its initial public offering at about 41 per share. The market clearly had a very different view, as the stock premiered at 74  per share and soared into the stratosphere, peaking at 169 per share in late 2021. The last few months have been rocky, as the price has been marked down, partly in response to disappointing results from the company, and partly because of macro developments. At close of trading on July 26, 2022, the stock was trading at 41.65 per share, and the mood and momentum that worked in its favor for most of 2021 had turned against the company. In this post, I will begin with a quick review of my 2021 valuation, then move on to the price action in 2021 and 2022 and then update my valuation to reflect the company's current numbers. 

My IPO Valuation

I valued Zomato, soon after it filed its prospectus for its initial public offering, in July 2021. The details of that valuation are in this post, but to cut a long story short, I argued that an investment on Zomato was a joint bet on India (that economic growth would bring more discretionary income to its people), on Indian eating habits (that Indians would eat out at restaurants more than they have in the past) and on the company (that its business model and first move advantages would give it a dominant market share of the food delivery market). I summarized my valuation in a picture:

I valued the company at close to ₹41, and note that this valuation incorporates the proceeds from the IPO and adjusts the share count for the offering. I argued then that notwithstanding the potential growth in the market, and Zomato's advantageous positioning, it was being over priced for its IPO, at ₹76 per share.

In response to the pushback that I got from those who disagreed with my valuation, with half arguing that I was being way too optimistic about the future and the other half that I was ignoring the potential for growth overseas and in new businesses, I followed up with a second post, where I let readers choose their own story line for Zomato, and came up with a table that linked stories to values:

Using my test of whether a valuation story is possible (the weakest test), plausible (a stronger test) and probable (the acid test), I posited that you could justify a value per share for Zomato of 40 - 50, per share, with plausible stories, but that valuations that were much higher required pushing the limits of plausible narratives. 

The Pricing Game

One reason that I enjoy valuing a company just ahead of its market debut is that there is no market price to bias your analysis; in my experience, the market price operates as magnet, drawing intrinsic valuations towards it. The downside is that without a market price acting as an anchor, your valuations can easily come unmoored from reality. No matter what, having a valuation in hand makes the first day of trading much more interesting, as you wait for the market to pass its own judgment on the stock’s pricing, though that judgment reflects more a pricing game than a value estimate.

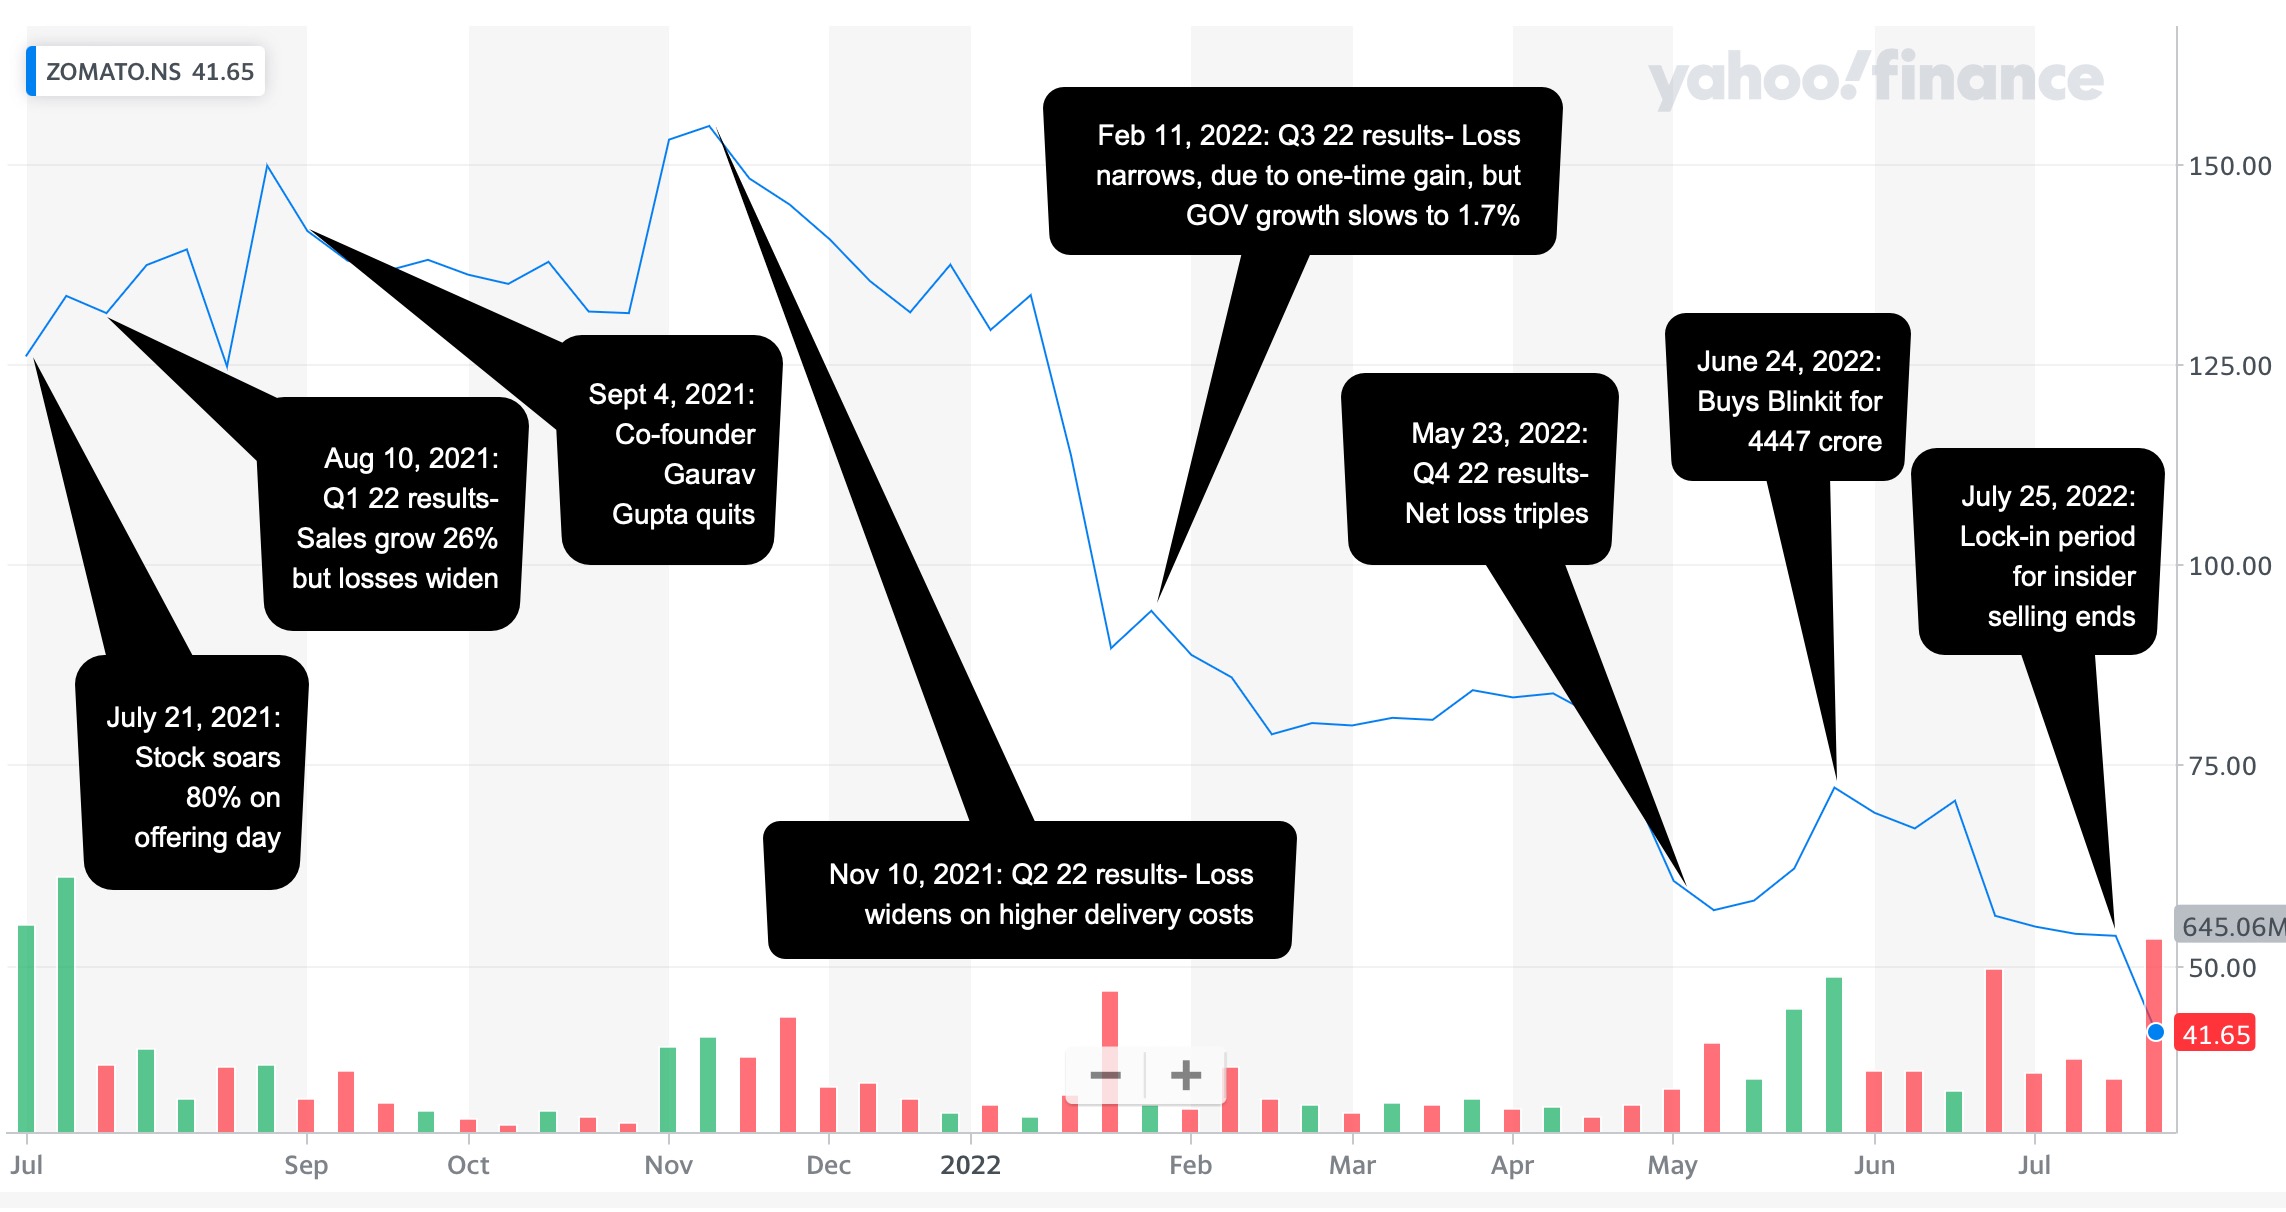
Staying with the theme that it is demand and supply, mood and momentum that determine what happens to a company’s stock in  first few months of trading, the buzz that accompanied Zomato’s listing and its standing as one of the first new age Indian companies to go public, spilled over into the first day of trading, as the stock soared 51% over its offering price of 76, and rose as high as 137 during the trading day. That opening day glow lasted for the rest of 2021, abetted by easy access to risk capital, and the stock maintained its lofty pricing. If you are tempted to attribute the price performance to good news from the company, its earnings reports continued to report escalating losses and one of its co-founders quit in September 2021. 


In 2022, though, the company's stock rediscovered the laws of gravity, and news stories that would have elicited positive responses in 2021 are having the opposite effect. The most recent plunge in the stock price seems to have been precipitated by Zomato’s acquisition of Blinkit, a grocery delivery company, for $570 million (4400 crores), on June 24, 2022 and the expiration of the lock-in period, allowing insiders to sell shares in the company. At close of trading on July 26, Zomato’s stock price was at 41.65 per share.

Updating the fundamentals

Though some have suggested that price dropping to my value is vindication of my valuation, I am not part of that group for three reasons. First, it seems skewed to celebrate only your successes and not your failures, and it behooves me to let you know that I also valued Paytm at close to 2000 per share, and the stock is currently trading at 713. Second, even if nothing in my valuation has changed, the value per share of 41 per share was as of July 2021, and if it is a fair assessment, the expected intrinsic value per share in July 2022 should be roughly 11.5% higher (i.e., grow at the cost of equity), yielding about ₹46 in July 2022. Finally, the company and the market have changed in the year since I last valued it, and to make a fair judgment today, the company will have to be revalued.

Company Fundamentals

In the year since my IPO valuation, there have been four quarterly reports from the company, in addition to news stories about governance and the company's legal challenges,  and there is a mix of good and bad news in them. 

    On the good news front, the food delivery market in India has continued to grow over the last year, and Zomato has been able to maintain its market share. In fact, there are signs that the market is consolidating with Zomato and Swiggy controlling 90% of the market share of restaurant deliveries. As a consequence, Zomato's gross order value and revenues have both jumped over the course of the last year:

In addition, the substantial cash that Zomato raised on its IPO is providing it with a cash and liquidity cushion, with cash and short term investments jumping from 15,000 in March 2021 to 68746 (including short term investments) in March 2022. Since Zomato is a young, money-losing company, and the likelihood of failure acts as a drag on value, this will benefit the company, since it provides not only a cushion for the firm but also eliminates dependence on external capital for the next few years.

    On the bad news front, the take rate, i.e., the slice of gross order value (GOV) that Zomato keeps has dropped substantially over the last year, reflecting increased competition in the market, higher delivery costs and Zomato's entry into newer markets (like grocery delivery) with lower revenue sharing. In addition, the growth has come in fits and starts, and given Zomato's active acquisition strategy, it is not clear how much of the revenue growth is organic and how much is acquired. Not surprisingly, the company's losses have ballooned over the last year:

While there was a management narrative of economies of scale and improved contribution margins, the end numbers don't back up either contention, with cost of goods sold rising much faster than revenues and operating and net margins both becoming more negative over the last year. (And no, you cannot add back stock based compensation and come up with an adjusted EBITDA to claim otherwise....) In addition, the Indian government put both Swiggy and Zomato on notice that they may be facing anti-trust action in the future, perhaps opening the door to more competition.
    
    On the still-to-be-decided front, Zomato has continued on a strategy of acquiring small companies to advance its growth agenda, and while many of these acquisitions have been small, its most recent acquisition of Blinkit has raised questions about whether this growth is coming at a reasonable cost. (Again, the contention from management that this is a capital-light company that growth with little investment is not true, since these acquisitions are its true cap ex, making it a capital intensive firm.)  The potential conflicts of interest in this acquisition, with a Zomato co-founder's spouse operating as the CEO of Blinkit, also add to the questions. Even if the Blinkit acquisition pans out, it is an open question whether Zomato can continue to deliver growth effectively and efficiently through this acquisition-driven strategy, using its own shares as currency, especially as it scales up. In addition, Zomato is also building a portfolio of equity positions, which do not show up as part of operating assets, and the founders rationalize this behavior by arguing that these are "the building blocks for a robust quick-commerce business in India, and will accelerate digitisation and growth of  the food and restaurant industry which accelerates our core food business " (from the 2022 Q4 shareholder discussion). Even if we accept this argument for minority holdings, it will add to the complexity in the firm and make investors and traders more wary, especially in periods of uncertainty.

The Macro Factors

    When I valued Zomato in July 2021, the markets (in India and globally) were in the midst of a boom, with abundant supply of risk capital and optimism about economic growth, pushing up the prices of tech companies, generally, and the youngest, most money-losing tech companies, specifically. Those circumstances no longer hold, with two big developments in global markets, both of which I have talked about in previous posts

  1. Inflation returns: Inflation is back in almost every part of the globe, and has unsettled markets. In this post, from May 2022, I noted that financial assets (stocks, bonds) lose value when inflation is higher than expected, and that a decade of low and stable inflation has left investors exposed and vulnerable. The effects of inflation show up first as higher risk free rates, across currencies, and next in higher risk premiums, with both equity risk premiums and default spreads rising. In a follow-up post a couple of weeks later, I looked inflation's effects on individual companies and argued that less-risky companies with pricing power and high gross margins would be less exposed than riskier, money-losing companies. (I will leave it to you to judge where Zomato falls on this continuum.)
  2. Risk Capital flees: In a post at the start of this month, I looked at how the retreat of risk capital, i.e., capital invested in the riskiest assets (from venture capital invested in start ups to investments in the riskiest collectibles) was playing out in higher equity risk premiums in mature markets, and in a later post a few days later, even bigger increases in equity risk premiums in emerging markets. As a company with the bulk of its business in India, Zomato again is more exposed to these developments.
A higher equity risk premium for India (9.08% in July 2022, compared to 6.85% in July 2021) and a higher riskfree rate in rupees (4.78% in July 2022, compared to 4.25% in July 2021) conspire to push up the cost of capital for Zomato (and other Indian companies) by about 1.5-2% from my IPO valuation.

A Zomato Revaluation
Incorporating the updated financials for Zomato (with the doubling of revenues in conjunction with larger operating losses) and the higher cost of capital, from macro developments, I revalued Zomato on July 26, 2022:

Download spreadsheet with valuation (and DIY)

Note that my core story for the company has not changed, but its Blinkit acquisition suggests that Zomato is planning a substantial foray into the grocery delivery business (pushing up the total market size currently and in the future), albeit at the expense of a smaller slice of revenues and a smaller market share. The value per share has dropped from 40.79 to 35.32 per share, with much of the value change from last year is coming from macroeconomic developments, manifested in a higher cost of capital. For this value to be generated, the company will need to stop paying lip service to contribution margins and adjusted EBITDA, and work on reducing growth in its cost of goods sold.

An Action Plan

    So, what now? As with my valuation last year, let me emphasize that this is not the valuation of Zomato, but is my valuation and it will inform my decisions on the company. I have a story for Zomato, and valuation inputs that reflect that story, but I could be wrong on both fronts, and as I did last year, I tried to capture these uncertainties in a Monte Carlo simulation:

Oracle Crystal Ball used for simulations
Allowing for the wide ranges of estimates that you can have on the total market for food (restaurant and grocery) delivery in India in 2032 and the uncertainties about Zomato's share of that market and its operating margins, you get a range of values. The median value of 34.12 is close to the base case value of 35.32, not surprising since the input distributions were centered on my base case input values, and at its current stock price (41.65 on July 26), the stock is still at the 70th percentile. That said a few more weeks like the last two will push the price below my median value, and if it does, I would buy Zomato, as part of a diversified portfolio (and not as a stand alone investment).

    If you are a trader, you are playing a different game entirely, and Zomato's value is not part of that game. You are gauging mood and momentum, which at the moment are extremely negative for the stock, and trying to get ahead of a shift back to the positive. To make that judgment, you will be better served poring over charts, looking at price and volume movements, consulting with an astrologer, or even visiting your favored temple, church or mosque. 

Conclusion
    I know that some of you did buy Zomato shares in their glory days in 2021 and are either continuing to hold, hoping for a come back, or have sold, and are licking your wounds. I am sorry for your loss, but please don't attribute to conspiracies (where insiders, founders and backers play the role of villains) what can be better explained by greed, and its capacity to cloud judgment. No matter how tempted you are to blame the financial news, journalists, equity research analysts and others for your decision to buy Zomato at its heights, that decision was ultimate yours and the first step in becoming a good investor is taking ownership of your decisions. Put bluntly, if you live by momentum, you die by it. Your consolation prize is that you have lots of company in this market (from Cathie Wood at Ark to the thousands of investors who put their money in Bitcoin, NFTs and other cryptos), and this too shall pass!

YouTube video

Blog Posts on Zomato
Spreadsheets