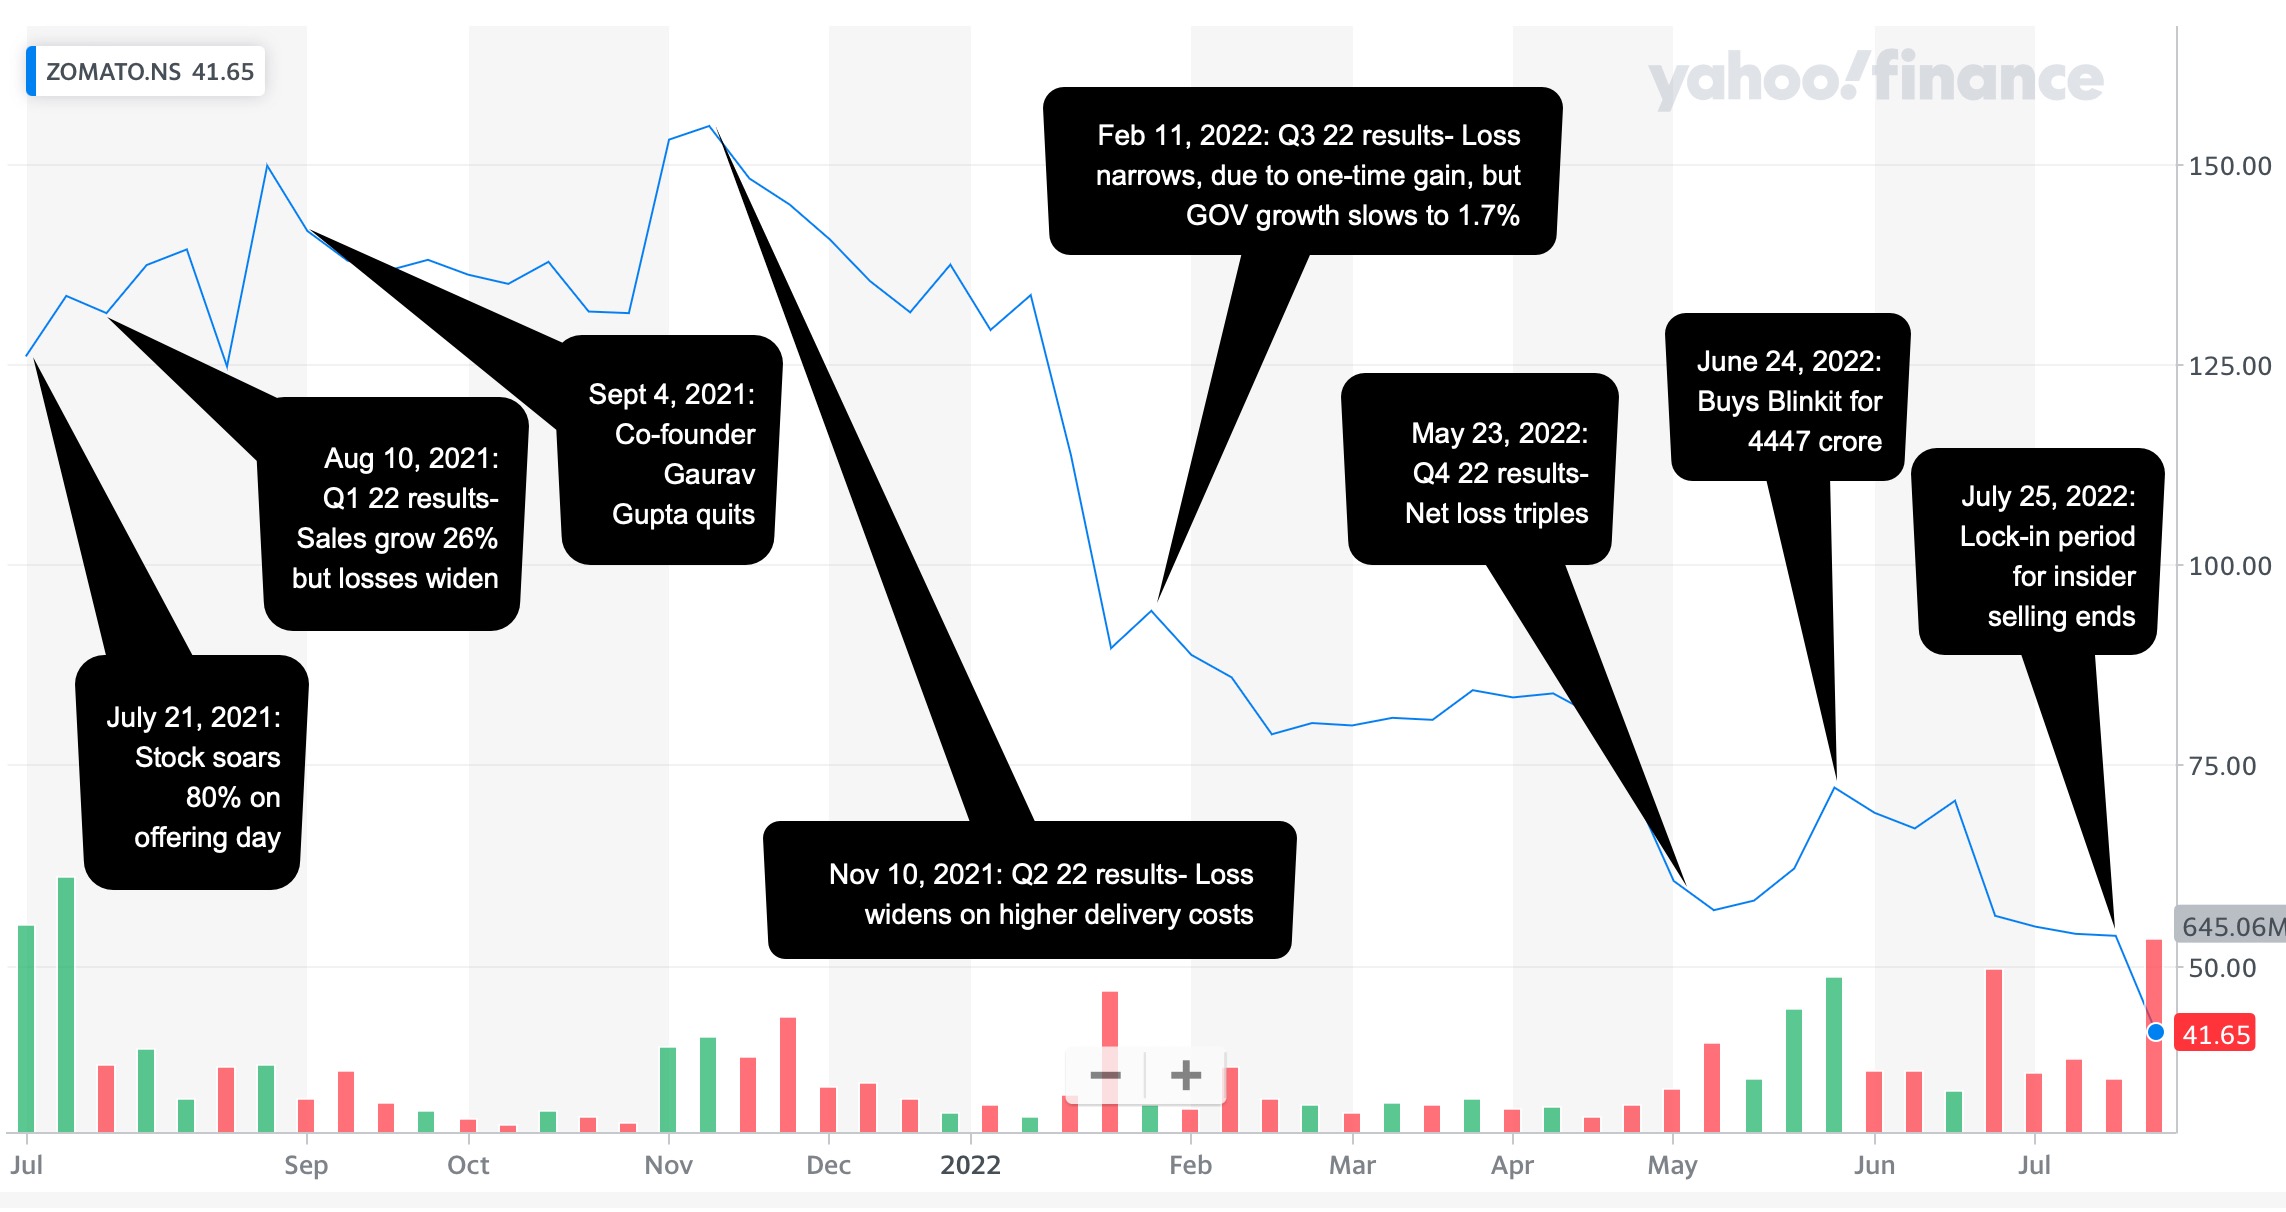
On July 21, 2021, I valued Zomato just ahead of its initial public offering at about ₹41 per share. The market clearly had a very different view, as the stock premiered at ₹74 per share and soared into the stratosphere, peaking at ₹169 per share in late 2021. The last few months have been rocky, as the price has been marked down, partly in response to disappointing results from the company, and partly because of macro developments. At close of trading on July 26, 2022, the stock was trading at ₹41.65 per share, and the mood and momentum that worked in its favor for most of 2021 had turned against the company. In this post, I will begin with a quick review of my 2021 valuation, then move on to the price action in 2021 and 2022 and then update my valuation to reflect the company's current numbers.
My IPO Valuation
I valued Zomato, soon after it filed its prospectus for its initial public offering, in July 2021. The details of that valuation are in this post, but to cut a long story short, I argued that an investment on Zomato was a joint bet on India (that economic growth would bring more discretionary income to its people), on Indian eating habits (that Indians would eat out at restaurants more than they have in the past) and on the company (that its business model and first move advantages would give it a dominant market share of the food delivery market). I summarized my valuation in a picture:
I valued the company at close to ₹41, and note that this valuation incorporates the proceeds from the IPO and adjusts the share count for the offering. I argued then that notwithstanding the potential growth in the market, and Zomato's advantageous positioning, it was being over priced for its IPO, at ₹76 per share.
In response to the pushback that I got from those who disagreed with my valuation, with half arguing that I was being way too optimistic about the future and the other half that I was ignoring the potential for growth overseas and in new businesses, I followed up with a second post, where I let readers choose their own story line for Zomato, and came up with a table that linked stories to values:
Using my test of whether a valuation story is possible (the weakest test), plausible (a stronger test) and probable (the acid test), I posited that you could justify a value per share for Zomato of ₹40 - ₹50, per share, with plausible stories, but that valuations that were much higher required pushing the limits of plausible narratives.
The Pricing Game
One reason that I enjoy valuing a company just ahead of its market debut is that there is no market price to bias your analysis; in my experience, the market price operates as magnet, drawing intrinsic valuations towards it. The downside is that without a market price acting as an anchor, your valuations can easily come unmoored from reality. No matter what, having a valuation in hand makes the first day of trading much more interesting, as you wait for the market to pass its own judgment on the stock’s pricing, though that judgment reflects more a pricing game than a value estimate.
Staying with the theme that it is demand and supply, mood and momentum that determine what happens to a company’s stock in first few months of trading, the buzz that accompanied Zomato’s listing and its standing as one of the first new age Indian companies to go public, spilled over into the first day of trading, as the stock soared 51% over its offering price of ₹76, and rose as high as ₹137 during the trading day. That opening day glow lasted for the rest of 2021, abetted by easy access to risk capital, and the stock maintained its lofty pricing. If you are tempted to attribute the price performance to good news from the company, its earnings reports continued to report escalating losses and one of its co-founders quit in September 2021.
In 2022, though, the company's stock rediscovered the laws of gravity, and news stories that would have elicited positive responses in 2021 are having the opposite effect. The most recent plunge in the stock price seems to have been precipitated by Zomato’s acquisition of Blinkit, a grocery delivery company, for $570 million (₹4400 crores), on June 24, 2022 and the expiration of the lock-in period, allowing insiders to sell shares in the company. At close of trading on July 26, Zomato’s stock price was at ₹41.65 per share.
Updating the fundamentals
Though some have suggested that price dropping to my value is vindication of my valuation, I am not part of that group for three reasons. First, it seems skewed to celebrate only your successes and not your failures, and it behooves me to let you know that I also valued Paytm at close to ₹2000 per share, and the stock is currently trading at ₹713. Second, even if nothing in my valuation has changed, the value per share of ₹41 per share was as of July 2021, and if it is a fair assessment, the expected intrinsic value per share in July 2022 should be roughly 11.5% higher (i.e., grow at the cost of equity), yielding about ₹46 in July 2022. Finally, the company and the market have changed in the year since I last valued it, and to make a fair judgment today, the company will have to be revalued.
Company Fundamentals
In the year since my IPO valuation, there have been four quarterly reports from the company, in addition to news stories about governance and the company's legal challenges, and there is a mix of good and bad news in them.
On the good news front, the food delivery market in India has continued to grow over the last year, and Zomato has been able to maintain its market share. In fact, there are signs that the market is consolidating with Zomato and Swiggy controlling 90% of the market share of restaurant deliveries. As a consequence, Zomato's gross order value and revenues have both jumped over the course of the last year:
In addition, the substantial cash that Zomato raised on its IPO is providing it with a cash and liquidity cushion, with cash and short term investments jumping from ₹15,000 in March 2021 to ₹68746 (including short term investments) in March 2022. Since Zomato is a young, money-losing company, and the likelihood of failure acts as a drag on value, this will benefit the company, since it provides not only a cushion for the firm but also eliminates dependence on external capital for the next few years.
On the bad news front, the take rate, i.e., the slice of gross order value (GOV) that Zomato keeps has dropped substantially over the last year, reflecting increased competition in the market, higher delivery costs and Zomato's entry into newer markets (like grocery delivery) with lower revenue sharing. In addition, the growth has come in fits and starts, and given Zomato's active acquisition strategy, it is not clear how much of the revenue growth is organic and how much is acquired. Not surprisingly, the company's losses have ballooned over the last year:
While there was a management narrative of economies of scale and improved contribution margins, the end numbers don't back up either contention, with cost of goods sold rising much faster than revenues and operating and net margins both becoming more negative over the last year. (And no, you cannot add back stock based compensation and come up with an adjusted EBITDA to claim otherwise....) In addition, the Indian government put both Swiggy and Zomato on notice that they may be facing anti-trust action in the future, perhaps opening the door to more competition.
On the still-to-be-decided front, Zomato has continued on a strategy of acquiring small companies to advance its growth agenda, and while many of these acquisitions have been small, its most recent acquisition of Blinkit has raised questions about whether this growth is coming at a reasonable cost. (Again, the contention from management that this is a capital-light company that growth with little investment is not true, since these acquisitions are its true cap ex, making it a capital intensive firm.) The potential conflicts of interest in this acquisition, with a Zomato co-founder's spouse operating as the CEO of Blinkit, also add to the questions. Even if the Blinkit acquisition pans out, it is an open question whether Zomato can continue to deliver growth effectively and efficiently through this acquisition-driven strategy, using its own shares as currency, especially as it scales up. In addition, Zomato is also building a portfolio of equity positions, which do not show up as part of operating assets, and the founders rationalize this behavior by arguing that these are "the building blocks for a robust quick-commerce business in India, and will accelerate digitisation and growth of the food and restaurant industry which accelerates our core food business " (from the 2022 Q4 shareholder discussion). Even if we accept this argument for minority holdings, it will add to the complexity in the firm and make investors and traders more wary, especially in periods of uncertainty.
The Macro Factors
When I valued Zomato in July 2021, the markets (in India and globally) were in the midst of a boom, with abundant supply of risk capital and optimism about economic growth, pushing up the prices of tech companies, generally, and the youngest, most money-losing tech companies, specifically. Those circumstances no longer hold, with two big developments in global markets, both of which I have talked about in previous posts
Inflation returns: Inflation is back in almost every part of the globe, and has unsettled markets. In this post, from May 2022, I noted that financial assets (stocks, bonds) lose value when inflation is higher than expected, and that a decade of low and stable inflation has left investors exposed and vulnerable. The effects of inflation show up first as higher risk free rates, across currencies, and next in higher risk premiums, with both equity risk premiums and default spreads rising. In a follow-up post a couple of weeks later, I looked inflation's effects on individual companies and argued that less-risky companies with pricing power and high gross margins would be less exposed than riskier, money-losing companies. (I will leave it to you to judge where Zomato falls on this continuum.)
Risk Capital flees: In a post at the start of this month, I looked at how the retreat of risk capital, i.e., capital invested in the riskiest assets (from venture capital invested in start ups to investments in the riskiest collectibles) was playing out in higher equity risk premiums in mature markets, and in a later post a few days later, even bigger increases in equity risk premiums in emerging markets. As a company with the bulk of its business in India, Zomato again is more exposed to these developments.
A higher equity risk premium for India (9.08% in July 2022, compared to 6.85% in July 2021) and a higher riskfree rate in rupees (4.78% in July 2022, compared to 4.25% in July 2021) conspire to push up the cost of capital for Zomato (and other Indian companies) by about 1.5-2% from my IPO valuation.
A Zomato Revaluation
Incorporating the updated financials for Zomato (with the doubling of revenues in conjunction with larger operating losses) and the higher cost of capital, from macro developments, I revalued Zomato on July 26, 2022:
Note that my core story for the company has not changed, but its Blinkit acquisition suggests that Zomato is planning a substantial foray into the grocery delivery business (pushing up the total market size currently and in the future), albeit at the expense of a smaller slice of revenues and a smaller market share. The value per share has dropped from ₹40.79 to ₹35.32 per share, with much of the value change from last year is coming from macroeconomic developments, manifested in a higher cost of capital. For this value to be generated, the company will need to stop paying lip service to contribution margins and adjusted EBITDA, and work on reducing growth in its cost of goods sold.
An Action Plan
So, what now? As with my valuation last year, let me emphasize that this is not the valuation of Zomato, but is my valuation and it will inform my decisions on the company. I have a story for Zomato, and valuation inputs that reflect that story, but I could be wrong on both fronts, and as I did last year, I tried to capture these uncertainties in a Monte Carlo simulation:
Oracle Crystal Ball used for simulations
Allowing for the wide ranges of estimates that you can have on the total market for food (restaurant and grocery) delivery in India in 2032 and the uncertainties about Zomato's share of that market and its operating margins, you get a range of values. The median value of ₹34.12 is close to the base case value of ₹35.32, not surprising since the input distributions were centered on my base case input values, and at its current stock price (₹41.65 on July 26), the stock is still at the 70th percentile. That said a few more weeks like the last two will push the price below my median value, and if it does, I would buy Zomato, as part of a diversified portfolio (and not as a stand alone investment).
If you are a trader, you are playing a different game entirely, and Zomato's value is not part of that game. You are gauging mood and momentum, which at the moment are extremely negative for the stock, and trying to get ahead of a shift back to the positive. To make that judgment, you will be better served poring over charts, looking at price and volume movements, consulting with an astrologer, or even visiting your favored temple, church or mosque.
Conclusion
I know that some of you did buy Zomato shares in their glory days in 2021 and are either continuing to hold, hoping for a come back, or have sold, and are licking your wounds. I am sorry for your loss, but please don't attribute to conspiracies (where insiders, founders and backers play the role of villains) what can be better explained by greed, and its capacity to cloud judgment. No matter how tempted you are to blame the financial news, journalists, equity research analysts and others for your decision to buy Zomato at its heights, that decision was ultimate yours and the first step in becoming a good investor is taking ownership of your decisions. Put bluntly, if you live by momentum, you die by it. Your consolation prize is that you have lots of company in this market (from Cathie Wood at Ark to the thousands of investors who put their money in Bitcoin, NFTs and other cryptos), and this too shall pass!
It has been my practice for the last two decades to take a detailed look at how risk varies across countries, once at the start of the year and once mid-year. In most years, the differences between the two updates are small, and often ignorable, but this year's update brings significant changes for many reasons. The first is the retreat of risk capital, which I talked about in my last post, not only affects the flow of capital and repricing of the riskiest assets (high yield bonds, money losing companies) within each asset class, but also has consequences for the flow of capital across geographies, with riskier countries feeling the effect more than safer countries. The second is that this has been a consequential year for country risk shifts, with Russia's invasion of Ukraine upending risk not only for those countries, but also in the region, and tumult in Sri Lanka and Pakistan playing out as risk to investors in both countries.
Country Risk: Drivers and Measures
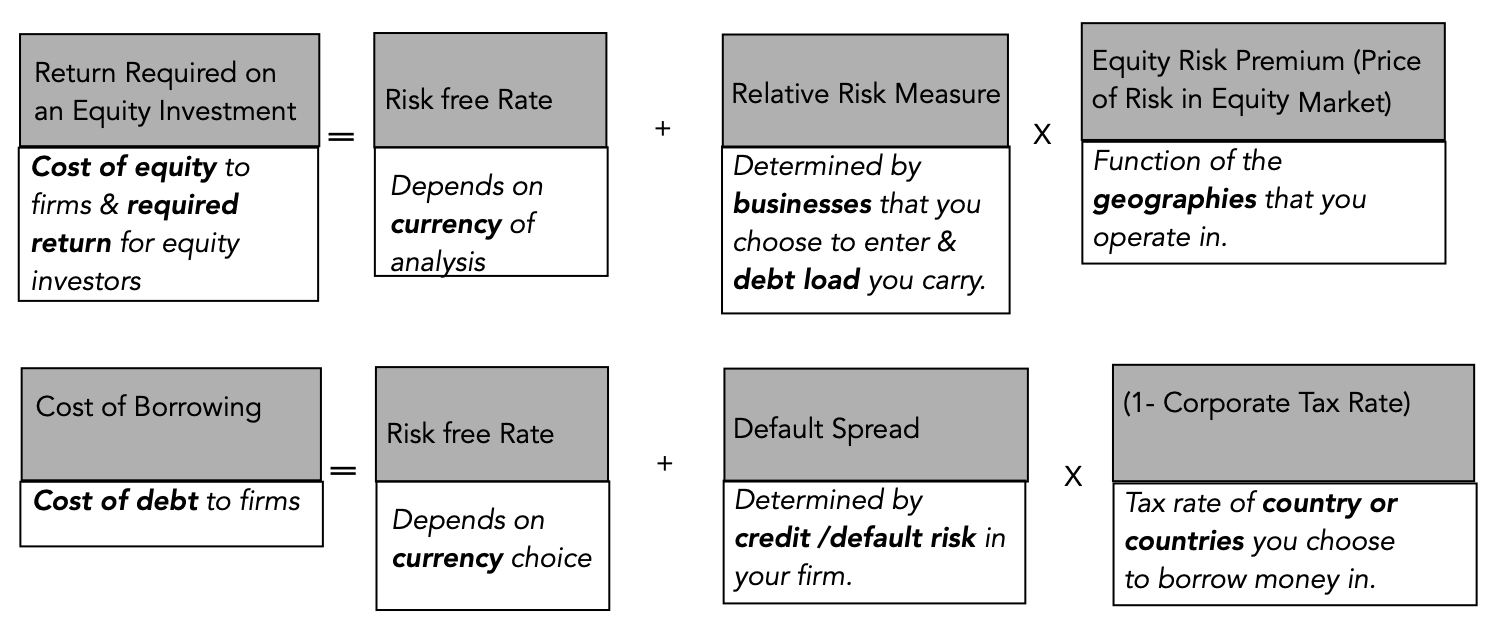
An investment in Nigeria or Turkey clearly exposes a firm or investor to more risks than an otherwise similar investment in Germany or Canada, but why? Some of the differences can be traced to the stability and growth prospects of the underlying economies, some to political and legal structures and some to geography. Rather than provide a laundry list, I attempted to summarize the four key drivers of country risk differences in the table below:
Let’s start with political structure, i.e., the extent of political freedom and democracy in a country, a sensitive topic and one that is open to subjective measurements, and draw on a democracy index score computed by the Economist Intelligence Unit (EIU) every year, with the most recent one mapped below:
As the Economist noted, a third of the world's population lived under authoritarian regimes and only 6.4% lived under full democracy, in 2021, with large differences across regions. From a business risk standpoint, though, the question of whether you would rather operate in a democracy or a dictatorship is a complicated one, with the former creating more continuous risk, as laws and regulations change, as elections often bring in new governments, and the latter more discontinuous risk, since regime changes, though less frequent, are often more wrenching and painful.
Second, a country’s risk profile can also be affected by its exposure toviolence, from war, terrorism or internal strife, and the risks that ensue to businesses that operate in its midst, I looked at differences across countries, in July 2022, drawing on work done by the Institute for Peace and Economics:
Note that the peace scores were updated to reflect the Russian invasion of Ukraine and that the world's hotspots became more violent in 2021 and 2022.
Third, corruption operates as an implicit tax, since business operating in corrupt parts of the world have to build in the associated costs and constraints. Transparency International measures a corruption score for countries, and the results of its 2021 iteration are mapped below:
Northern Europe is the standout, when it comes to being free of corruption, but corruption clearly is a drag on businesses in Latin America, Africa and much of Asia.
Finally, businesses are dependent on legal systems to enforce contracts and property rights, and legal protections vary widely across the world. I have mapped out an overall property rights score (based upon difference in physical, intellectual and legal property rights) below:
Legal protections for businesses are strongest in Australia and North America and weakest in Africa and Latin America.
While country risk has so many dimensions to it, there is correlation across the many dimensions, with corruption, poor legal protections, violence and political instability often moving in tandem. There are several services that attempt to estimate composite country risk scores, incorporating the multiple factors. One of my long-standing favorites is Political Risk Services, which measures a country risk score on a scale from 0 to 100, with lower scores indicating more risk and higher scores associated with safety:
Based on the PRS composite risk measures, Africa remains the most risky region of the world for businesses to operate in, whereas Northern Europe, North America and Australia offer the most safety.
Country Risk: Default Risk and Ratings
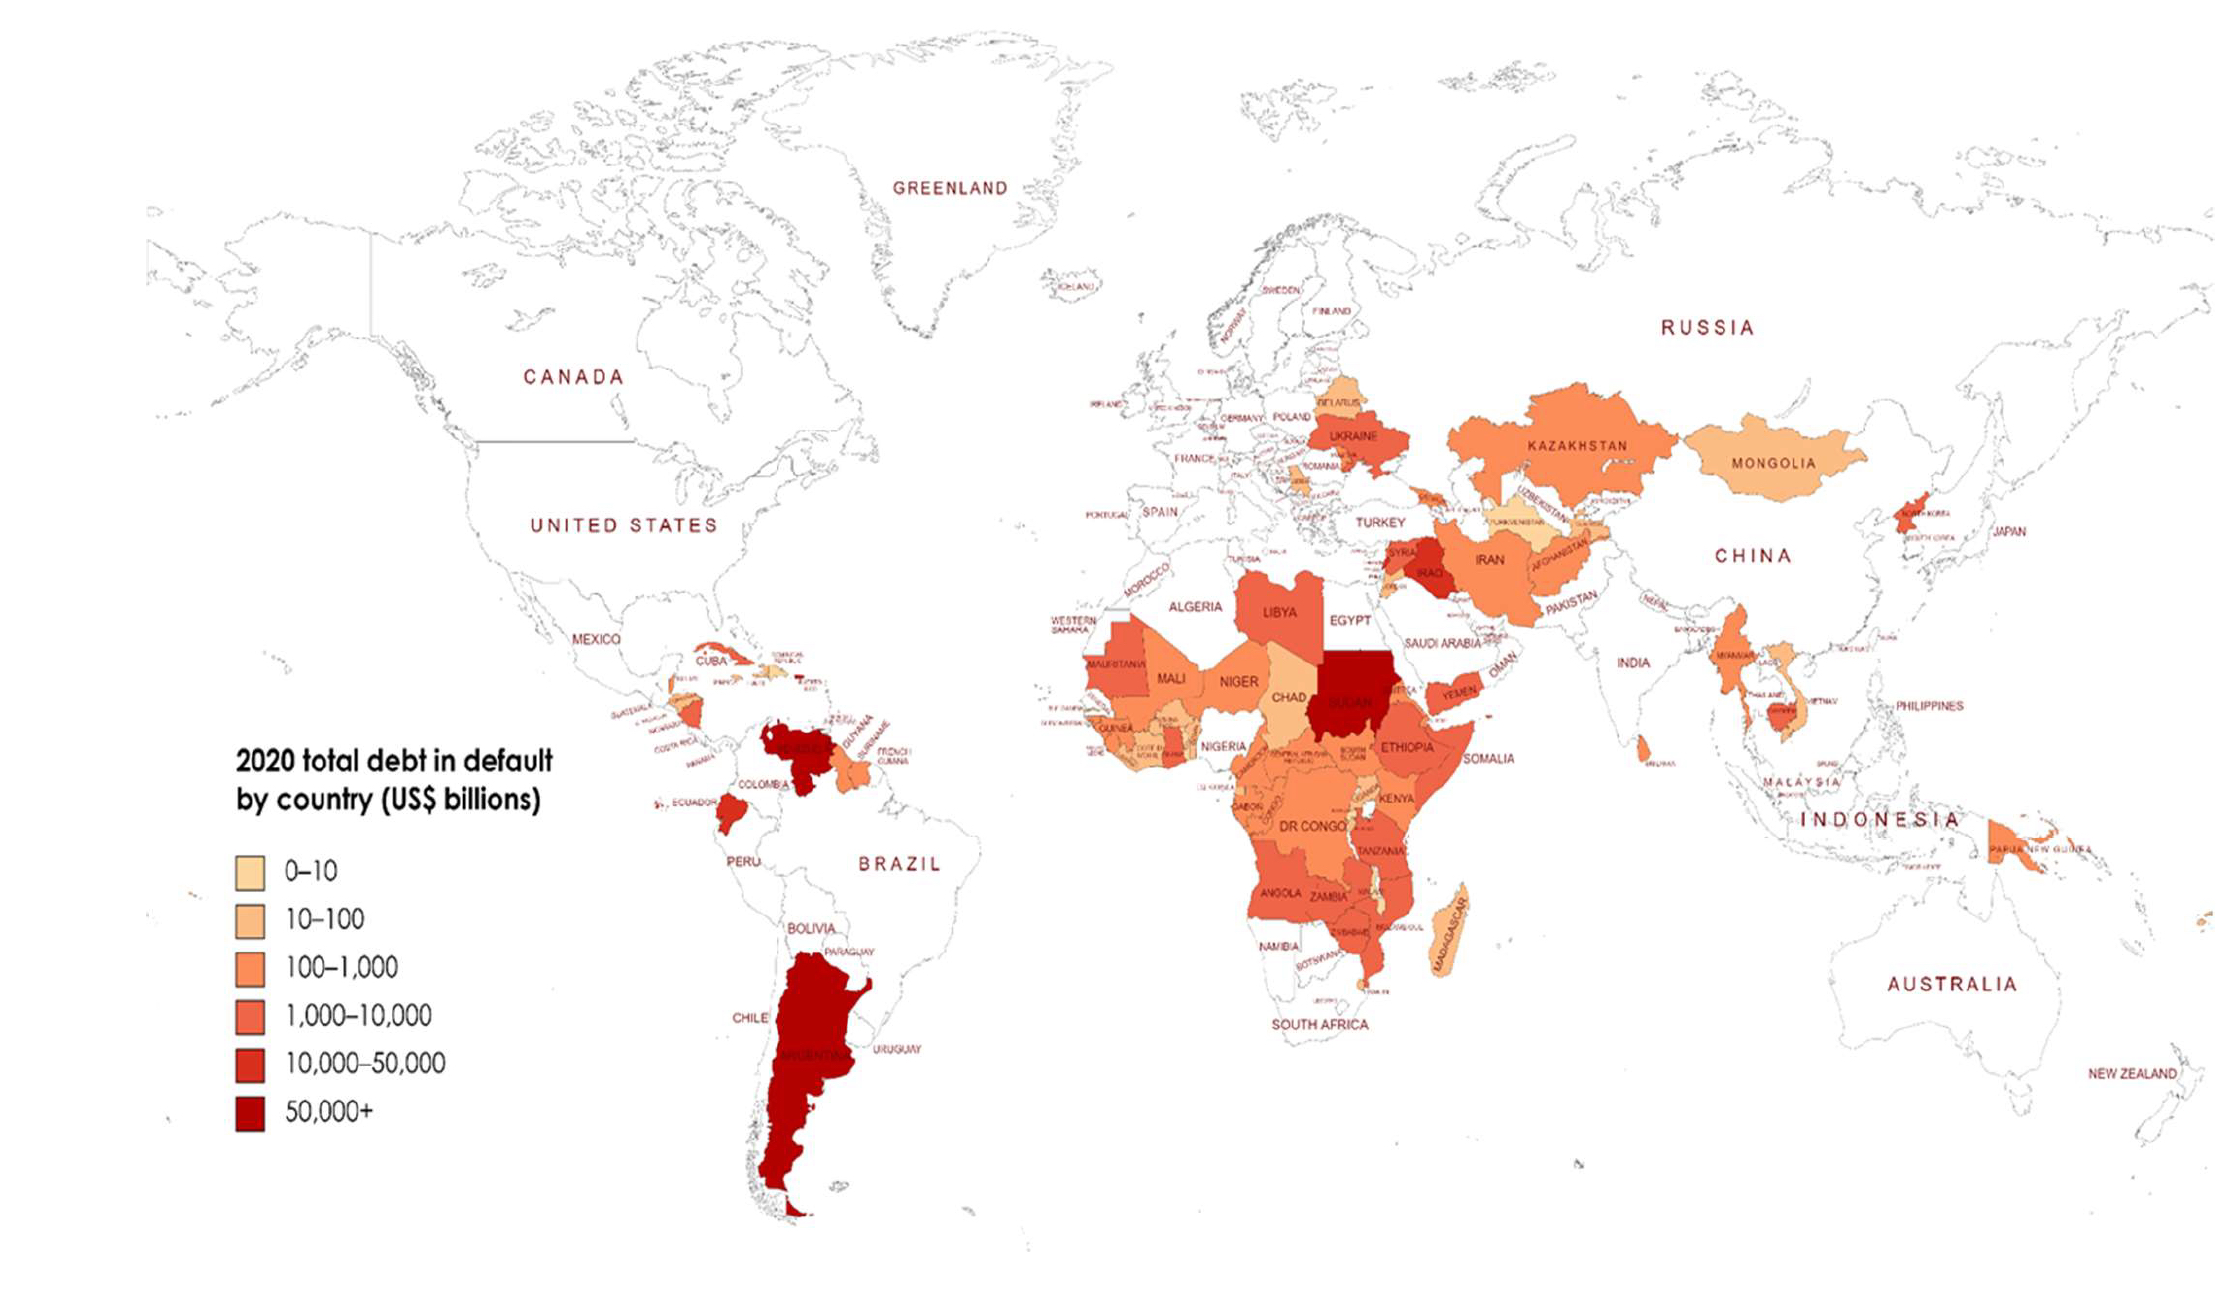
For investors, the most direct measures of country risk come from measures of their capacity to default on their borrowings. At the start of 2022, for instance, there were several countries that were in technical default, on at least portions of their debt, and the Russian invasion of Ukraine has exacerbated sovereign default concerns around the world:
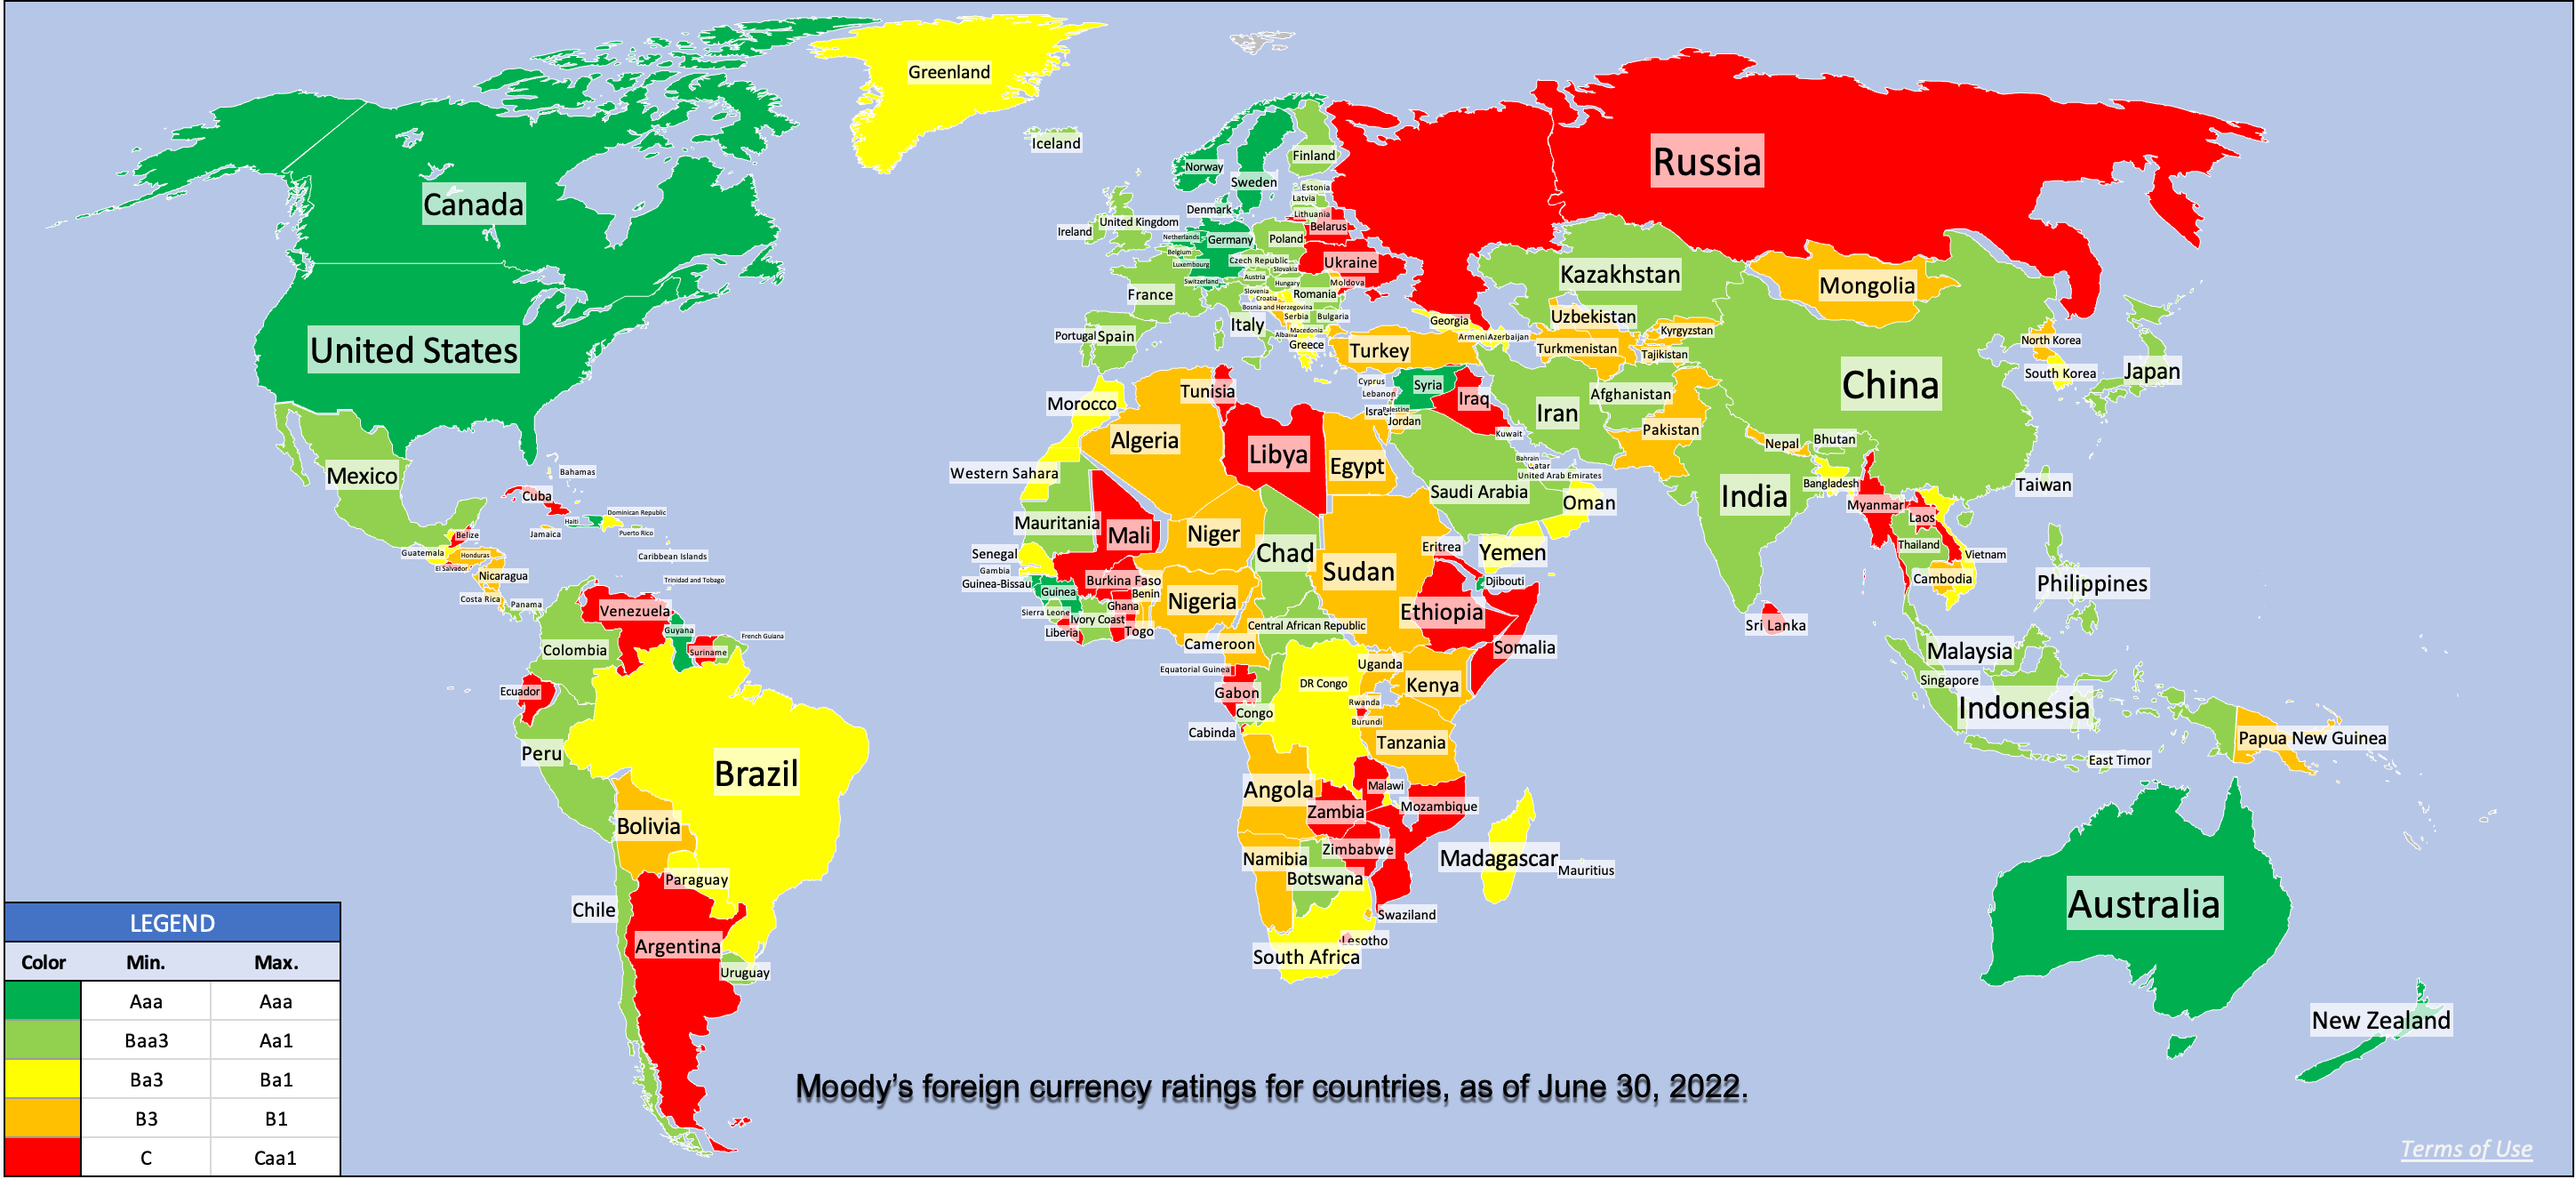
To measure sovereign default risk, ratings agencies (S&P, Moody’s, Fitch) estimate sovereign ratings for countries, designed to capture risk exposure in both local and foreign currency borrowing. The picture below reports on Moody’s ratings, as of June 30, 2022:
Note that this picture has been updated to incorporate Russia’s rating reassessment (downgraded to Ca in early April, before the rating was entirely withdrawn). I know that there are some of you, who distrust ratings agencies, arguing that they have regional and other biases and/or that they do not adjust ratings in a timely fashion. If you are in that group, the sovereign CDS market offers market-based and real-time measures of sovereign default risk, although for only 80 countries, and the map below reports the sovereign CDS spreads, as of June 30, 2022:
Source: Bloomberg
Comparing the sovereign CDS spread picture to the sovereign ratings picture, you can see the overlaps, with the ratings agencies and CDS market mostly in agreement.
Country Risk: Equity Risk
For equity investors, the price of risk is captured by the equity risk premium, and equity risk premiums will vary across countries. I use a template that starts with the implied equity risk premium that I compute for the S&P 500 and then adds on a country risk premium that is computed based upon the sovereign default spread (either from the CDS market or based upon a sovereign rating), to get equity risk premiums for countries:
The equity risk premiums that result from this assessment are shown in the picture below, with a very rough attempt to break down countries geographically. (Please do not attach any political significance to my country groupings, or take them personally. I mean no disrespect to any country, and if you feel your country has been mis-grouped, I apologize.):
If you compare the numbers in this picture to the equivalent one that I reported at the start of the year, you can see the surge in risk premiums across the board, starting with a higher base premium (6.01%, up from 4.24%) for the US and higher spreads for country risk. Looking at individual countries, the graph below summarizes the countries that saw the biggest increases in equity risk premiums (on a percentage basis) over the six months (from Jan 1, 2022 - June 30, 2022):
Not surprisingly, Russia and Ukraine make the list, with Russia's equity risk premium almost tripling and Ukraine's doubling over the period, but you can see the spillover effects into Belarus and Kyrgyzstan. There are three African countries that make the list (Namibia, Mali and Ghana), largely because of ratings downgrades, Sri Lanka's downgrade reflects the implosion of its political system and El Salvador's experiments with Bitcoin are not going well.
Country Risk: Currency and Cost of Capital
As a final part to this post, to see the shifts in country risk that we have seen in 2022, let’s start with an assessment of risk free rates. In my last post, I noted that concerns about inflation have played a big role in pushing up the US ten-year treasury bond rate from 1.51% on Jan 1, 2022, to 3.02% on June 30, 2022. That increase in interest rates is not restricted to the US dollar, as local currency government bond rates have risen around the world. In the graph below, I use these government bond rates as a starting point to estimate riskfree rates in multiple currencies, with adjustments for default risk in governments, using the sovereign default spreads from the last section:
The biggest reason for differences in risk free rates across currencies is differences in expected inflation, with higher inflation currencies exhibiting higher riskfree rates. That said, the key to dealing with currency appropriately in valuation is to stay consistent, with cash flows and the discount rates incorporating the same expectations of inflation:
In short, changing the currency that you use to value a company should not fundamentally change your assessment of that company’s value, and the reason that it often does in practice is because analysts are often sloppy in their treatment of currency, mixing growth rates in one currency with discount rates in another, and real with nominal numbers. As a general principle, to prevent double or miscounting inflation effects and risk, each input into discount rates carries a specific component, with the riskfree rate being the conveyor of expected inflation, the relative risk measure (beta for equity, bond rating for debt) measuring the business and leverage risk of the company and the equity risk premium/default spread reflecting the price of risk in markets.
The combination of rising risk free rates (not just in US dollars, but also in other currencies) and surging risk premiums (default spreads and equity risk premiums) is pushing up corporate costs of capital. In the figure below, I graph the costs of capital for US and global firms, in US$ terms, on July 1, 2022:
In January 2022, I had posted a similar histogram of costs of capital for global and US companies, reflecting risk free rates and risk premiums then, and the change, over the six months, has been extraordinary, with the median cost of capital for a US firm increasing from 5.77% to 8.97%, and for a global firm, from 6.37% to 9.70%. As I look across the many posts I have had this year on how inflation is changing market pricing and psychology, I find myself drawing on one of my favorite Bob Dylan lyrics, "the times, they are a'changin'". The biggest risk that we face, as we navigate our way through uncharted territory, is inertia, where we continue to do the things that have worked for the last decade, when we need to adapt and change.
As inflation has taken center stage, markets have gone into retreat globally, and across asset classes. In 2022, as bond rates have risen, stock prices have fallen, and crypto has imploded, even true believers are questioning what the bottom for markets might be, and when we will get there. While it is easy to call the market movement in 2022 a correction and to argue that it is overdue, it is facile, and it fails to address the question of why it is happening now, and whether the correction is overdone or has more to go. In this post, I will argue that almost everything that we are observing in markets, across asset classes, can be explained by a pull back on risk capital, and that understanding the magnitude of the pull back, and putting in historical perspective, is key to gauging what is coming next.
Risk Capital: What is it?
To put risk capital in perspective, it is best to start with a definition of risk that is comprehensive and all-inclusive, and that is to think of risk as a combination of danger (downside) and opportunity (upside) and to consider how investments vary in terms of exposure to both. In every asset class, there is a range of investment choices, with some being safer (or even guaranteed) and others being riskier.
Risk capital is the portion of capital that is invested in the riskiest segments of each market and safety capital is that portion that finds its way to the safest segments in each market.
While risk and safety capital approach the market from opposite ends in the risk spectrum, one (safety capital) being driven by fear and the other (risk capital), by greed, they need to not only co-exist, but be in balance, for the market to be healthy. When to two are not in balance, these imbalances can have profound and often unhealthy effects not just of markets, but also on the overall economy. At the extremes, when risk capital is absent and everyone seeks safety, the economy and markets will atrophy, as businesses and investors will stay away from risky ventures, and when risk capital is too easy and accessible, risky asset prices will soar, and the economy will see too much growth in its riskiest segments, often at the expense of more stable (and still necessary) businesses.
Risk Capital's Ebbs and Flows
It is a common misconception that the risk-takers supply risk capital (risk takers) and that the investors who invest for safety draw from different investor pools, and that these pools remain unchanged over time. While investor risk aversion clearly does play a role in whether investors are drawn to invest in risk or safety capital, it obscures two realities:
Variation within an investor's portfolio: Many investors, including even the most risk averse, may and often do set aside a portion of their portfolios for riskier investments, drawn by the higher expected returns on those investments. For some investors, this set aside will be the portion that they can afford to lose, without affecting their life styles in any material way. For others, it can be the portion of their capital with the longest time horizon (pension fund savings or 401Ks, if you are a young investor, for example), where they believe that any losses on risk capital can be made up over time. For still others, it is that segment of their portfolios that they treat las long shot gambles, hoping for a disproportionately large payoff, if they are lucky. The amount that is put into the risk capital portion will vary with investor risk aversion, with more risk averse investors putting less or even nothing into the riskiest assets, and less risk averse investors putting in more.
Variation across time: The amount that investors are willing to put into risk capital, or conversely redirect to safety capital, will change over time, with several factors playing a role in determining whether risk capital will be plentiful or scarce. The first is market momentum, since more money will be put into the riskiest asset classes, when markets are rising, because investors who benefit from these rising markets will have more capital that they are willing to risk. The second is the the health and stability of the economy, since investors with secure jobs and rising paychecks are more willing to take risks.
There are two macro factors that will come into play, and both are in play in markets today. The first is the return that can be earned on guaranteed investments, i.e., US treasury bills and bonds, for instance, if you are a investor in US dollar, since it is a measure of what someone who takes no or very low risk can expect to earn. When treasury rates are low or close to zero, refusing to take risk will result in returns that are very low or close to zero as well, thus inducing investors to expose themselves to more risk than they would have taken in higher interest rate regimes. The second is inflation, which reduces the nominal return you make on all your investments, and the effects of rising inflation on risk capital are complex. As expected inflation rises, you are likely to see higher interest rates, and as we noted above, that may induce investors to cut back on risk taking and focus on earning enough to cover the ravages of inflation. As uncertainty about inflation rises, you will see reallocation of investment across asset classes, with real assets gaining when unexpected inflation is positive (actual inflation is higher than expected), and financial assets benefiting when unexpected inflation is negative (actual inflation is less than expected).
And Consequences
If you are wondering why you should care about risk capital's ebbs and flows, it is because you will feel its effects in almost everything you do in investing and business.
Risk Premiums: The risk premiums that you observe in every risky asset market are a function of how much risk capital there is in play, with risk premiums going up when risk capital becomes scarcer and down, when risk capital is more plentiful. In the bond and loan market, access to risk capital will determine default spreads on bonds, with lower rated bonds feeling the pain more intensely when risk capital is withdrawn or moves to the side lines. Not only will default spreads widen more for lower-rated bonds, but there will be less bond issuances by riskier companies. In the equity market, the equity risk premium is the price of risk, and its movements will track shifts in risk capital, increasing as risk capital becomes scarcer.
Price and Value Gaps: As those of you who read this blog know well, I draw a contrast between value and price, with the former driven by fundamentals (cash flows, growth and risk) and the latter by mood, momentum and liquidity. The value and price processes can yield different numbers for the same company, and the two numbers can diverge for long periods, with convergence not guaranteed but likely over long periods.
I argue that investors play the value game, buying investments when the price is less than the value and hoping for convergence, and that traders play the pricing game, buying and selling on market momentum, rather than fundamentals. At the risk of generalizing, safety capital, with its focus on earnings and cash flows now, is more likely to focus on fundamentals, and play the investor game, whereas risk capital, drawn by the need to make high returns quickly, is more likely to play the trading game. Thus, when risk capital is plentiful, you are more likely to see the pricing game overwhelm the value game, with prices often rising well above value, and more so for the riskiest segments of every asset class. A pull back in risk capital is often the catalyst for corrections, where price not only converges back on value, but often overshoots in the other direction (creating under valuations). It behooves both investors and traders to therefore track movements in risk capital, since it is will determine when long term bets on value will pay off for the former, and the timing of entry into and exit from markets for the latter.
Corporate Life Cycle: The ebbs and flows of risk capital have consequences for all businesses, but the effects will vary widely across companies, depending on where they are in the life cycle. Using another one of my favorite structures, the corporate life cycle, you can see the consequences of expanding and shrinking risk capital, through the lens of free cash flows (and how they vary across the life cycle).
Early in the corporate life cycle, young companies have negative free cash flows, driven by losses on operations and investments for future growth, making them dependent on risk capital for survival and growth. As companies mature, their cash flows first become self sustaining first, as operating cash flows cover investments, and then turn large and positive, making them not only less dependent on risk capital for survival but also more valued in an environment where safety capital is dominant. Put simply, as risk capital becomes scarcer, young companies, especially those that are money-losing and with negative cash flows, will see bigger pricing markdowns and more failures than more mature companies.
Risk Capital: Historical Perspective
How do you track the availability and access to risk capital over time? There are three proxies that I will use, and while each has its limitations, read together, they can provide a fuller measure of the ebbs and flows of risk capital. The first is funds invested by venture capitalists, with a breakdown further into types, from pre-seed and seed financing to very young companies to capital provided to more young companies with more established business models, as a prelude to exit (acquisition or IPO). The second is the trend line in initial public offerings (number and value raised), since companies are more likely to go public and be able to raise more capital in issue proceeds, when risk capital is plentiful. The third is original bond issuances by the riskiest companies (below investment grade and high yield), since these issuances are more likely to have a friendly reception when risk capital is easily available than when it is not.
Let’s start with venture capital, the typical source of capital for start ups and young companies for decades in the United States, and more recently, in the rest of the world. In the graph below, I trace out total venture capital raised, by year, between 1995 and 2021, in the US:
Source: NVCA Yearbooks
The dot-com boom in the 1990s created a surge in venture capital raised and invested, with venture capital raised peaking at more than $100 billion in 2000, before collapsing as the that bubble burst. The 2008 banking and market crisis caused a drop of almost 50% in 2009, and it took the market almost five years to return to pre-crisis levels. In the just-concluded decade, from 2011 to 2020, the amount raised and invested by venture capitalists has soared, and almost doubled again in 2021, from 2020 levels, with venture capital raised in 2021 reaching an all-time high of $131 billion, surpassing the 2000 dot-com boom levels, albeit in nominal terms. Along the way, exits from past venture capital investments, either in IPOs or in M&A, have become more lucrative for the most successful companies, with 43 exits that exceeded a billion (the unicorn status) in 2021.
If success in venture capital comes from exiting investments at a higher pricing, initial public offerings represent the most lucrative route, and tracking the number of initial public offerings over time provides a window on the ebbs and flows of risk capital, over long periods. Using data made public by Jay Ritter on IPOs, I track the number of IPO and dollar proceeds from offerings in the graph below from 1980 to 2021:
Source: Jay Ritter
As you can see, IPOs go through hot periods (when issuances surge) and cold ones (when there are relatively few listed), with much of the last decade representing hot periods and 2000/01 and 2008/09 representing periods when there were hardly any offerings. While the number of IPOs in 2021 is still below the peak dot-com years, the proceeds from IPOs has surged to an all-time high during the year.
In the final graph, I look at corporate bond offerings, broken down into investment grade and high yield, by year, from 1996 to 2021:
Source: SIFMA
Here again, you see a familiar pattern, with the percentage of high-yield bond issuances tracking the availability of risk capital. As with IPOs, you see big dips in 2000-01and 2008-09, reflecting market corrections and crises, and a period of easy access to risk capital in the last decade. Again, the percentage of corporate bond issuances hit an all-time high in 2021, representing more than a quarter of all bond issuances. In sum, all three proxies for risk capital show the same patterns over time, pulling back and surging during the same time periods, and with all three proxies, it is clear that 2021 was a boom year.
An Update
The last two and a half years may not represent much time on a historical scale, but the period has packed in enough surprises to make it feel like we have aged a decade. We started 2020 with a pandemic that altered our personal, work and financial lives, and in 2022, at least in North America and Europe, we have seen inflation reach levels that we have not seen for decades. Looking at the 30 months through the lens of risk capital can help us understand not only the journey that markets have gone through to get where they are today, but also perhaps decipher where they may go next. In the graph below, I look at venture capital, IPOs and high yield bond issuances over the last two and a half years:
The first thing to note is that there was a pullback on all three measures in the first quarter of 2020, as COVID put economies into deep freeze and rolled markets. The big story, related to COVID, is that risk capital not only did not stay on the side lines for long but came surging back to levels that exceeded pre-COVID numbers, with all three measures hitting all-time highs in 2021. In a post in late 2020, I argued that it was the resilience of risk capital that explained why markets recovered so quickly that year, even as the global economy struggled, that year, and pointed to three explanatory factors. The first was the perception that the COVID shut-down was temporary, and that economies would come back quickly, once the immediate threat from the virus passed. The second was the decline in interest rates across the globe, with rates in developed market currencies (US $, Euro, Japanese Yen etc.) moving towards zero, increasing the costs of staying on the sidelines. The third was a change in investor composition, with a shift from institutional to individual investor market leadership, and increased globalization.
The first half of 2022 has been a trying period for markets, and as inflation has risen, it is having an effect on the availability of and access to risk capital. There has been a pullback in all three proxies for risk capital, albeit smaller in venture capital, than in IPOs and in high-yield bond issuances in the first few months of 2022. That pullback has had its consequences, with equity risk premiums rising around the world. In the graph below, I have updated the equity risk premium for the S&P 500 through the start of July 2022:
The chart reveals how unsettling this year has been for equity investors, in the United States. Not only has the implied ERP surged to 6.01% on June 23, 2022, from 4.24% on January 1, 2022, but stocks are now being priced to earn 9.03% annually, up from the 5.75% at the start of the year. (The jump in ERP may be over stated, since the forward earnings estimates for the index, from analysts, does not seem to be showing any upcoming pain from an expected recession. )
As inflation and recession fears have mounted, equity markets are down significantly around the world, but the drop in pricing has been greatest in the riskiest segments of the market. In the table below, I look at the price change in the first six months of 2022 for global stocks, broken down by quintiles, into net profit margin and revenue growth classes:
Source for raw data: S&P Cap IQ
Note that high growth, negative earnings companies have fared much worse, in general, during the 2022 downturn, than more mature, money-making companies. The fear factor that is tilting the balance back to safety capital from risk capital has also had clear consequences in the speculative collectibles space, with cryptos bearing the brunt of the punishment. Finally, there are markdowns coming to private company holdings, both in the hands of venture capitalists, and public market investors (including mutual funds that have been drawn into this space and public companies like Softbank).
The big question that we all face, as we look towards the second half of the year, is whether the pullback in risk capital is temporary, as it was in 2020, or whether it is more long term, as it was after the dot-com bust in 2000 and the market crisis in 2008. If it is the former, there is hope of not just a recovery, but a strong rebound in risky asset prices, and if it is the latter, stocks may stabilize, but the riskiest assets will see depressed prices for much longer. I don't have a crystal ball or any special macro forecasting abilities, but if I had to guess, it would be that it is the latter. Unlike a virus, where a vaccine may provide at least the semblance of a quick cure (real or imagined), inflation, once unleashed, has no quick fix. Moreover, now that inflation has reared its head, neither central banks nor governments can provide the boosts that they were able to in 2020 and may even have to take actions that make things worse, rather than better, for risk capital. Finally, at the risk of sounding callous, I do think that a return of fear and a longer term pullback in risk capital is healthy for markets and the economy, since risk capital providers, spoiled by a decade or more of easy returns, have become lazy and sloppy in their pricing and trading decisions, and have, in the process, skewed capital allocation in the economy. If a long-term slowdown is in the cards, it is almost certain that the investment strategies that delivered high returns in the last decade will no longer work in this new environment, and that old lessons, dismissed as outdated just a few years go, may need to be relearned.