Sunday, February 27, 2022

Data Update 5 for 2022: The Bottom Line!

The proverbial bottom line for success in business is the capacity to deliver profits, at least in the long term. Even though we live in an age where user platforms and hyper revenue growth can drive company valuations, that adage remains true. In fact, questions about profitability seem to have taken center place again, not only because a market pull back is a reminder that growth, by itself, cannot deliver value, but also because there are still unresolved debates about how much damage the COVID crisis did to earnings power at companies, and whether this damage has been healed, as economies have opened up. In this post, I will look at corporate profitability, in all its different dimensions, and how companies across the globe, and across industries, measured up in the most recent years. 

Measuring Profitability
    The question of whether a company is making or losing money should be a simple one to answer, especially in an age where accounting statements are governed by a myriad of rules, and a legion of number-crunchers follow these rules to report profits generated by a firm. In practice, though, measuring profitability is anything but straightforward, as accountants have devised multiple measures of profitability, reserving discretion on how to compute each one, and many different ways of scaling these profits, for comparisons.

Accounting Profit Measures
    To understand the different measures of accounting profit, let us look at how each measure of profit is computed in an income statement. In the table below, I describe four different measures of earnings in an income statement, from gross profit, the most aggregated profit measure, to net profit, the earnings left for equity investors after taxes:

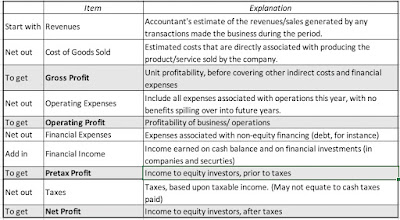
For non-financial service firms, the gross profit is a measure of what companies earn on the products/services that they sell, net of what it costs them to produce those products/services. Netting out other operating expenses, that are not directly tied to producing the goods and services (such as selling and G&A expenses), from gross profits, yields operating income. Income from financial holdings (including cash balances, investments in financial securities and minority holdings in other businesses) are added back, and interest expenses on debt are subtracted out to get to taxable income. After paying taxes on this income, the residual amount represents net income, the final measure of equity earnings, and the basis for computing earnings per share and other widely used measures of profitability used by equity investors. 
    Looking across all publicly traded companies, listed globally, and aggregating revenues on all four measures of earnings (gross, operating, taxable, net), by sector, and aggregating the numbers yields the following:

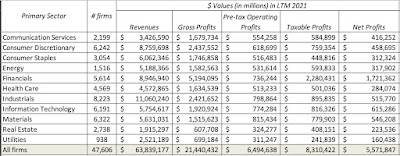
Note that for financial service firms, where debt is raw material (rather than a source of capital) and line between financial and operating assets is difficult to draw,  the only measures of income that are relevant are taxable and net income. That said, about 31% of the net profits of all publicly traded firms listed globally in 2021 were generated by financial service firms; that percent is lower in the US and higher in emerging markets. The last few years have been eventful for all companies, with the COVID crisis and ensuing economic shut down causing pain for companies, with recovery coming in 2021, as the global economy opened up again. In the table below, I report the aggregated net income, by sector, from 2017 to 2021 (with the 2021 numbers representing last twelve month numbers, through September 2021):
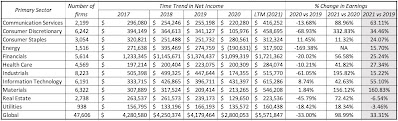
It is clear that there was substantial damage done to earnings in 2020, across sectors, with energy, consumer discretionary and industrials showing the most negative effects; across all companies, aggregated earnings declined by 15.03% in 2020. In 2021, companies recovered  entirely from the damage done in 2021, at least in the aggregate, with earnings in 2021 higher than 2019 earnings, by almost 33%. Real estate and utilities are the two sectors that have not come back fully from the COVID effect, but materials, technology and communication services are now reporting significantly higher earnings that before the shut down.

Profit Margins
    Comparing absolute profits across companies and across time can be difficult, since larger firms will generate more profits than smaller ones, all else held equal. To make comparisons, profits are scaled to common metrics, with revenues and book value of investment being the most common scalar. When profits are scaled to revenues, you get margins, and as with absolute earnings, margins come in various forms, as can be seen below:

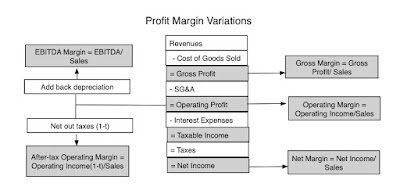
In addition to margins based upon income measures (gross, operating, after-tax operating and net), there are other margin variations, with EBITDA and after-tax operating margins coming into play. To get a sense of variation in margins across companies globally, we looked at the distribution of gross, operating and net margins in 2021:
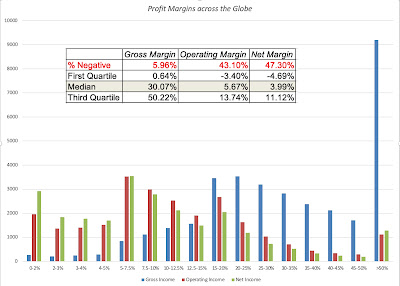
Earnings from LTM 2021, divided by revenues generated during that period
In computing operating margins, I capitalized R&D for all companies, because R&D is a capital expense, rather than an operating expense, and extended the capitalization of operating leases to all global companies. (IFRS and GAAP now treat as leases as debt, but that is still not the case in many other markets that are not covered by either standard). The numbers yield interesting insights. 
  • First, note that while less than 6% of the 47,606 firms in the sample have negative gross margins, the number is significantly higher for operating margins (43.1%) and net margins (47.3%). 
  • Second, while it is no surprise that gross margins are significantly higher than operating and net margins, the magnitude of the difference is striking; the median gross margin across all global companies in 2021 is 30.07%, but it melts down to a median operating margin of 5.67% and a median net margins of less than 4%. These margins vary widely across companies, and in the table below, we report on the statistics across sectors:


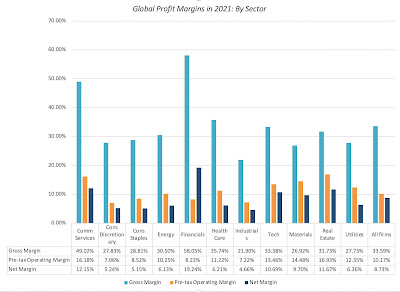
These sectors obviously are broad and each covers a range of industries. If you are interested in industry-level margins, you can find them at this link. In the graph below, I look at differences in margins across geographical regions:

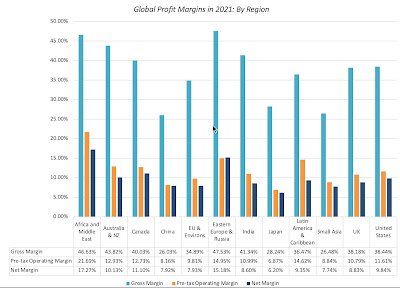
Eastern Europe (including Russia) and Africa contain some risky markets, but firms in those regions have the highest profit margins in the world. One reason is that domestic players in these markets face less foreign competition that companies in the rest of the world. The lowest profit margins in the world are in Asia, with gross margins less than 30% in China, Japan and South East Asia, but India remains an outlier, delivering higher margins. As companies from around the globe look to Asia for growth, the ensuing competition is pushing margins down there, relative to the rest of the world. 

Returns on Invested Capital (or Equity)
Scaling profits to capital invested in a company provides a different pathway to measuring profitability, with more consequential effects on value. This scaling can either be done from the perspective of just the equity investors in the company, with a return on equity, or from the perspective of all capital providers (debt and equity), with a return on invested capital:

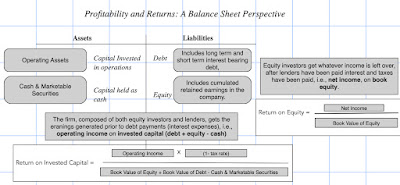
These measures are dependent on accounting estimates of not only earnings, but investment in the firm, in the form of book values of equity and invested capital, and that is their biggest weakness. To the extent that accountants mis-categorize expenses like leases and R&D, returns can be skewed, as can restructuring and one-time charges. With those caveats in place, and with my adjustments to earnings for R&D and lease capitalization, I computed the returns on equity and invested capital for all publicly traded firms at the start of 2022, using earnings in the last twelve months in the numerator and invested capital at the start of those twelve months in the denominator:

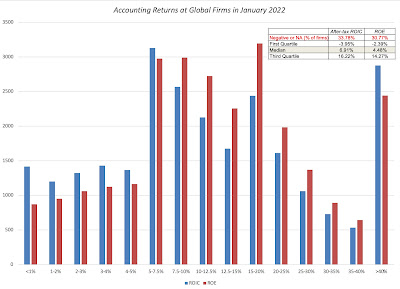
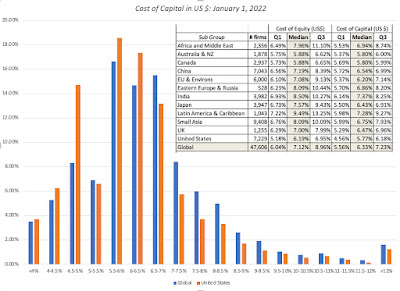
As with margins, almost a third of all firms have negative or missing accounting returns and the median return on equity, in US dollar terms, across all global firms is 4.48%, and the median return on invested capital, in US dollar terms, across firms is 6.91%. In my last post, I noted the decline in costs of capital for firms over time, noting that the median cost of capital at the start of 2022 is only 6.33%, across global firms, and argued that companies that demand double-digit hurdle rates risk being shut out of investments. That point is amplified by the accounting returns computations, since it looks like the actual returns earned by firms on their investments don't meet their own expectations. 

Implications
It is true that profitability measures, standing alone, give you only a snapshot of a company, in time, but used in context, they are conduits for almost every qualitative factor in investing, and put in a framework, a way of thinking of the value of growth and competitive landscapes. 

Business Buzz Words
Buzzwords and catchy phrases has long been part of business, with consultants and experts offering them as recipes for corporate turnarounds, and companies using them to justify everything from acquisitions to significant business course changes. While their allure is understandable, their casual usage can lead to money ill-spent and catastrophic mistakes, and I have long argued that the best way to bring discipline to decision making is to convert these buzzwords into numbers that drive value. Put simply, every action, no matter how consequential it is framed as being, can affect value in one of three ways: by changing the growth trajectory for revenues, by altering the profitability of the business model or by modifying the risk in the business. Just to illustrate, I have a looked at some of widely used buzzwords with a link to profitability: 
BuzzwordProfitability EffectReasoning
Powerful Brand NameHigher operating profit margins, relative to peer groupBrand name allows you to charge higher price for the same products.
Economies of scaleOperating margin improves as revenues increaseCosts grow at a slower rate than revenues
Superior unit economicsHigh gross marginsExtra unit costs little to produce, relative to price.
Strong competitive advantagesHigh return on capital, relative to peer groupBarriers to entry earn and sustain high returns
Canny borrowerHigh return on equity, relative to return on capitalBenefits from difference between return on capital and after-tax cost of debt.
Tax playerAfter-tax operating income is close to pre-tax operating incomeLower effective tax rate, across all income.

Note that I have steered away from the fuzzier phrases, such a "great management", which could mean everything or nothing, or "ESG", where goodness is not only in the eye of the beholder, but finding a link to anything that drives value resembles a wild goose chase.

A Life Cycle View
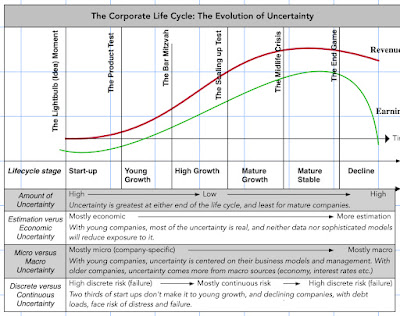
If you have been reading my posts for a while, you know that I find the corporate life cycle a useful device in explaining everything from what companies should focus on, in corporate finance, to the balance between stories and numbers, when investor value companies. Profit margins and returns also follow the life cycle, albeit with wide differences across firms:


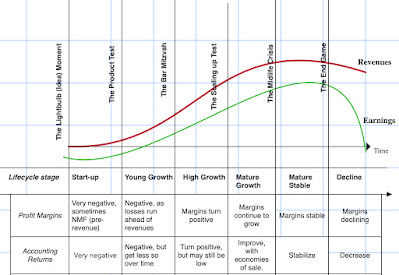
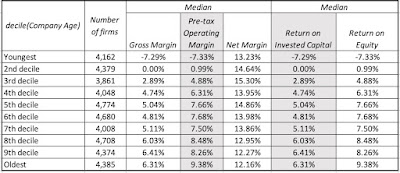
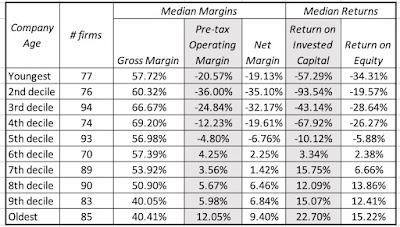
As you can see, young companies tend to be money-losers, and margins improve as companies make it through to maturity, before dropping as companies decline. Accounting returns follow a similar path, though they tend to peak a little later in the cycle, before declining in the last stages of the life cycle again. I am aware that there are many who disagree with my life cycle view of companies, but one way of testing whether it is a reasonable approximation of the real world is to look at the data. In the table below, I report on profit margins and accounting returns for firms, broken down by corporate age (measured from the founding year to 2021), across global companies at the start of 2022:
Corporate Age = Years since founding
It is just one table, but the patterns of margins/returns matches a life cycle view, low for young companies, rising as companies mature, before declining as companies age. 

The largest sector, in the US, in terms of market capitalization, is information technology and I have argued that tech companies age in "dog years", with compressed life cycles. The tech sector in the United States is composed of some companies like Apple, Microsoft, HP and Intel, which are ancient by tech company standards, and other companies like Uber, Palantir and Zoom, young and money-losing, that have gone public just in the last few years. In the table below, I break down US tech companies into age cohorts, based upon corporate age (measured from founding year), and looking at profitability measures across these cohorts, in the table below:
All companies in S&P technology sector
This table illustrates the dangers of lumping all tech companies together as high growth or money losing, since older tech companies have become the profit engines in this market, delivering a combination of high margins and accounting returns that the stars of the twentieth century, mostly manufacturing and service businesses, would have envied. It also illustrates why some value investors who have an aversion to all tech companies, often for the most meaningless of reasons (such as not having a tangible book value), have lagged the market for close to two decades.

The Value of Growth
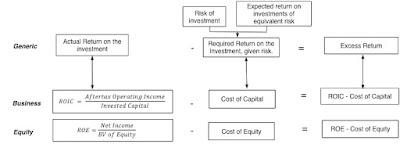
    As investor tastes have shifted from earnings power to growth, there has been a tendency to put growth on a pedestal, and view it as an unalloyed good, but it is not. In fact, growth requires trade offs, where a company invests more back into itself in the near term, denying payouts (dividends or buybacks) to its investors, during that period, for higher earnings in the future. Not surprisingly, then, the net effect of growth will depend on how much is reinvested back, relative to what the company can harvest as future growth. While a full assessment of this value will require making explicit assumptions about growth and reinvestment, there is a short hand that is useful in making this assessment, and that is a comparison of the returns that a company makes on its investments to the cost of funding those investments. If you use accounting returns as a proxy for project returns, and the costs of equity and capital as measures of the costs of funding, you can compute excess returns to equity investors, by comparing return on equity to the cost of equity, and excess returns to all capital providers, by netting cost of capital from return on invested capital:


Using the accounting returns and costs of equity/capital that I computed for all publicly traded firms at the start of 2022, I looked at the distribution of excess return measures across companies in the graph below:
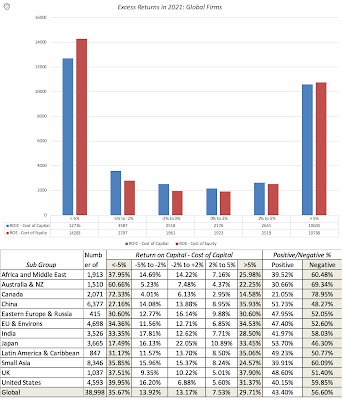
Close to 57% of firms globally earn returns lower than their funding costs, and while this may be temporary for some, it has become a permanent feature for many businesses. If you believe that the poor returns that you see in this table are a residue of COVID and economic short downs, I would suggest that you look at data that I have, on excess returns, going back almost a decade, and you will see similar results in the pre-COVID years. I will use this data to draw three broad conclusions:
  1. Low Hurdle Rate ≠ Positive Excess Returns: The notion that lower interest rates, and the resulting lower hurdle rates that companies face, has been a boon for business is clearly not supported by the facts. If anything, as rates have decreased over the last decade, and costs of capital for companies hit historic lows, companies are finding it more difficult to earn returns that exceed their costs of capital. 
  2. Good and Bad Businesses: It is an undeniable truth that some businesses are easier to generate value in, than others, and that a bad business is one where most of the companies operating in it, no matter how well managed, have trouble earning their costs of capital. Using the excess returns estimated from 2021, I estimated the excess returns (ROIC - Cost of capital) in 94 industry groups, and the ten "best" and "worst" industries, in terms of median excess return, are listed below:
    Excess Returns, by Industry (USGlobal)
    If you look at the worst businesses, there are a couple that show up every year, like airlines and hotel/gaming, where COVID exacerbated problems that are long term and structural.  The airline  and hotel businesses are broken, and have been for a long time, and there is no easy fix in sight. Biotechnology companies can claim, with some justification, that their presence on the bad business list reflects the fact that many in the sector are young companies that are a breakthrough away from being blockbuster winners and that they will resemble the pharmaceutical business (which does earn positive excess returns), in maturity. I am sure that there will be ESG advocates who will claim credit for fossil fuel and mining businesses that show up in the worst business list, but not only will their rankings change quickly if oil and commodity prices rises, but the best business of all, in 2021, in terms of delivering excess returns, is the tobacco business, not a paragon of virtue. While the technology boom has created winners in information and computer services, building-related businesses (from materials to furnishings to retail) and chemical companies also seem to have found ways to deliver returns that exceed their costs. 
  3. Disruption's Dark Side: Among the bad businesses, note the presence of entertainment, a historically good business that has seen its business model disrupted, by new entrants into the business. Netflix, in particular, has upended how entertainment gets made, distributed and consumed, and in the process, drained value from established players. While this is a phenomenon that has played out in business after business, over the last two decades, there are a couple of common themes that have emerged in the excess return data. Disruption, almost invariably, leads to lower returns for the status quo, i.e., the disrupted companies in the business, but disruptors often don't end up as beneficiaries. Consider the car business, where ride sharing has destroyed cab and traditional car service businesses, but Uber, Lyft, Didi, Grab and Ola all continue to lose money. Put bluntly, disruption is easy, but making money on disruption is difficult, and disruption creates lots of losers, but does not necessarily replace them with winners.
If I were to sum up my findings, it would be to conclude that generating value from running a business has become more difficult, not less, in the last two decades and that while there are companies that seem to have found pathways to sustainable, high earnings, most companies are involved in trench warfare, fighting disruptors and facing significantly more macro economic risk in their operations.

YouTube Video

Datasets
  1. Profit Margins, by Industry (US, Global, Emerging Markets, Europe, Japan, Australia & NZ)
  2. Return on Capital, by Industry (US, Global, Emerging Markets, Europe, Japan, Australia & NZ)
  3. Excess Returns, by Industry (US, Global, Emerging Markets, Europe, Japan, Australia & NZ)

Saturday, February 12, 2022

Back to Earth or Temporary Setback? Revisiting the FANGAM Stocks

It has been a rocky year so far, in 2022, with worries about inflation competing with hopes about recovery for the market's attention. In the midst of all the action, to no one's surprise, have been six stocks (Facebook, Amazon, Netflix, Google, Apple and Microsoft or FANGAM) that have largely driven US equities for the last decade, roiling the market with their most recent earnings reports. Netflix and Facebook saw drops of 20% or more in market capitalization, following negative earnings reports, but Amazon and Google beat market expectations. In this post, I will be valuing each of these companies, both to assess whether to invest in them individually, and to examine whether there are lessons for the market in their price entrails. 

My September 2020 Valuations

If you tally the winners and losers in the stock market sweepstakes between 2010 and 2019, it is undeniable that the decade belonged to the FANGAM stocks, as can be seen in the graph, where I chart the collective market cap of these six companies against the collective market cap of all US equities, and report on their percentage share:


Over the course of the decade (2010-2019), the FANGAM stocks increased in collective market capitalization from $719 billion from $5.07 trillion, and their share of the overall equity value of all US stocks also surged from 6.5% to 14.9%. It is not hyperbole that without these stocks, the last decade would not have been a great one for US equities. Coming into 2020 in a position of strength, these companies got stronger, as COVID rocked economies and  markets in 2020, which became the headline for one of my posts on COVID:
Between February 14, 2020 and August 14, 2020, as markets first collapsed and then recovered just as strongly, the FANGAM companies collectively added $1.39 trillion in market cap, accounting for all of the recovery in US stocks during that period. I have valued each of FANGAM multiple times in the past, but my most recent attempt to value each of them was in September 2020, as one of a series of posts highlighting how COVID was playing out in markets. I wanted to see if that surge, added on to the trillions in the market cap of US equities between 2010 and 2019, had left them in nosebleed territory, in terms of value. I must admit I was surprised by my own valuations, since, given the low riskfree rates prevailing at the time, only one stock (Apple) looked significant over valued. Of the rest, Microsoft and Amazon were over valued, albeit by modest most amounts, and Facebook was the most undervalued, and Netflix and Google were close to fairly valued.
Read post, with links to valuations, from September 2020
At the end of that post, I disclosed that I owned Facebook, Microsoft and Apple, and that I would continue to hold the first two, and would sell my Apple shares.  Clearly, much has happened since these valuations. The market has continued its march upwards, these companies have had multiple earnings reports and each of them has had newsworthy events occur. 

Updating the Numbers

In the eighteen months since I valued these companies, much has happened, to the economy, to US equities collectively, and to these six companies, in specific. In the graph below, I report on the collective market capitalization of US equities, broken down into three groupings, the FANGAM stocks, all other US tech companies and the rest of the US equity market, from August 31, 2020 to February 9, 2022:

During the period, the collective market capitalization of FANGAM stocks increased by 21.9%, but they lagged the rest of the US tech sector (up 37%) and non-tech US equities (41.1%). For the first time in more than a decade, the FANGAM stocks are running behind the rest of the market.  Breaking the FANGAM stocks into their constituent parts and charting their performance between August 31, 2020 and February 2022, here is what I get:
During this period (8/31/20-2/9/22), three of the FANGAM stocks (Apple, Microsoft and Alphabet) were up strongly, and three (Amazon, Facebook, Netflix) were down.  In summary, the FANGAM stocks were up collectively between August 31, 2020, and February 9, 2022, but they lagged the rest of the US equity market, with that underperformance isolated to Amazon, Facebook and Netflix. 

The Numbers

    Since I last valued the FANGAM stocks in September 2020, there have been six quarterly earnings reports from each of these companies, and I report on two key operating measures, revenues and operating income, in the table below, for the last three fiscal years for each of the companies. (Note that four of these companies have calendar year-ends, and two have fiscal years that end mid-year. For the latter, I am reporting on the trailing 12-month numbers, to ensure that I have the calendar year numbers.)

Looking at the percentage changes in revenues and operating income between 2019 and 2021 gives us a measure of how well each of these companies have navigated the currents of the last two years, and they seem to have turned the troubles to their advantage, posting strong compounded annual growth rates in revenues and operating income. These consolidated growth numbers, though, don't reflect the trend lines over the three years at these companies. Facebook and Netflix stumbled in their most recent earnings releases, losing more than a fifth of their market capitalization. With both companies, the user numbers were the basis for the negative surprises, with Facebook reporting its first drop in user number on a quarter-to-quarter basis as a public company and Netflix reporting underwhelming subscriber growth. Amazon and Google reported stronger than expected growth in both revenues and operating income, in the most recent quarter, and Microsoft and Apple delivered close to expected numbers. 

The News

    The FANGAM six, by virtue of their market capitalizations and their presence in our daily lives, have been also among the newsworthy of companies, and a significant portion of the news stories have are only mildly connected to current operating numbers. If I were to summarize the news about these companies in the last eighteen months:

  • Facebook and Google found themselves in the midst of both the data privacy and political partisanship debates, as politicians and regulators argued about how best to restrict the social media platforms of these companies. Google, notwithstanding a few storms around YouTube, escaped relatively unscathed, but Facebook continued to draw fire from all directions. It is worth noting, though, that Facebook's loss of half a million users in the most recent quarter may have been more attributable to Apple tightening privacy protections on its devices than government action. The most revealing news story about Facebook, though, was its decision to rename itself "Meta", in late October, and  it framed the decision as readying itself for business in the Metaverse. I argued then that the name change was a reflection of management at Facebook coming to the conclusion that its name had become too toxic, from a business perspective, and I did sell my shares in the aftermath. In hindsight, of course, this was a fortuitous decision, since it allowed me to evade the post-earnings collapse in the stock price, but it was definitely more luck than skill.
  • The big stories affecting Netflix were less about the company and more about its competitors, and one of them, in particular, Disney. During this two-year period, Disney doubled down on Disney Plus, its streaming platform, and on content production, spending more than $25 billion on content in 2021. Netflix continued its traditional path of spending immense amounts on content, with content costs reaching $17.7 billion in 2021, but its cost of acquiring users climbed, as the US and European markets matured, and new subscribers in Asia and Latin America, the two geographical areas with the most user growth potential, delivered less revenues per subscriber.
  • Apple and Microsoft, ancient companies by tech standards, continued for the most part to keep their heads down, and stay out of public controversies. In fact, Apple managed to reframe itself as a protector of privacy, putting itself on the right side of that debate, while also inflicting pain on its competitors (see Facebook above). Its new iPhone models rolled out smoothly and to generally positive reviews, a source of immense relief to a company that lives on the revenues from that product. Microsoft continued its long term path of consolidating its core product franchises (Windows and Office) and converting them to subscription businesses (with Office 365), while increasing its cloud business exposure. In the last month, the company made a splash with its announcement of the acquisition of Activision Blizzard for $68.7 billion, in an all-cash deal. While I am not a fan of acquisitions, especially big ones of publicly traded companies, there are some reasons to believe that this deal has a better chance than most of succeeding. First, at close to $70 billion, the deal looks big in absolute terms, but relative to Microsoft's market cap (of $ 2.2 trillion), it is a small deal. Second, I have to weigh in the fact that Microsoft has not been trigger-happy, when it comes to deals, and Satya Nadella has not struck me as an ego-driven CEO, at least in his public interactions. Third, I think that this deal plays into a much bigger end game, for Microsoft, than getting market share in the conventional game platform business. Finally, Activision own internal troubles had led to marking down of its stock price in the months leading into this deal, effectively reducing the actual premium paid. I know that there are some who see this acquisition as an attempt by Microsoft to squeeze Sony and Nintendo, but while that may be a side-product of this deal, I think that Microsoft has a much bigger gaming market, in mind, with much of it online, where it is competing against the other social media giants (Facebook and Google) and online game platform companies (Roblox). 
  • Of the six companies in the group, Amazon is most used to being targeted, for political and social reasons, over its entire lifetime. In addition to the stories about worker exploitation, with anecdotes about drivers not able to take bathroom breaks and overworked warehouse workers, there were questions about its competitive practices, albeit often planted by competitors whose only hope of stopping Amazon has become the government. While Jeff Bezos officially stepped down as CEO of the company in 2021, his status as one of the richest men in the world, his messy divorce and newfound standing as a globe-trotting celebrity all became news stories about Amazon. It is a testimonial to the succession team that Bezos built at Amazon that the company continued its march towards global dominance, notwithstanding all these distractions.
Valuing these FANGAM stocks reinforces the truth that valuing companies can never just be based upon the financials, since all of this news will play out eventually in the valuation stories (and valuations) of these companies.

The FANGAM Valuations: February 2022

In the trading game, where pricing is driven by mood and momentum, earnings reports and news stories are scanned for incremental news, information that ultimately will have little effect on value, but can move prices substantially. That explains the fixation with earnings per share expectations, and why seemingly trivial surprises, where a company beats or falls short of earnings expectations by a few cents can cause the market capitalization of a company to increase or decrease significantly. If you have been reading my posts, it should come as no surprise to you that I believe in intrinsic value, but I also believe that intrinsic value is driven by narrative. To me, the value effect of earnings reports and news stories comes from how they change (or don't change) the core narratives for companies. In keeping with that belief, I revisited my narratives for the FANGAM stocks, with the intent of revising these narratives, based upon what we have learned about these companies in the last two years:

Converting these stories into numbers, I revalued the six companies. You can download the full valuations by clicking here (Facebook, Amazon, Netflix, Google, Apple, Microsoft), but the summary of my key assumptions and valuations are below:

(Download full valuations of FacebookAmazonNetflixGoogleAppleMicrosoft)

At the risk of repeating some of what I have said before, here is what the valuations tell me about these companies, as investments.

  1. Facebook looks the most under valued of the six companies, but one reason is that it seems to have lost its story script. For a decade whether you liked or hated the company, the story that drove its valuation was a simple one: a platform of billions of users, about whom Facebook knew a great deal, and they then used that knowledge to deliver focused advertising. In short, this is a company that has built its business on accessing and using private data, and the privacy backlash seems to have finally led the company to try to redefine itself, first by renaming itself (Meta), and then muddying the waters about its business model. I think that the company is still a profit-generating behemoth, with some of the highest operating margins in American business, but I think that until it finds a cohesive story line, the price recovery will be stilted.
  2. Netflix is the most overvalued company in the mix, even after its major price knock down, after the last earnings report. The company has upended the entertainment business and made everyone else in the business play the game their way, but it has always been on a hamster wheel, where its primary sales pitch to investors is its capacity to keep growing its subscriber base, and the only way it can keep doing this is by spending ever-increasing amounts of money of new content. The question of how the company would get off this hamster wheel has always been there, and now that user numbers are starting to slow, and new users are becoming more costly to acquire, the challenge of doing so has become larger. 
  3. Microsoft and Apple have kept their heads low, as the rest of the FANGAM stocks have been buffeted by controversy and blowback. Apple seems to have found a way to be one of the good guys in the privacy battle, and in the process, intentionally or not, it has helped deliver punishment to others (like Facebook) in this rarefied group. For Microsoft, buying Activision advances them further towards becoming a premier platform business, and the company's diverse platforms (Office 365, LinkedIn and now Activision) offer the potential for growth and sustained high margins.
  4. Google surprised me the most, delivering high growth and increased margins, suggesting that Facebook’s problems are its own, and that Google continues to steamroll its online advertising competition. The other bets at Google continue to be cash-draining investments that deliver little in value, and after six years, I am not sure that they will be ever be big value creators, but that search box is the gift that keeps on giving.
  5. Amazon has, for much of its life, been a Field of Dreams company, offering investors a promise of revenues now, and if they wait patiently, profits in the future. For the first decades of its existence, all that investors saw was revenue growth, but margins remained slim to non-existent. In the last five years, Amazon’s margins have climbed and the company is solidifying its profit pathway, and while regulators and governments will try to rein it in, its mix of businesses and geographies will make it difficult to legislate against.
I came into the analysis holding Microsoft, and I will continue to hold it, though it is mildly over valued. If I still had Apple in my portfolio, I would also hold it, but since I don’t own it now, I have to wait for a price dip, and when it comes, I will buy it. I used to own Facebook, and while I sold it on its name-change, I will be getting back into the stock, at current prices, notwithstanding its muddled story line and near-term troubles, simply because of its cheapness. On Amazon, a stock that I have bought and sold four times over the last twenty years, I am glad to add it back to my portfolio. As for Google, I have never held it, to my regret, and don't plan to add it on, at the current stock price. Finally,  I just don’t like Netflix, even at depressed prices, since I believe that scaling down content costs, key to the company's future success, has become more difficult, not less, after the entry of Disney into the streaming wars. Needless to say, there is the broader question of the overall market, and how inflation will play out this year, but the answer to that question has a bigger effect on my overall asset allocation than on my judgment on whether to buy any of these stocks.

YouTube Video

Valuation Spreadsheets

Tuesday, February 8, 2022

Data Update 4 for 2022: Risk = Danger + Opportunity!

In the first few weeks of 2022, we have had repeated reminders from the market that risk never goes away for good, even in the most buoyant markets, and that when it returns, investors still seem to be surprised that it is there. Investors all talk about risk, but there seems to be little consensus on what it is, how it should be measured, and how it plays out in the short and long term. In this post, I will start with a working definition of riskt that we can get some degree of agreement about, and then look at multiple measures of risk, both at the company and country level. In closing, I will talk about some of the more dangerous delusions that undercut good risk taking.

What is risk?

In the four decades that I have been teaching finance, I have always started my discussion of risk with a Chinese symbols for crisis, as a combination of danger plus opportunity:

Over the decades, though, I have been corrected dozens of times on how the symbols should be written, with each correction being challenged by a new reader. That said, thinking about risk as a combination of danger and opportunity is both healthy and all encompassing. It also brings home some self-evident truths about risk that we all tend to forget:

  1. Opportunity, without danger, is a delusion: If you seek out high returns (great opportunities), you have to be willing to live with risk (great danger). In fact, almost every investment scam in history, from the South Sea Bubble to Bernie Madoff, has offered investors the alluring combination of great opportunities with no or low danger, and induced by sweet talk, but made blind by greed, thousands have fallen prey. 
  2. Danger, without opportunity, is foolhardy: In investing, taking on risk without an expectation of a reward is a road to ruin. If you are investing in a risky project or investment, your expected return should be higher to reflect that risk, even though fate may deliver actual returns that are worse than expected. Note that this common-sense statement leaves lots of details untouched, including how you measure risk and how you convert that risk measure into a higher "expected" or "required" return.
  3. It is uncertainty about outcomes, not expected outcomes, that comprise risk: In investing, we often make the mistake of assuming that risk comes from expected bad outcomes, when it is uncertainty about this expectation that drives risk.  Let me use two illustrations to bring this home. In my last point on inflation, I noted that a currency with higher inflation can be expected to depreciate over time against a currency with lower inflation. That expected devaluation in the high-inflation currency is not risk, though, since it can and should be incorporated into your forecasts. It is uncertainty about whether and how much that devaluation will be, arising from shifting inflation expectations or market-induced noise, that is risk. In posts spread over many years, including this one, I have also argued against the notion that badly-managed firms are riskier than well-managed ones, and the reason is simple. If a firm is badly managed, and you expect it to remain badly managed, you can and should build in that expectation into your forecasts of that company's earnings and value. Thus, a badly managed firm, where you expect that to be the status quo, will be less risky than a well managed firm, where there is much more uncertainty about management turnover and quality in the future.
  4. Risk is in the future, not the past: Risk is always about the future, since the past has already revealed its secrets. That said, many of our perspectives about, and measures of, risk come from looking backwards, using the variability and outcomes of past data as an indicator of risk in the future. That may be unavoidable, but we have to be clear that this practice is built on the presumption that there have been no structural changes in the process being examined, and even if true, that the estimates that come from the past are noisy predictors of the future. 
  5. Upside versus Downside Risk: If risk comes from actual outcomes being different from expectations, it is worth noting that those outcomes can come in better than expected (upside) or worse than expected. Since the entire basis of investing in risky assets is to benefit from the upside, it is downside risk that worries us, and in keeping with this perspective, there have to been attempts to derive risk measures that focus only on or more on downside risk. Thus, rather than use the variance in earnings or stock prices as a measure of risk, you compute the semi-variance, drawing on those periods where earnings and returns are less than expected. I think a more sensible path is to measure all risk, upside and downside, and think of good investing as a process of finding investments that have more upside risk than downside risk.
As someone who works in, and teaches finance, I am grateful for what the discipline has done to advance the study of risk, but I would be remiss if I did not point out that it has come with some not-so-desirable side effects. One is the tunnel vision that comes from thinking of risk purely in terms of statistical measures, with standard deviation and variance leading the way. Risk is not an abstract statistical concept, but a feeling in the pit of your stomach that emerges when you helplessly watch your portfolio melting down, as markets move in the wrong direction. The other is the dangerous notion that measuring risk is the same as managing that risk and, in some cases, the even more insane view that it removes that risk.

Risk and Hurdle Rates

    In investing and corporate finance, we have no choice but to come up with measures of risk, flawed though they might be, that can be converted into numbers that drive decisions. In corporate finance, this takes the form of a hurdle rate, a minimum acceptable return on an investment, for it to be funded. In investing, it becomes a required return that you need to make an investment; you buy investments if you believe that you can make returns greater than their expected return and you sell investments if not. In this section, I will begin with a breakdown of risk's many components and use that structure to develop a framework for assessing the risk-adjusted required return on an investment.

The Components of Risk

    In any investment, there are multiple sources of risk, and listing all of them in a list, with no organization, can be not only overwhelming but directionless. Once you have identified the risks that you face, it is useful to break that risk down into categories, on three dimensions:
As you can see from this table, not all risk is created equal, and understanding which risks to incorporate into your required return, and which risks to ignore/pass through, is the first and perhaps the most important part of analyzing risk. While you will face almost every type of risk, no matter what company that you choose to value, the risks that you are most exposed to will vary across firms, and one way of looking at this variation is to look at firms through a corporate life cycle lens:
Note that you are more exposed to more risks, when you are looking at young companies, with growth potential, than when analyzing older, more mature firms, and that a greater proportion of risks at young companies are likely to be economic, micro and discrete risks. It is no wonder that investors and analysts who collect more and build bigger models, to value young companies, expecting that they will get better valuations, find frustrations instead. To get from these general risk categories into explicit risk measures and required returns, I adopt a simple structure (perhaps even simplistic), where I accept that I am a price taker when it comes to some risks (interest rates and risk premiums) and focus on the components of risk that companies can change through their choices on business, geography and debt load:
Note that in this structure, which yields costs of equity for companies and required returns for equity investors, each component is designed to carry a single burden, with the risk free rate reflecting the currency that you analyzing the company in, the measure of relative risk capturing the risk of the company's business mix and debt load, and the equity risk premium incorporating the risk of the geographies of its operations.

1. Relative Risk Measures

    Before we embark on how to measure relative risk, where there can be substantial disagreement, let me start with a statement on which there should be agreement. Not all stocks are equally risky, and some stocks are more risky than others, and the objective of a relative risk measure is to capture that relative risk. The disagreements rise in how to measure this relative risk, and risk and return models in finance have tried, with varying degrees of success, to come up with this measure. At the risk of provoking the ire of those who dislike portfolio theory, the most widely model for risk, in practice, is the capital asset pricing model, and beta is the relative risk measure. Embedded in its usage is the assumption that the marginal investors in a stock, i.e., those large investors who set prices with their trading, are diversified, and that you can estimate the "non-diversifiable" risk in a stock, by regressing returns on a stock against a market index. I believe that a company's regression beta is an extremely noisy measure of its risk, and mistrust the betas reported on estimation services for that reason. I also believe that it is healthier to estimate the beta for a company by looking at the average of the regression betas of the companies in the sector that it operates in, and adjusting for the financial leverage choices of the company, since increasing dependence on debt also increases the relative risk of the company. As in prior years, I report industry-average betas, cleaned up for debt, at this link, for US companies, and you can sector-average beta for regional and global companies as well. At the start of 2022, the ten sectors (US) with the highest and lowest relative risk (unlettered betas),  are shown below.

Download sector average betas (US, Global)
Note the preponderance of financial service firms on the lowest risk ranks, but note also that almost all of them are substantial borrowers, and end up with levered risk levels close to average (one) or above. Technology and cyclical companies dominate raw highest risk rankings.

2. Geographical Risk

Beta measure the macro risk exposure of the businesses that a company operates in, but they are blunt instruments, incapable of capturing either country risk (from operating in the riskiest parts of the world) or discrete risk (from default, nationalization or other events that truncate a company's life). For measuring country risk, I fall back on an approach that I have used for the last three decades to estimate equity risk premiums for countries, where I start with the equity risk premium for the US and then augment that number with a country risk premium, estimated from the default spread for the country:


The equity risk premium for the US is the implied equity risk premium of 4.24%, the process of estimating which I described in an earlier data update post this year. The sovereign ratings for countries are obtained from Moody's and S&P, and the default spread for each ratings class comes from my estimates for the start of 2022. To illustrate, at the start of 2022, India was rated Baa3 by Moody's and the default spread (my estimate) for this rating was 1.87%. I scale that default spread up to reflect the higher volatility in stocks, relative to bonds, and I use 1.16, estimated from as the ratio of historical volatilities in S&P's emerging market stock to the volatility in an emerging bond indices. This approach yields a country risk premium of 2.18% for India, and an equity risk premium of 6.42%, to start 2022:

India's ERP at the start of 2022 = Mature Market ERP + Default Spread for India * Rel Vol of Equity
                                                  = 4.24% + 1.87% (1.16) = 6.42%

Using this approach to the rest of the world, here is what I get at the start of 2022:

Download country equity risk premiums
It is worth emphasizing the equity risk premium for a company will come from where it operates in the world, not from its country of incorporation. Coca Cola, notwithstanding having its headquarters in Atlanta, has exposure to risk in multiple emerging markets, and its equity risk premium should reflect this exposure. By the same token, Embraer and TCS are global firms that happen to be incorporated in Brazil and India, respectively.

3. Debt, Default Risk and Hurdle Rates

    Almost all of the discussion so far has been about equity funding and its costs, but companies do raise funds from debt. While I will use a future post to talk about how debt levels changed in 2022, across the world, I want to talk about the cost of debt in this one. Specifically, the cost of debt for a company is the rate at which it can borrow money, long term, and today, and not the cost of the debt that is already on its books. The build up to a cost of debt is simple:


A company's default spread reflects concerns that lenders have about its capacity to meet its contractual commitments, and it clearly will be a function not only of the level and stability of its earnings, but even of the country in which it is incorporated.

    As companies raise money from both debt and equity, they face an overall cost of funding, which will reflect how much of each component they use, and the resulting number is the cost of capital. The picture below illustrates the linkages between the costs of equity and debt, and how as you borrow more, the effects on cost of capital are unpredictable, pushing it down initially as you replace more expensive equity with cheaper debt, but then pushing it up as the negative effects of debt offset its benefits:


Since both the costs of debt and equity start with the riskfree rate, low risk free rates push down both costs. In my last two posts, I noted that the prices of risk have drifted down in markets, with both equity risk premiums and default spreads decreasing through 2021. It should come as no surprise then that at the start of 2022, companies across the globe were looking at costs of capital that are close to their lowest levels, in US $ terms, in decades.

At the start of 2022, the median global company has a cost of capital of 6.33%, in US$ terms, and the median US company has a cost of capital of 5.77%. (To convert these values into other currencies, use the approach that I used in the last post, of adding differential inflation to the number).

Hurdle Rate Delusions

The two biggest forces that drive corporate financial and investor decision making are me-too-ism and inertia. The former (me-too-ism) leads companies to do what others in their peer group are doing, borrowing when they are, paying dividends because they do and even embarking on acquisitions to be part of the crowd. The latter (inertia) results in firms staying with policies and practices that worked for them in the past, on the presumption that they will continue to work in the future. Not surprisingly, both these forces play a role in how companies and investors set hurdle rates. Both individual investors and companies seem to operate under the delusion that hurdle rates should reflect what they want to make on investments, rather than what they need to make. The difference is illustrated every time an equity investor, in this market, posits that he or she will not buy shares in a company, unless he or she can make at least double digit returns, or a company, again in this market, contends that it uses a hurdle rate of 12% or 15%, in deciding whether to take projects. Individual investors who demand unrealistically high returns in a market that is priced to deliver 6-7% returns on stocks will end up holding cash, and many of them have been doing so for the bulk of the last decade. Companies that institute hurdle rates that are too high will be unable to find investments that can deliver higher returns, and will lose out to competitors who have more realistic hurdle rates. In short, companies and investors, demanding double digit returns, have to decide whether they want to remain delusional and be shut out of markets, or recalibrate their expectations to reflect the world we live in. 

YouTube Video

Datasets

  1. Equity Risk Premiums, by country - January 1, 2022
  2. Betas by Sector (US, Global, Emerging Markets, Europe, Japan)
  3. Costs of Capital by Sector (US, Global, Emerging Markets, Europe, Japan)