In my early 2021 posts on inflation, I argued that while the higher inflation that we were just starting to see could be explained by COVID and supply chain issues, prudence on the part of policy makers required that it be taken as a long term threat and dealt with quickly. Not only did they not do so, but the fiscal and monetary actions they took in 2021 exacerbated inflationary pressures. By the start of 2022, the window for early action had closed and for much of this year, inflation has been the elephant in the room, driving markets and forcing central banks to be reactive, and its presence has already induced me to write three posts on its impact. In my first on May 6, 2022, I put the surge in inflation, in 2022, in historical context and argued that it is unexpected inflation that shakes up the economy and caused damage to financial assets, and that until we reached a steady state, where expectations and actual inflation converge, markets would continue to be unsettled. In a follow-up post on May 20, I looked at the disparate effects of inflation on individual companies, positing that safer companies with pricing power are more protected against inflation than riskier companies in competitive businesses. In a third post on July 1, 2022, I pointed to inflation as a key culprit in the retreat of risk capital, i.e., capital invested in the riskiest segments of every market, and presented evidence of the impact on risk premiums (bond default spreads and equity risk premiums) in markets. In terms of content, I am afraid this post will contain nothing new, but the fresh uncertainties about inflation, and its impact, that have opened up this summer require at least an updating of the numbers.
Inflation: Actual and Expected
In September 2022, there is no denying that inflation is back, and with a vengeance, though we can still debate how quickly it will fade, and to what level. The happy talk of 2021, where many policy makers and investors were dismissive of its emergence, attributing it almost entirely to the COVID recover and supply chain problems, has largely faded and a grim acceptance has set in that we have an inflation problem, the solution to which may be perhaps as painful as the problem. One reason investors and businesses are struggling with this latest bout of inflation is that they have been spoiled by a decade of low and stable inflation, and as a consequence, have neither planned for high and unstable inflation, in their business models, nor developed analytical tools to deal with that inflation. To see the inflation break in 2022, relative to history, I report on four widely used measures of inflation in the US - the consumer price index (CPI ), with & without seasonal adjustments, the producer price index (PPI) and the GDP Price Deflator below:

Source: Federal Reserve, St. Louis (FRED)

 |
| Fed Reserve, St. Louis |

On September 23, 2022, the market-imputed inflation number stood at 2.37%, the difference between the 10-year T.Bond rate of 3.69% and the 10-year TIPs rate of 1.32% on that day. It is lower than the survey-based inflation expectations, but it a long term expected inflation rate, and you can use the term structure of Treasury and TIPs rate to extract an expected inflation term structure:

Inflation’s First Order Effects: Interest Rates and Exchange Rates
Since 2008, it has become fashionable to attribute all movements in interest rates to Fed action or inaction, and as a consequence, we have lost sight of the fundamentals that determine interest rates. The most critical fundamental, and the one that best explains big movements in rates, over time, is expected inflation. For the last decade, it was not quantitative easing or Fed alchemy that kept interest rates low, but low inflation, in conjunction with anemic real growth.

As investor expectations of inflation have risen in 2022, treasury rates have risen inexorably, across the term structure:

 |
| Source: US Treasury |

Second Order Effects: Risk Capital and Risk Premia
If the only consequence of higher expected inflation was higher interest rates, the damage from it would be contained and perhaps even neutralized by earnings and cash flows growing at higher rates, aided by inflation. However, higher inflation almost always seems to be accompanied with more uncertainty about inflation, and it is this second order impact that does real damage, in terms of how it impacts risk capital. In my July 2022 post, I defined risk capital broadly as capital invested in the riskiest segments of each asset class, and used the picture below to illustrate its reach:

Note the contrast between risk capital and safety capital, and in a healthy market, you need a balance between the two, with the excess of safety capital leading to stagnant economies and markets, and an excess of risk capital creating bubbles in markets and distortions in the economy. The last decade, for better or worse, has seen an explosion of risk capital, aided and abetted by central banks and policy makers. Inflation’s return to the center stage has, at least for the moment, broken the spell, and risk capital has withdrawn significantly from markets.
- Venture capital: The VC focus on start-ups and young companies makes it a focal point of any measure of risk capital, and it has ebbed and flowed over time, with sharp pullbacks in the aftermath of the dot-com bust in 2001 and the banking crisis in 2008. The graph below updates venture capital investments, by quarter, from the first quarter of 2020 to July/August 2022:

Source: Crunchbase
Note the drop off in venture capital in the first quarter of 2022, and the even steeper decline in the second quarter suggests that this may not be a temporary retreat.

- Initial Public Offerings: The exit path for the most successful of the ventures backed by VCs is an initial public offering, and the number and dollar value of initial public offerings operates as a proxy for the availability of and access to risk capital. In the graph below, we look at the this statistic across time, updated again through 2022:

Source: Jay Ritter for historical and Pitchbook for recent IPO data Here again, the drop off in initial public offerings, both in number and value in 2022 has been dramatic, and if history is any guide, there will not be a quick comeback.

- High Yield Bonds: High yield debt has always been part of the landscape of corporate bond markets, but for much of the last century, it was composed of investment grade debt that had been downgraded, as a consequence of corporate distress. Since the 1980s, companies with low ratings have been able to make issuances of their debt, with the demand for this original issuance high yield debt coming from bond buyers willing to take on additional risk. In the graph below, I track the issuance of high yield bonds over time, with a focus on the most recent quarters:

Source: SIFMA
As with VC capital and IPOs, note the drop off in high yield debt issuances in 2022, both in dollar value terms, and as a percent of total bond issuance.

As risk capital has moved to the sidelines, the price of risk, i.e., the premium that investors demand for taking on risk has surged. You can see this in rising default spreads in corporate and sovereign bond markets, where spreads, which started 2022 at close to historic lows have risen, and more so for the lowest ratings.
 |
| Source: FRED |
In the equity market, the only immediate weapon that equity investors have for adjusting their price of risk assessment, i.e., the equity risk premium, is the stock price, pushing stock prices down, if they want higher equity risk premiums. It is for that reason that my assessments of equity risk premiums are model-agnostic and are based upon stock prices today and expected cash flows in the future being used to back out an expected return on stocks. Those assessments in the long term (1960-2021) and in the last two years (from January 2022 to September 23, 2022) are shown below:

Third Order Effects: The Economy and Psyches
The first and second order effects of inflation have been significant and damaging, but the question that remains unanswered is about the long term effects on the economy, and more importantly, on investor and consumer psyches. As you have probably noticed, perceptions of where the economy is headed have worsened, as we have gone through 2022, even in the face of relatively good news on unemployment. Much of the blame for the darkening forecasts has been directed toward Jerome Powell and the Federal Reserve, and while there is much that you can critique about how the Fed has played its cards during this crisis, it is inflation that is in the driver’s seat, not the Fed. Interest rates have risen this year because of inflation expectations rising, and it is these higher rates (and expected inflation) that are leading the Fed to act. In short, the Fed has two choices, neither of which is appealing. It can do nothing, which is the path that some of its critics would rather have it take, and interest rates will continue to rise, perhaps at an even faster rate, as inflation expectations surge. Alternatively, it can try to reclaim the narrative, by acting to slow the economy down, perhaps even putting it into a recession, with length and severity still to be determined. Rock, meet hard place!
As investors, our assessments of how inflation and the economy will evolve in the coming years will determine how much we should pay for stocks and bonds today. Having chronicled how inflation has changed the level of interest rates and the price of risk, let us bring in the remaining questions on earnings, cash flows and growth that we need to address to evaluate whether the market has under or over reacted to inflation:

- Earnings: At the start of 2022, optimism was pervasive among analysts that the economy would continue to show strength and that earnings at US companies, up almost 47% in 2021, would grow strongly in 2022 and 2023. That optimism about the economy has faded, but there has not been a concurrent drop in estimated earnings, as you can see in the table below:

Source: Factset, Ed Yardeni The earnings estimate for 2023, for S&P 500 companies, stood at 243.46, down only 0.6% from what it was on January 1. There are some subtle signs that forecasts of a recession are finding their way into earnings estimates. First, as you can see in the table, analyst estimates for what companies would generate as earnings in 2023 rose every month from January to June, but have dropped, albeit only slightly, during the summer. Second, the percentage of companies that are offering negative guidance about future earnings stood at 54%% in September 2022, suggesting that they see stormy weather ahead.
Source: Factset - Cash Flows: Investors in public equities have no direct claim on earnings, and are reliant on companies returning cash to them in dividends, and increasingly over the last few decades, in stock buybacks. The dividends paid change relatively little from period to period, making them sticky, but stock buybacks are more volatile, with sharp cutbacks during crises or when companies become more concerned about their economic futures. The table below graphs dividends and buybacks, by year, going back to 2001, and also the dividends and buybacks, by quarter, just for the last four years:
 Note the rising proportion of cash returned in buybacks, over the last 20 years, and the pullbacks in 2008/2009 and the first two quarters of 2020, in response to crises. That buyback number has largely recovered from its COVID swoon, and hit an all time high in 2021, with $734 billion in stock buybacks, across the S&P 500 companies. After rising again in the first quarter of 2022, we did see a pullback, albeit a small one, in the second quarter of 2022, with the possibility that there will be more coming in the third and fourth quarters of the year.
 - Long term inflation and interest rates: Having spent all of 2022 trying to hit a moving target on expected inflation, and the resulting interest rate, the one guarantee for the future is that there is more change coming. To make a judgment of direction, we have no choice but to take a stand on where inflation will settle in after supply chains are fixed, COVID is in the past and perhaps after the economy has cooled down. If we will revert back to inflation of 1-2%, as the market seems to believe we will, we will face a very different end game than if we revert back to 1980s levels of 3-4%.


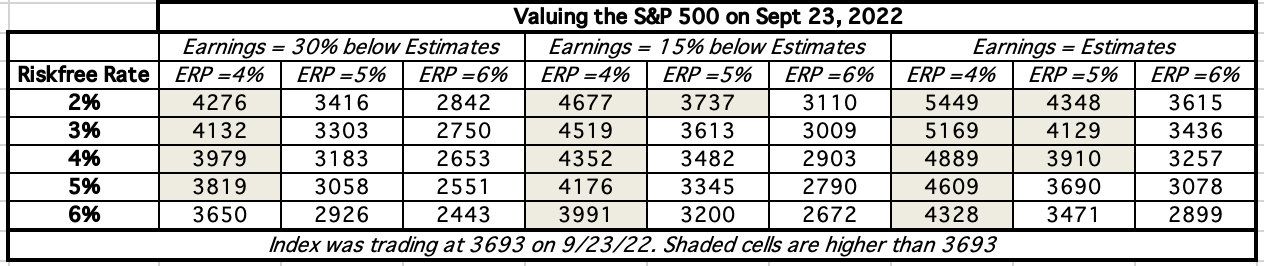
 |
| Download spreadsheet |