If 2022 was an unsettling year for equities, as I noted in my second data post, it was an even more tumultuous year for the bond market. The US treasury market, considered by some still as a safe haven, was anything but safe or a haven, especially at the long maturities, as long term rates soared, with inflation (not the Fed) being the key driver. As a result, treasury bond investors faced one of their worst years in history, losing close to a fifth of their principal, as bonds were repriced. The rise in rates transmitted to corporate bond market rates, with a concurrent rise in default spreads exacerbating the damage to investors. Just as rising equity risk premiums push up the cost of equity, rising default spreads push up the cost of debt of companies, with the added complication of higher default risk for those companies that had pushed to the limits of their borrowing capacity in a low interest-rate environment.
US Treasuries: Risk and Time Horizon
In classrooms and in wealth managers’ offices, it has been standard practice to push US treasuries and highly rated corporate bonds as safe, and even with price changes factored in, as a portfolio stabilizer, with a mix of stocks and bonds forming a “balanced” portfolio. That is good advice in most years, but 2022 was not one of those years.
US Treasury Rates and Returns in 2022
To say that 2022 was an eventful year for US treasuries is an understatement, as treasury rates, which started the year close to historic lows, soared during the course of the year.
US Treasury rates rose across all maturities, but more so at the short end of the term structure (3 months, 1 year and 2 year) than at the long end (10 year or 30 year). The magnitude of the rises were also of historic proportions, with long term rates more than doubling, and short term rates climbing above the 4% mark. As a result of these rate changes, the term structure which started the year as upward sloping, ended the year downward sloping, giving rise to the usual talk of an imminent recession. As I have argued in prior posts, I believe too much is made of this indicator, but that is a subject for a different time.
Returns in 2022
In my first classes in finance, as a student, I was taught that the US treasury rate was a risk free rate, with the logic being that since the US treasury could always print money, it would not default. Whether that is true is a debate with having, but even if you believe that there is no default risk in a US treasury, there is price risk, insofar as the price of a bond can and will move as interest changes change. In normal years, those price changes are small, and the return on a T.Bond, with coupons counted in will tend to be positive, but in years when rates move a lot, the price change effect can be considerable, with prices dropping (rising) as rates increase (decrease). Note also that the percentage price change for a given change in interest rates will be greater, for lower starting rates; an increase in the T.Bond rate from 2% to 3% will create a more negative percentage price change than an increase the T.Bond rate from 5% to 6%.
With this context, it is easy to see why US treasury bonds were hit by the perfect storm in 2022, starting the year at a historically low level (1.51%) and going up by a historically high amount (up from 1.51% to 3.88%, an increase of 2.37%). The resulting price change and total return are shown below:
For simplicity, I have assumed annual rather than semi-annual coupons and for consistency, I have kept the maturity of the bond constant at ten years rather than drop it to nine years, after a year.
The total return on a ten-year T.Bond in 2022 was -17.83%, putting it almost on par with the negative returns on stocks in 2022 (-18.01%). Since inflation was 6.42% in 2022, the real return on a US 10-year treasury bond was -22.79%.
Historical Context
In my earlier post, I noted that US equity market performance in 2022 made it the seventh worst year in stock market history, if you go back to 1928. The T.bond market performance put equities to shame, as it delivered the worst annual returns, in both nominal and real terms, in the 1928-2022 time period:
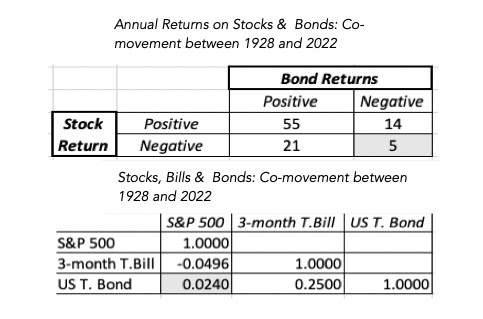
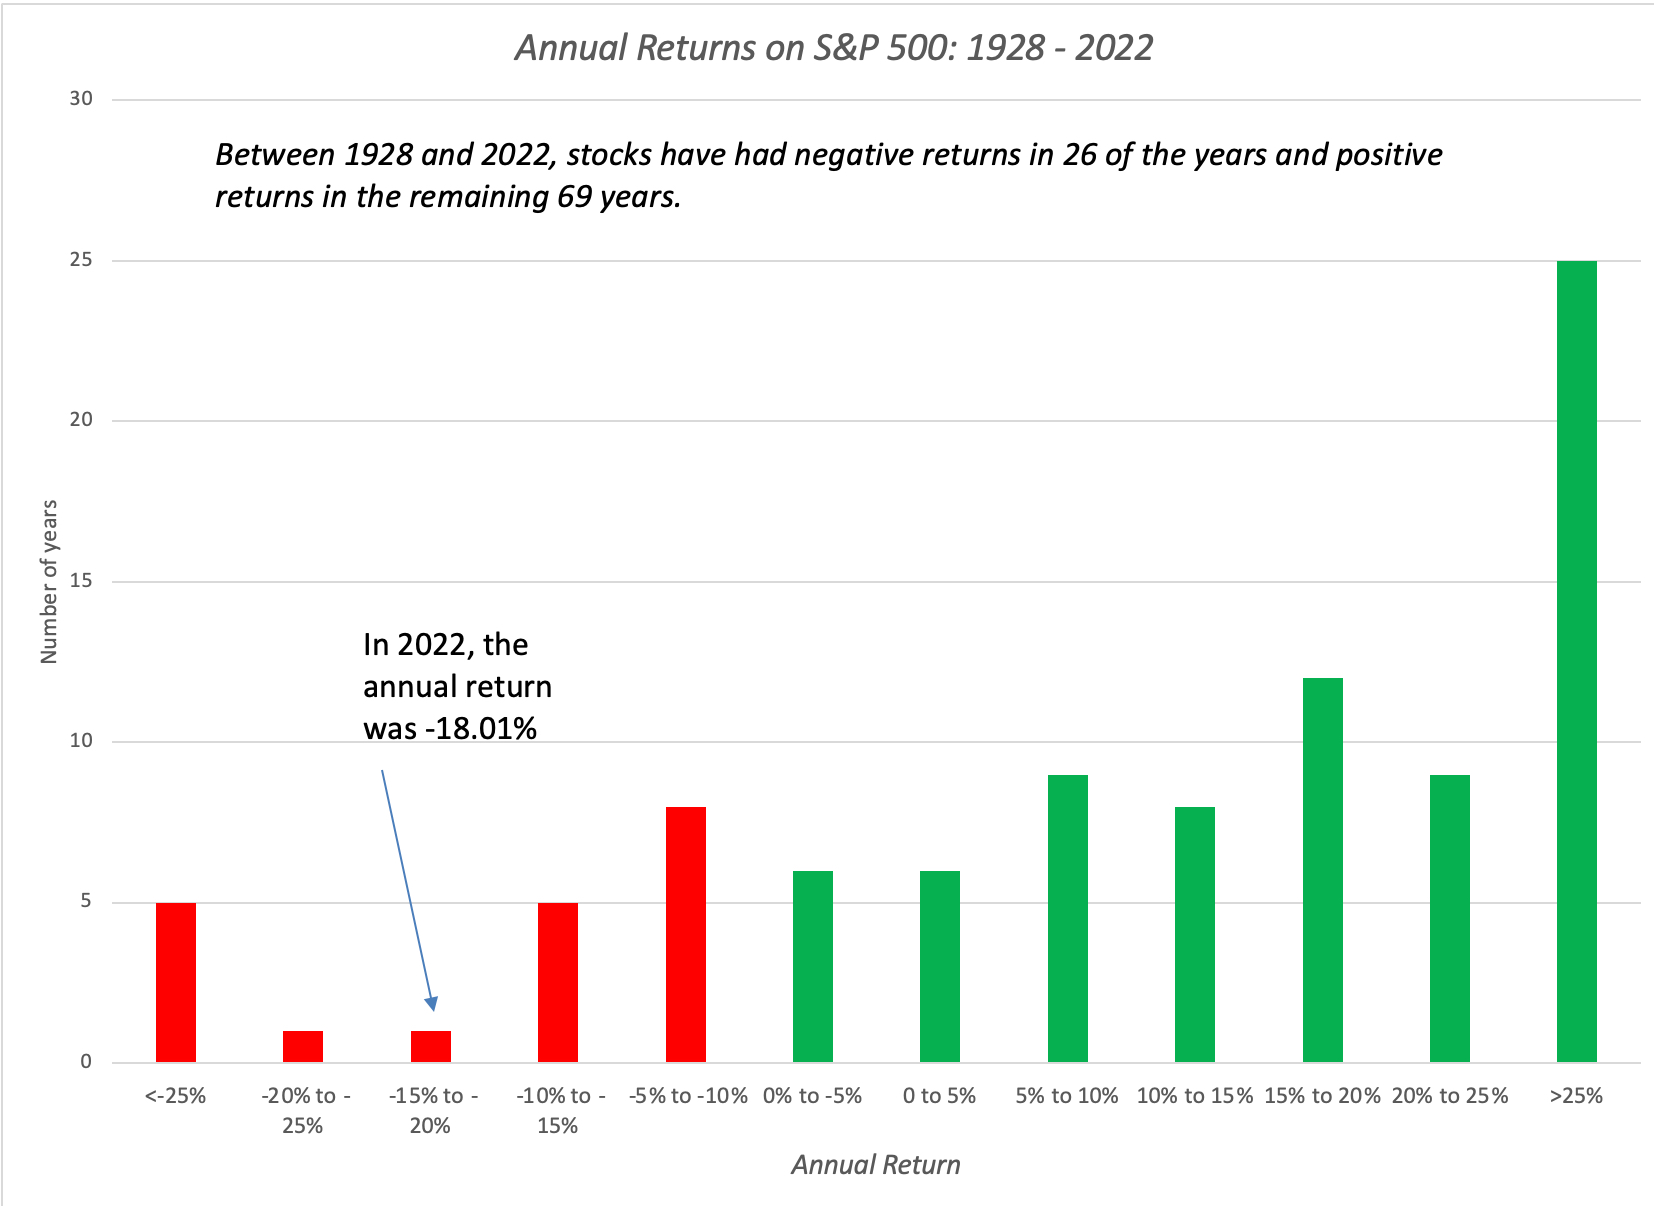
There were other measures on which the market set historical records, especially if you consider the co-performance of equity and bond markets. By themselves, stocks have had 26 negative return years in the last 95 years and, by themselves, bonds have had 19 negative returns over that period. That said, it is seldom that they have both delivered negative returns in the same year, as can be seen in the table below:
Over the 95-year period, there have been only five years where stocks and bonds have delivered negative returns in the same year, and of those five years, there has bee only one year where there were negative returns exceeding -10% in both markets, and that was 2022.
Investing is full of rules of thumb, and one of those rules that wealth managers have faithfully transmitted to their clients is the notion of a 60:40 mix in asset allocation, with 60% in stocks and 40% in bonds, backed up by the logic that this mix would deliver a more stable measure of returns over time. I will not take issue with that advice, though I find it far too rigid to work for all investor groupings, but in 2022, a 60:40 portfolio would have done little to insulate investors against risk, since stocks and bonds both delivered roughly the same returns (about -18%).
The Drivers of Interest Rates
It the question is why interest rates rose a lot in 2022, and if your answer to that question is the Fed, you have, in my view, lost the script. I know that in the last decade, it has become fashionable to attribute powers to the Fed that it does not have and view it as the ultimate arbiter of rates. That view has never made sense, because central banking power over rates is at the margin, and the key fundamental drivers of rates are expected inflation and real growth.
To immunize yourself against the Fed story, start with his graph, where I look at T.Bond rates over time, and compare them to what I term an intrinsic risk free rate, a simplistic measure obtained by adding the actual inflation rate each year to real GDP growth that year, in the US:
The mythology that it was that the Fed that kept rates low in the last decade (2011-2020) with quantitative easing and other rate gymnastics is quickly dispelled by this graph. It was the combination of low inflation and anemic growth that was at the heart of low rates, though the Fed did influence rates at the margin, perhaps pushing them down below their intrinsic levels with its machinations. As inflation has surged in the last two years, treasury bond rates have climbed, albeit at a much slower pace than inflation. That can be explained by the simple truth that it is expected inflation that is incorporated into interest rates, not actual inflation, and that expected inflation has been slow to change in the face of the inflation surprises of the last two years. In the graph below, I present one measure of expected inflation, obtained by taking the difference between the ten-year T.Bond rate and ten-year TIPs (inflation-protected treasury rate):
This "market-imputed" inflation rate has leveled out between 2-2.5% in 2022, higher than the 1- 1.5% imputed inflation of the prior decade.
If you still insist claiming that the Fed sets interest rates, it is time to face up to reality. There is no "interest rate room" in the Fed, where the Fed chair or FOMC committee, move the levers to set treasury or mortgage rates. The only rate that the Fed does set is the Fed Funds rate, and it is true that you have seen that rate jump from close to zero to just above 4% in 2022. Before you feel the urge to say "I told you so", take a look at US treasury rates (3-month and 10-year) on this graph, in relation to the Fed Funds rate, and make your own judgment on whether the rates climb after the Fed hikes the Fed Funds rate (which would you be your working hypothesis if the Fed sets rates) or if the Fed hikes rates in response to market rates going up:
You may come to a different conclusion that I do, but to me, it seems clear that the Fed (and other central banks) are following the market, not leading it, and that inflation is driving both. Just as a thought experiment, consider a world where there was no central bank or Fed, and ask yourself what would have happened to treasury bond rates in 2022, with the inflation news that was hitting markets. I will wager that you would have seen rates go up, with or without the Fed.
I do think that the Fed and other Central Banks, in the aftermath of the 2008 crisis, overcorrected and misread their mission as keeping economies afloat and financial markets booming, and in the process, they gave risk capital a false sense that it could take huge risks, without demanding sufficient premiums, and come in for soft landings. Much as we bemoan our portfolio performance during 2022, the market developments of the year are, on balance, healthy insofar as they bring risk capital back to earth. That said, I think that the fixation with the Fed is both unhealthy and counter productive. It has not only made investors passive bystanders in the great interest rate resetting, but has also given poorly performing active investors, individual and institutional, an easy excuse for their underperformance.
Corporate Bonds: Risk Plus!
As treasury bonds went on their roller coaster ride in 2022, corporate bonds could not escape the excitement, first because the rising rates on treasuries transmitted into rising corporate bond rates, and second, because default spreads, i.e., the added premium added to treasury rates when lending to riskier entities also exploded during the year.
Default Risk and Spreads
There is default risk, when companies borrow either from banks or by issuing bonds, and lenders try, sometimes well and sometimes badly, to incorporate that default risk when setting interest rates on bonds. Thus, at least in the corporate bond market, the default spread(s) become the market price of risk or risk premium for debt markets. To set the stage for what 2022 delivered in this market, it is worth noting that default spreads have been low for much of the last decade, and after a brief bout of fear in the first half of 2020, when COVID hit, approached historical lows in 2021. In short, lenders (banks and bond investors) seemed to have decided that the risk of corporate defaults had dropped and priced bonds accordingly. In 2022, that perception changed and corporate default spreads moved up during of the year:
Note again that the increase in spreads diverged across the ratings classes, in 2022, nudging up only a little across the highest ratings classes (AAA, AA), but jumping dramatically in the lower ratings (BB and below). While we have seen other years, such as 2008, where default spreads have spiked, the effect on corporate bond rates in 2022 was exaggerated by the increase in treasury rates that we pointed to in the last section. Thus, a company with an investment-grade rating (say BBB), that issued ten-year bonds would have seen the interest rate on these bonds spike from 2.71% at the start of 2022 to 5.60% at the start of 2023.
As with treasury rates, the best way to see how increasing rates affect investors is to estimate the return that investors in corporate bonds would have made, as corporate bonds rates doubled or more, during the year:
For simplicity, I have assumed annual rather than semi-annual coupons and for consistency, I have kept the maturity of the bond constant at ten years rather than drop it to nine years, after a year.
The return on a ten-year, Baa corporate bond in 2022, with the price change included would have been -23.99% in nominal terms and -31.12% in real terms, making it the worst year in at least my version of recorded history (1928- 2022) for the corporate bond market. The carnage clearly gets worse as you move to high yield bonds, where rising rates pushed down the prices of some of these bonds by 50% or more. Note that all of these calculations keep the bond rating for the company intact, as you move through 2022, but higher inflation and concerns about the economy caused some companies to be downgraded, exacerbating the damage.
Consequences for Companies
In my second post, from a little more a week ago, on my data updates for 2023, I noted that rising riskfree rates and equity risk premiums have pushed up the costs of equity for companies significantly in 2022. As the discussion in the last section should make clear, those rising rates were not restricted to equity, but also to debt, as companies ended 2023 with significantly higher costs of debt than at the start of the year. Bringing in the changes in both components, debt and equity, into the assessment, we computed the costs of capital for US and global companies in US dollar terms, in the graph below:
Just as a comparison, take a look at the equivalent table from the start of 2022:
The cost of capital for a median US (global) company rose from 5.77% (6.33%) at the start of 2022 to 9.63% (10.60%) at the start of 2023. To understand the implications of a rising cost of capital, it is worth remembering that the cost of capital is the Swiss Army knife of corporate finance, affecting almost every decision within a business, and in the graph below, I look at the implications:
Higher costs of capital, in addition to making it more difficult for companies to find new investments (projects, acquisitions), also have unpredictable effects on the mix of debt and equity used in funding (with the effect depending on whether the equity risk premiums rise more or less than default spreads) and increase the propensity of companies to return cash.
Interest Rates in 2023: Playing Prognosticator
Now that 2022 is behind us, the question that you undoubtedly have is where rates are going in 2023, and as with equity returns, I will argue that it rests almost entirely on how inflation evolves over the course of the year. If inflation stays stubbornly high, rates will stay high as well, and inflation drops precipitously, expect rates to follow them down. On the corporate bond front, the real economy will come into play. If the economy weakens, and that weakness plays out as lower earnings, there will be defaults, as companies that borrowed to the hilt, when rates were low, will now find themselves facing higher interest payments on that debt, that they may not be able to make. That will keep default spreads high, and keep corporate bond rates at their elevated levels. If the economy manages to dodge a recession, there is a strong chance that default spreads will start to drift down, especially in the low-inflation scenario,
Borrowing on the inflation/economy matrix that I used in my post on equities, here is how I see the combination of inflation and the real economy playing out in interest rates.
The Fed will spend the entire year chasing market interest rates, and market experts will spend their time watching the Federal Open Market Committee, and telling the rest of us that it is the Fed that is in charge of where rates go next. As in my assessment of equities, I believe that the Fed will add more smoke than fire to this mix, and my advice to you would be to sleep through every FOMC meeting this year and focus instead on the numbers on inflation and the real economy.
I am not much of a car person and view cars primarily as a mode of transportation. I drive a 2010 Honda Civic, a perfectly serviceable vehicle that is never going to get oohs and ahas from onlookers, but I feel no urge to value Honda. I don't own a Tesla, and have only driven someone else's Tesla, but as readers of this blog know, I valued Tesla for the first time in 2014, and I keep returning to the scene of the crime. One reason is that no matter what you think of Elon Musk and Tesla, they are never boring, and interesting companies are much more fun to value than boring ones. Another is that when valuing companies, I am, in addition to valuing a company to see if it is fairly priced, interested into the broader insights about business and valuation that emerge from the company. Thus, almost everything I know and practice, when valuing young and start-up companies, I learned in the process of valuing Amazon in the 1990s. In the same vein, I have learned a great about the power of disruption and the capacity of a young company (and its founder) to change the way a large, inertia-bound business is run, in the process of valuing Tesla. As I will note in more detail in the post, I have been wrong, and sometimes hopelessly so, in some of my earlier valuations of Tesla, but that does not stop me from trying anew. It is also true that Tesla is a company that attracts strong and very divergent views, and consequently, I get more pushback on my valuations of Tesla than on any other company, but as in last few attempts with this company, I have structured my valuation to allow you to incorporate your disagreement. My last valuation of Tesla was in November 2021, towards its market peak, and given its steep fall from grace, in conjunction with Elon Musk's Twitter experiment, it is time for a revisit.
Tesla: A Revolution Unfolds
In evaluating Tesla's climb to domination, at least in market value terms, of the automobile business, it is worth remembering how impervious this business was to disruption in the decades leading up to Tesla's arrival. In the United States and Europe, domestic competitors to the established players did not get far, largely brought down by requirements of large capital investments and a distribution system built to favor established players. When Tesla was founded in 2006, with a stated intent of building electric cars, the traditional auto companies were quick to dismiss it as a potential competitor. Tesla's rise is summarized in the graph below, where we look at the company's revenues and earnings over time, with earnings measured in gross and operating terms, and EBITDA capturing operating cash flows:
2022 numbers updated to reflect 4th quarter earnings call on 1/25/23
Between 2010 and 2020, Tesla grew revenues from $117 million to $31.5 billion, a remarkable achievement by itself, but COVID gave the company a boost, as revenue have increased about 250% in the 2020-22 time-period. Just as impressively, the company finally started delivering on its promise of profitability, going from barely making money in 2019 to an operating margin of 16.57% in 2022. While the company still has skeptics, it is no longer a niche player in a big market, and has moved the sector closer to its vision than the other way around.
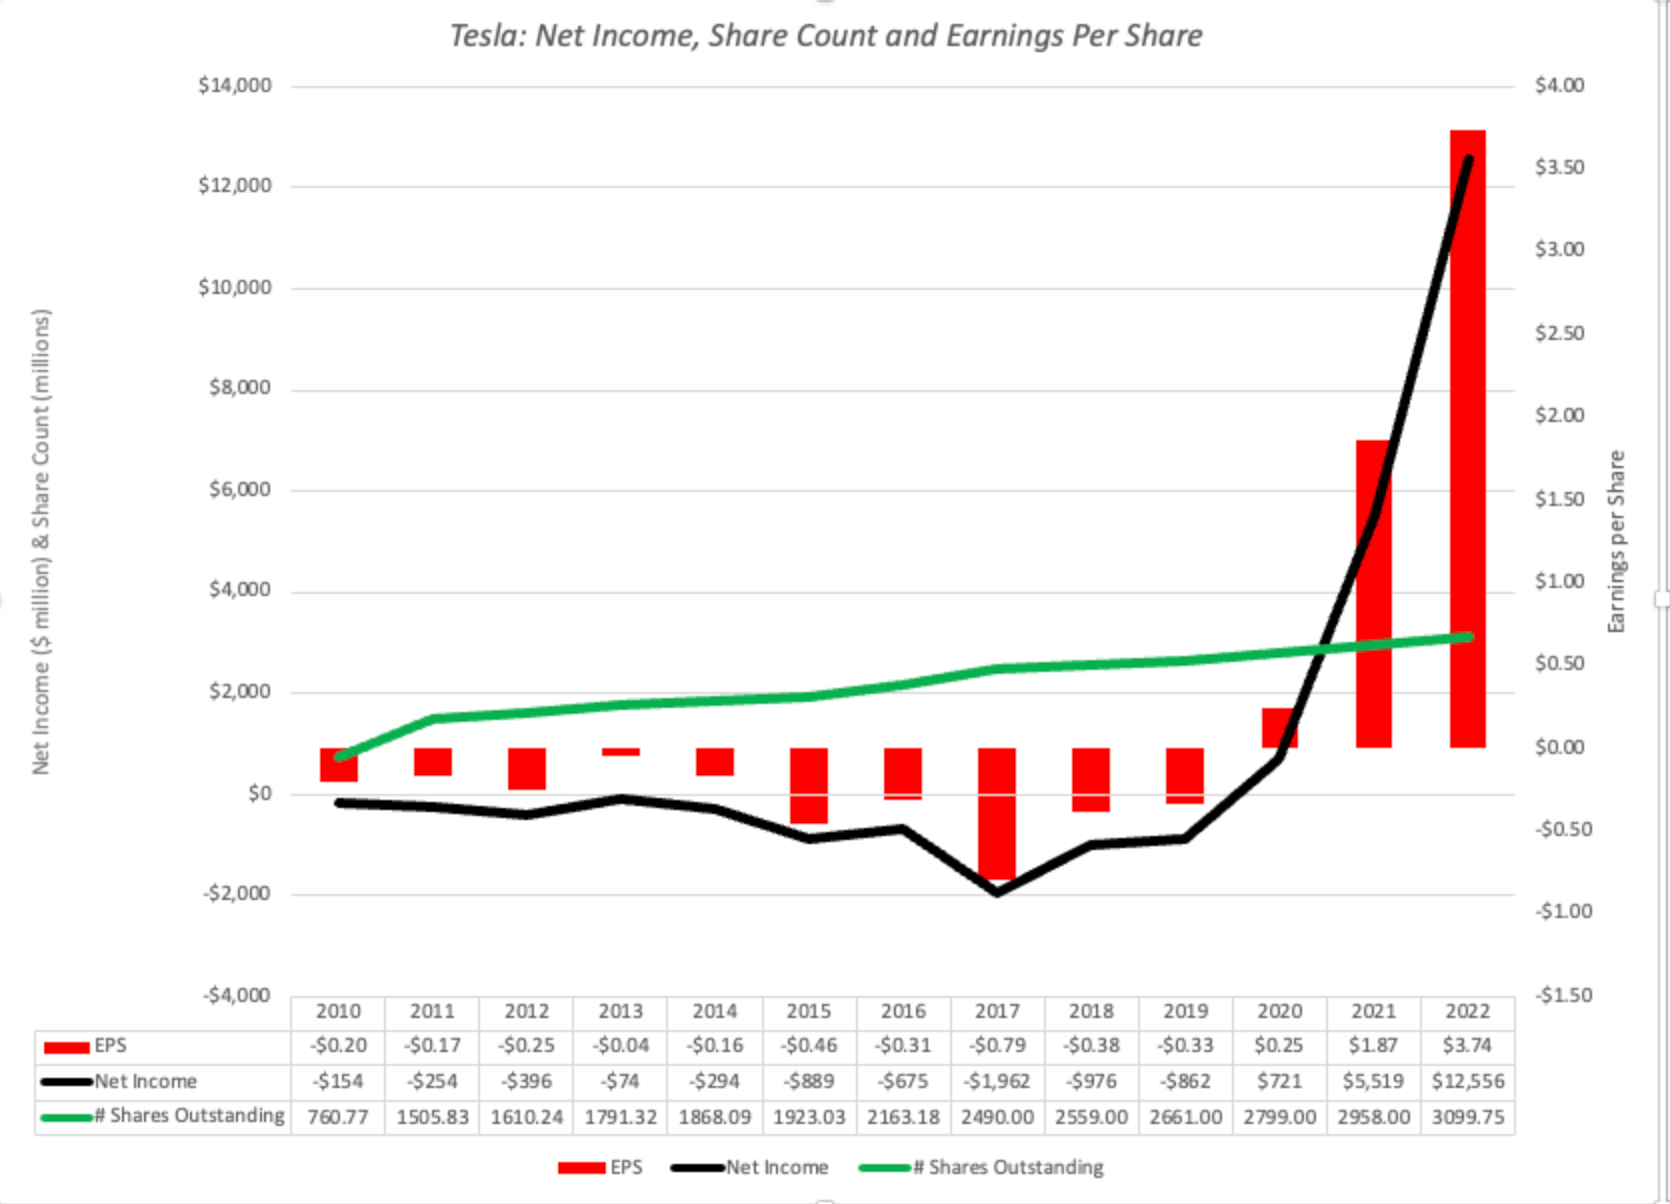
In its early years, Tesla was dependent on equity issuances for funding growth investments, and its liberal use of options to reward management (and especially Elon Musk) opened it up to criticism. Since both affect share count, I look at the company's net income and earnings per share over its public life:
2022 numbers updated to reflect 4th quarter earnings call on 1/25/23
It is true that the number of shares outstanding has quadrupled over the company's lifetime, but the good news is that the net income increases in recent years have outstripped the share count increase, with earnings per share increasing from 25 cents per share in 2020 to $3.74 per share in 2022.
My Tesla History
I have valued Tesla multiple times over the last decade, and while I have been wrong at each turn, I have tried to learn from my mistakes. In this section, I will begin by looking at the evolution of my Tesla value from 2013 to 2021, and then present my updated valuation of the company.
My Tesla Valuations over Time
My first valuation of Tesla was in 2013, and I found the company significantly overvalued then, and in hindsight, there were three errors that I made in that valuation that I systematically found myself repeating in my early valuations.
Growth potential: I underestimated the company's capacity to grow, by limiting its product reach. In my 2013 valuation, I estimated the potential revenues by assuming that Tesla was more luxury than mass-market automobile, giving it revenues of $64 billion in steady state. (It is worth noting that year 10 in that valuation would be 2023, and Tesla's revenues in 2022 were not that far off at $73 billion, albeit with more potential for growth.) Since that valuation, it is clear that the company's products reach a much broader market than I originally anticipated, and my estimates of Tesla's revenues in steady state have increased over time. In fact, in my most recent valuations, I have assumed that Tesla will not only become a mass-market automobile company over time, but that it will have a dominant market share of the electric car portion of that business.
Product characteristics: In my early valuations, I viewed Tesla cars as automobiles first and foremost, leading me towards operating margins more suited for a manufacturing company, i.e., single digit values or, at best, just barely double digits. While the experiment is ongoing, it is clear to me that an electric car is both an automobile and an electronic product, with software forming an integral part of a Tesla automobile. That recognition has led me to push margins higher, and that push has been vindicated, at least partly, by the margins the company has been able to deliver in 2021 and 2022.
Reinvestment needs: The automobile business has always been capital intensive, with companies needing to invest large amounts in new factories to be able to deliver on growth. In my early valuations of Tesla, I assumed that Tesla would have to follow the same path, and that reinvestment translated into large negative cashflows, with a concurrent need to raise new capital, in the growth years. Having watched Tesla reinvest and grow over the last few years, it is clear to me that the company's been able to generate its growth with far less money invested in plant and more in technology and R&D than a typical auto company. That recognition has led me to reduce my estimates of reinvestment at the company, using a higher sales to capital ratio as my vehicle to reflect that reduced investment need.
It was this combination of changes that led me to find Tesla to be under valued in June 2019, in the aftermath of Musk's "funding secured" fiasco and stories of cars being built in tents since the company ran out of capacity in its plants. I did buy the stock at the time of that post, and luck was my ally since I caught it at its bottom ($180 per share in 2019 or $12 per share in today terms), though I did sell the shares in January 2020, after the price quadrupled.
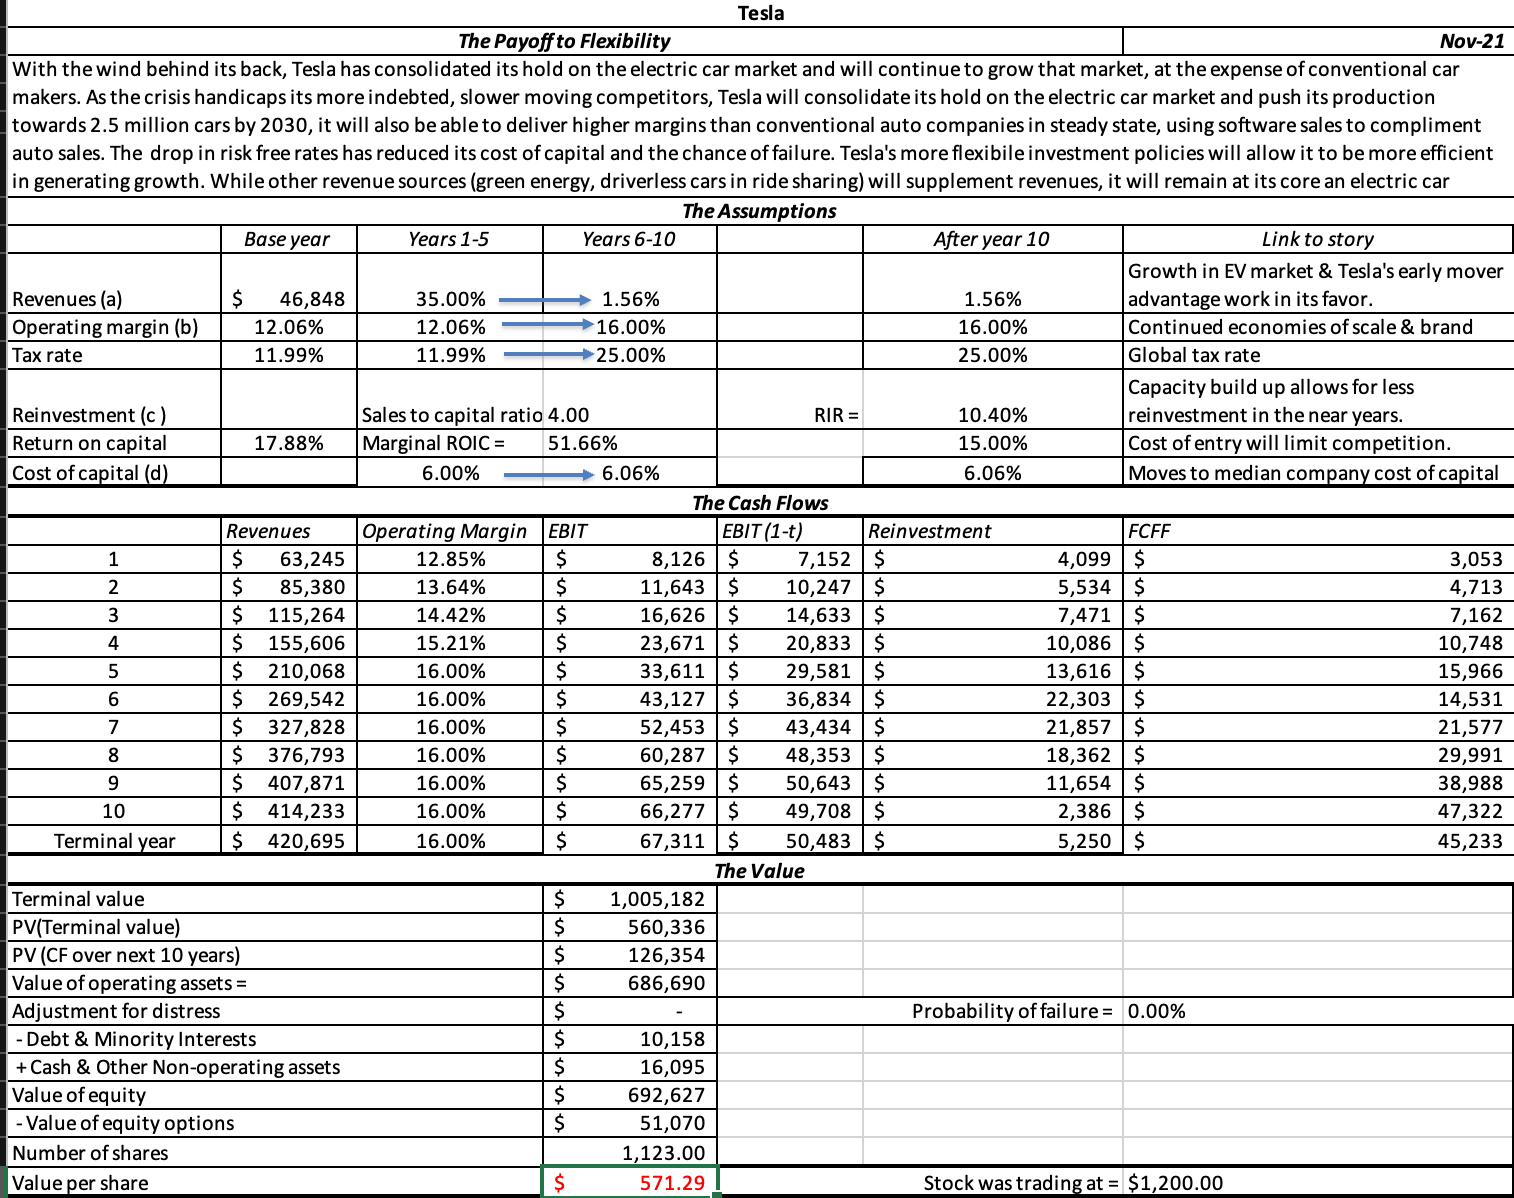
With the benefit of hindsight, I clearly timed my sale wrong, because right after my sale, COVID hit and the company used its adaptability to take advantage of tumultuous times. The company's stock price soared (reaching $1200/share in November 2021 ($410 in today's terms), and when its market cap breached a trillion, I revisited my Tesla valuation then, using a do-it-yourself (DIY) structure to allow readers to disagree. Pushing every one of my assumptions to its limits, the best I could do was arrive at a value ($571) roughly half of what it was trading at then ($1200+), about $190/share in current share units. My November 2021 best-case valuation is shown below:
I argued that I could see almost no plausible pathway to get to Tesla's market cap then and that I believed that the company was over valued.
A Valuation Update
It is a year and two months since my last valuation of Tesla, and it has been an eventful period for the company, Elon Musk, its founder/CEO and the overall market:
The Company: At the company level, even as earnings reports delivered progress towards scaling up and becoming more profitable, there have been questions about whether the pathway is becoming more rocky. In its report on the first quarter of 2022, Tesla beat analyst estimates for both revenue growth and profit margins, but acknowledged COVID-related production problems in its Shanghai plant. In its earnings report from the second quarter of 2022, Tesla reported a slowing of revenue growth to 25% (from the heated pace of 2021) and a decline in margins that it attributed to inflation and competition for EV components. The 2022 third quarter report included news that revenues would come in below analyst estimates, both in dollar value and number of cares. The fourth quarter earnings report, delivered yesterday (January 25) confirmed earlier reports of slowing growth and a decrease in profitability (gross and operating), due to supply chain problems, with the company providing guidance that its pricing cuts will put pressure on future margins.
The Founder Effect: In all of my valuations of Tesla, I have emphasized that it is a personality-driven company, with Elon Musk representing the company's vision and driving or perceived to be driving its decisions. In fact, in my November 2021 post on Tesla, I explicitly noted that it is almost impossible to value Tesla without bringing in your view of Musk into the valuation:
Until recently, even Tesla critics would have conceded that Musk, in spite of his numerous faults, was a net positive to the company. In the last year, even Tesla advocates have starting questioning that belief, partly because Musk's Twitter adventures seem to be taking up much of his time, leaving a perceived vacuum at the helm of the company. That may be an overreaction, and I am not quite ready to come to the conclusion that he is net negative for the company, but it is undeniable that the net Musk effect being negative is not being dismissed. There is also the question of whether Musk will come under pressure to sell Tesla shares to meet demands from Twitter lenders, and how that will play out in markets.
The Market: The US equity market in January 2023 looks very different from the market at the start of 2022. As I noted in my last post, rising risk free rates and equity risk premiums have pushed up the costs of equity for all companies, and Tesla is not only no exception but is perhaps even more exposed as an above-average risk company. In short, the cost of capital of 6% that I used in November 2021, higher than the median cost of capital of 5.6% for US companies then, no longer is defensible, as the median cost of capital has climbed toward 9.6%.
With these changes in mind, I revisited my valuation of Tesla from November 2021 and made the following changes:
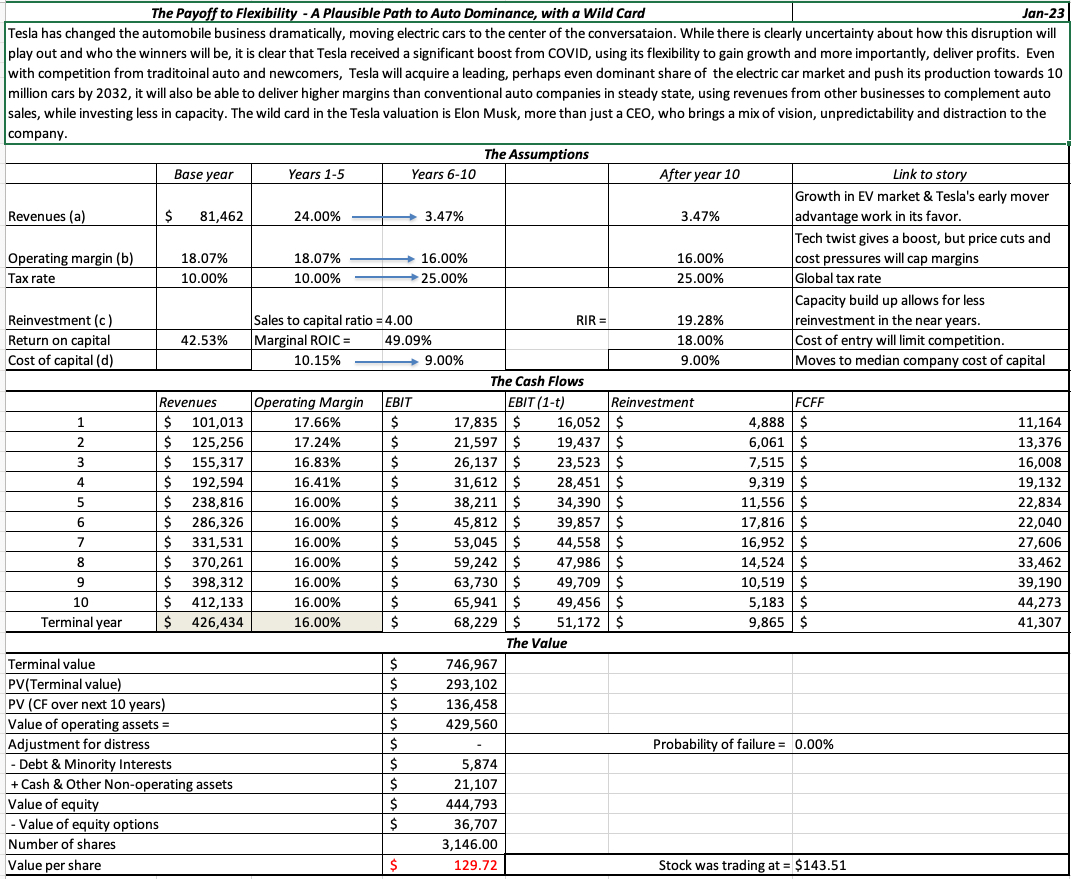
First, I left my end revenues for Tesla back to $400 billion, still a reflection of my view that electric cars will become the dominant part of the auto market, and that Tesla still has not only a lead in that market, but will have a significant market share. In fact, Tesla's revenues of $81 billion in 2022 makes this assumption more plausible, not less so Note that this will still give Tesla more revenues than the largest automobile companies in the world, and will require that they make a transition, at least on core models, to a mass market product (with prices to match). I know that Tesla does and can sell more than just cars (energy solutions and software), but these are businesses that, at best, can add tens of billions of dollars to the mix, not hundreds.
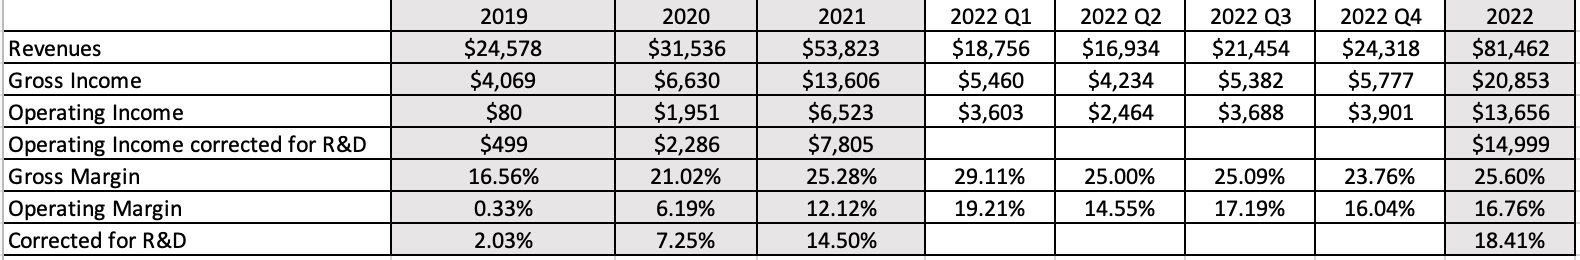
In my November 2021 valuation, I had chosen a target operating margin of 16%, higher than the then-prevailing margin of 12.06%. In 2022, Tesla delivered an operating margin of 16.76% before correcting for R&D, and 18.41% after the correction, though its performance varied widely across the four quarters:
While Tesla's profitability in 2022 has been a pleasant surprise, I have left the target margin at 16% because the forces that pushed the operating margin back down to 16% in the last quarter of 2022, which include price cuts and increasing production costs at their plants, will only intensify as Tesla seeks out market share. There is a niche market story that can be used to justify higher operating margins at Tesla, but that story would be incompatible with it having revenues of $400 billion.
Third, my cost of capital for Tesla has jumped to 10.15%, reflecting a world of higher interest rates and risk premiums:
This is still an upbeat story, but the value per share that I get with these updated inputs is about $130, a mark down from my November 2021 valuation, and about 10% below the stock price ($143 on January 25, 2023)
As with my previous valuations of Tesla, I am open about the fact that my Tesla story and inputs come with uncertainties, significant and potentially value-changing. Rather than wring my hands about these mistakes or be defensive about them, I chose to run a simulation, replacing my point estimates for revenue growth, operating margins and cost of capital, with distributions to arrive at the following value distribution
Note that my median value is slightly lower than my base case value, mostly because there are more potential upside values than downside value. The bottom line, though, is that the median value, at $120, confirms that the stock is overvalued, at least based on my estimates, at least at its stock price of $143. However, unlike November 2021 or at other points in Tesla's life, the stock is very much in play, and anyone who bought the stock on 12/27/22, when the price hit $109, would have got a reasonable bargain. I am writing this post, in the aftermath of Tesla's earnings report, and the stock is up in the after market, perhaps in reaction to the fact that the company beat its earnings per share forecast, the least meaningful part of any earnings report. To be honest, there is nothing that I see in that report, which is still barebones, that would lead to fundamentally reassess Tesla's value, but clearly the earnings per share beat and the "news is not as bad as it could have been" effect is clearly playing out in Tesla's pricing.
Lessons for Investing
When valuing companies, it is important that you focus on the task at hand, which is to value a company and make an investment judgment on whether you should buy or sell the company, but it is also productive to look for general lessons that you can use in valuing other companies in the future. The Tesla valuation offers me a chance to examine bigger questions including how much a personality (Musk in the case of Tesla) can affect value, when the laws of business catch up with even the most successful disruptors and finally, and most depressingly, how politics has entered investing and business decisions in ways that we will come to regret.
1. Personality-driven Companies
In entertainment, sports, politics and business, we live in a personality-driven world, where individuals are given more attention than institutions. This is not a new phenomenon, but social media has furthered this trend, by giving influential people platforms and megaphones to reach tens of millions of followers. Some of the highest profile corporations in the last decade have tied their business stories to their founders, making it difficult to separate one from the other. In many cases, this has helped, not hurt, these companies, as Jack Ma drew investors and customers to Alibaba with his enthusiasm and energy, and no one sold Tesla to customers and investors better than Elon Musk. In both cases, though, we are discovering that there is a downside to personality-driven companies, since as human beings, these personalities come with good and bad qualities. There is no doubt in my mind that Elon Musk has enough vision to power a dozen companies, but he is also easily distracted and sometimes eccentric, but that is the package that drew people to the company a dozen years ago, when the company was started, that engineered its ascent to trillion-dollar market cap status, just a couple of years ago, and is now, at least in the eyes of some, weighing down the company.
Good founders find ways to build businesses that outlast them, as Bill Gates did at Microsoft and Jeff Bezos at Amazon, but that required them to set aside egos and to overcome their desire for control. With Tesla, I still believe that Musk's vision is critical, but it is essential for Tesla's long term success that he takes two actions. The first is to stop being the spokesperson for the company on all things small and large, and allow others in the company to find their voices. The second is to either build a management team that can run the company without him, if that team does not exist, or if it does, to give more visibility and front-stage status to the members of that team. I will wager that many investors in Tesla would be hard pressed to name its CFO or others in its top ranks, and that is an indication of how completely Musk has dominated the Tesla conversation.
2. The Universal Laws of Business and Economics
When looking at businesses, it is worth remembering the business rules that have always governed success and failure, and recognize that while there are some companies that can deviate from these rules for a period of time, they eventually find themselves subject to them. I capture these business rules in what I call my valuation triangle, shown below:
Put simply, most businesses that want to grow faster have to accept that this higher growth will come with more risk (because it will require entering riskier geographies or marks segments), will need more investment in capacity (to be able to deliver on that growth) and often require accepting lower operating margins (because you may have to cut prices to sell more). For most of the last decade, Tesla has seemed to be impervious to these rules, showing a capacity to deliver revenue growth with rapidly rising margins in a competitive electric car business, and doing so with far less reinvestment than other automobile companies.
That said, though, there are indications that the company, while still delivered wondrous results, is finding itself coming back to earth. The recent report that the company plans to cut prices for its cars in the United States may be a transitory change in policy, but it is more likely a reflection of the reality that customers, for whatever reasons, are now willing to at least look at other carmaker's offerings, if the price is right. In the same vein, the challenges that Tesla is facing in its manufacturing plants and with supply chains are familiar problems that all manufacturing companies face, and reflect the fact that it it Tesla no longer a niche company with absolute pricing power, selling to a fanatically loyal customer base. My guess is that the stories, while more negative than positive, will even out over time, and that Tesla will be able to stay ahead of its competitors, but for those investors and analysts who are used to Tesla posting super normal performance, it may take time to stop treating normal performance as a negative surprise.
3. Everything is political
In a world where where you shop, to where you eat and even which sports teams you cheer on depend on which side of the political divide you fall on, is it any surprise that politics is now affecting business and investing choices as well? It is one reason why I have argued against bringing ESG into companies and investing, because there is almost no social issue that an ESG-measuring service can defensibly bring into a score, without a backlash. In the case of Tesla, the politics of the moment are undeniably an issue, and I would argue that where your political views will have more of an effect on whether you think Tesla is under or over valued than any of its operating numbers. It is amusing to see Tesla advocates become adversaries overnight, mostly because their politics have diverged from Musk's, and Tesla opponents become its defenders, because they are in political agreement with Musk. As should be clear from my many posts on Tesla, I fall in the muddled middle when it comes to Musk. I believe that he is a visionary, not so much because Tesla is at the cutting edge of technology, but because he has changed the automobile business and our driving choices fundamentally. There are qualities that I admire in him, and qualities that I do not, but I think that as a society, we are better off with him than without him. That said, I would like to think that my decisions on whether to buy or sell Tesla will be unaffected by my personal views on Musk, but that may be just my delusion speaking.
It is the nature of stocks that you have good years and bad ones, and much as we like to forget about the latter during market booms, they recur at regular intervals, if for no other reason than to remind us that risk is not an abstraction, and that stocks don't always win, even in the long term. In 2022, we needed that reminder more than ever before, especially after markets came roaring back from the COVID drop in 2020 and 2021. While there are many events during 2022, some political and some economic, that one can point to as the reason for poor stock returns, it is undeniable that inflation was the driving force behind the market correction. In this post, I will begin by chronicling the damage done to equities during 2022, before putting the year in historical context, and then examine how developments during the year have affected expectations for the future. I will follow up by looking at the mechanics that connect stock prices to inflation, and examine why the damage from higher inflation can vary across companies and sectors.
Stocks: The What?
We invest in equities expecting to earn more than we can make on risk free or guaranteed investments, but the risk in equities is that actual returns can deviate from expectations. In some years, those deviations work to our benefit and in others, it can hurt us, and 2022, unfortunately, fell into the latter column. In this section, I will begin with a deconstruction of stock returns in 2022 and the year's place in stock market history. I will then provide a template for estimating expected returns on equities, and examine how expected returns changed during the course of the year.
Actual Returns
Your returns on equities come in one of two forms. The first is the dividends you receive, while you hold stocks, a cash flow stream that provides a measure of stability to investors who seek it. The other, and less predictable component, is the price change, which in good years adds to the return as a price appreciation, and in bad years, often overwhelms dividends to deliver negative returns.
The Year in Review
At the start of 2022, the S&P 500 was at 4766.18, up from 3756.07 at the start of 2021. During the course of 2022, the index was staggered by political events, with Russia's invasion of Ukraine upending global economies, and by inflation, which entered the year high, and continued on that path through the course of the year. The graph below shows the S&P 500 at the end of each month, from December 31, 2021 to December 31, 2022, and the resulting monthly returns:
Aggregating over the entire year, the index declined 19.42% in 2022, and while the dividends during the course of the year rose, the dividend yield of 1.41% provided only a minor offset, resulting in total returns of -18.01% on the S&P 500 for the year:
I know that this is US-centric and large-cap oriented and I will cover returns in other geographies and across broader classes of stocks in my next few posts, but suffice to say, that in this year, there were no sectors or geographies that were spared.
And in historical context
It is undeniable that 2022 was a bad year for stocks, but in historical context, how bad a year was it? I maintain a database of historical returns on stocks, bonds, bills and other asset classes on my webpage, and I looked at the annual returns, by year, starting in 1928 through 2022 for US stocks. In the graph below, I look at the distribution of annual returns over those 95 years, paying special attention to the negative years:
S&P 500 officially came into existence in 1957, but we filled in earlier years using stock return data
As you can see, it is not uncommon for stocks to have negative years, but the returns in 2022 of -18.01% put them at the tail end of the historical distribution. In the table below, I look at how 2022 ranks in terms of bad years over the 1928 - 2022 time period:
In nominal terms, i.e., before taking into account inflation, 2022 ranks as the seventh worst year, over the 95-year time period, and in real terms, it moves up to being the sixth worst year, with real returns of -23.48%.No matter how you slice it, there is no denying that 2022 was the worst year for US equity investors since 2008, and the magnitude of the damage is even more staggering, if you consider it in market value terms. During the course of 2022, US equities collectively lost $11.6 trillion in market capitalization, but for balance, it is also worth noting that US equities are still holding on to a gain of $6.9 trillion on their market capitalization at the end of 2019. Given that we endured a pandemic, multiple political crises and wars in the three years since, that is almost a miracle.
Expected Returns
Markets are driven by expectations, and while expectations for the future can be affected by what has happened in the past, they are still worth exploring. After a year of being pummeled by markets, what are investors pricing stocks to make in 2023 and beyond? And will they be disappointed or delighted by what the year delivers? Those are the questions that investors have to answer today and I will try to provide my perspective in this section.
Actual vs Expected Returns
As you saw in the previous section, actual returns on stocks can be negative, and significantly negative, in some periods, and those negative returns can sometimes extend into decades. Those who invested in the Nikkei at its peak on December 29, 1989, have spent the decades since trying to get back to that level. The notion that stocks always win in the long term is a dangerous one, and while those pushing it claim to have the data on their side, it is worth remembering that the use of US data to make this case is statistically flawed. The US was one of the most successful of global equity markets of the twentieth century, and to use its historical record as the basis for all equity investment in the future strikes me as wrong headed.
That said, when investors buy equities, it would be both irrational and illogical to settle for expected returns that are less than what you can earn on risk free or guaranteed investments, though behavioral finance suggests that both irrationality and illogic are persistent human traits. The premium that investors demand over and above the risk free rate is the equity risk premium, and practitioners in finance have wrestled with how best to estimate that number, since it is not easily observable (unlike the expected return on a bond which manifests as a current market interest rate).
a. Historical Equity Risk Premium
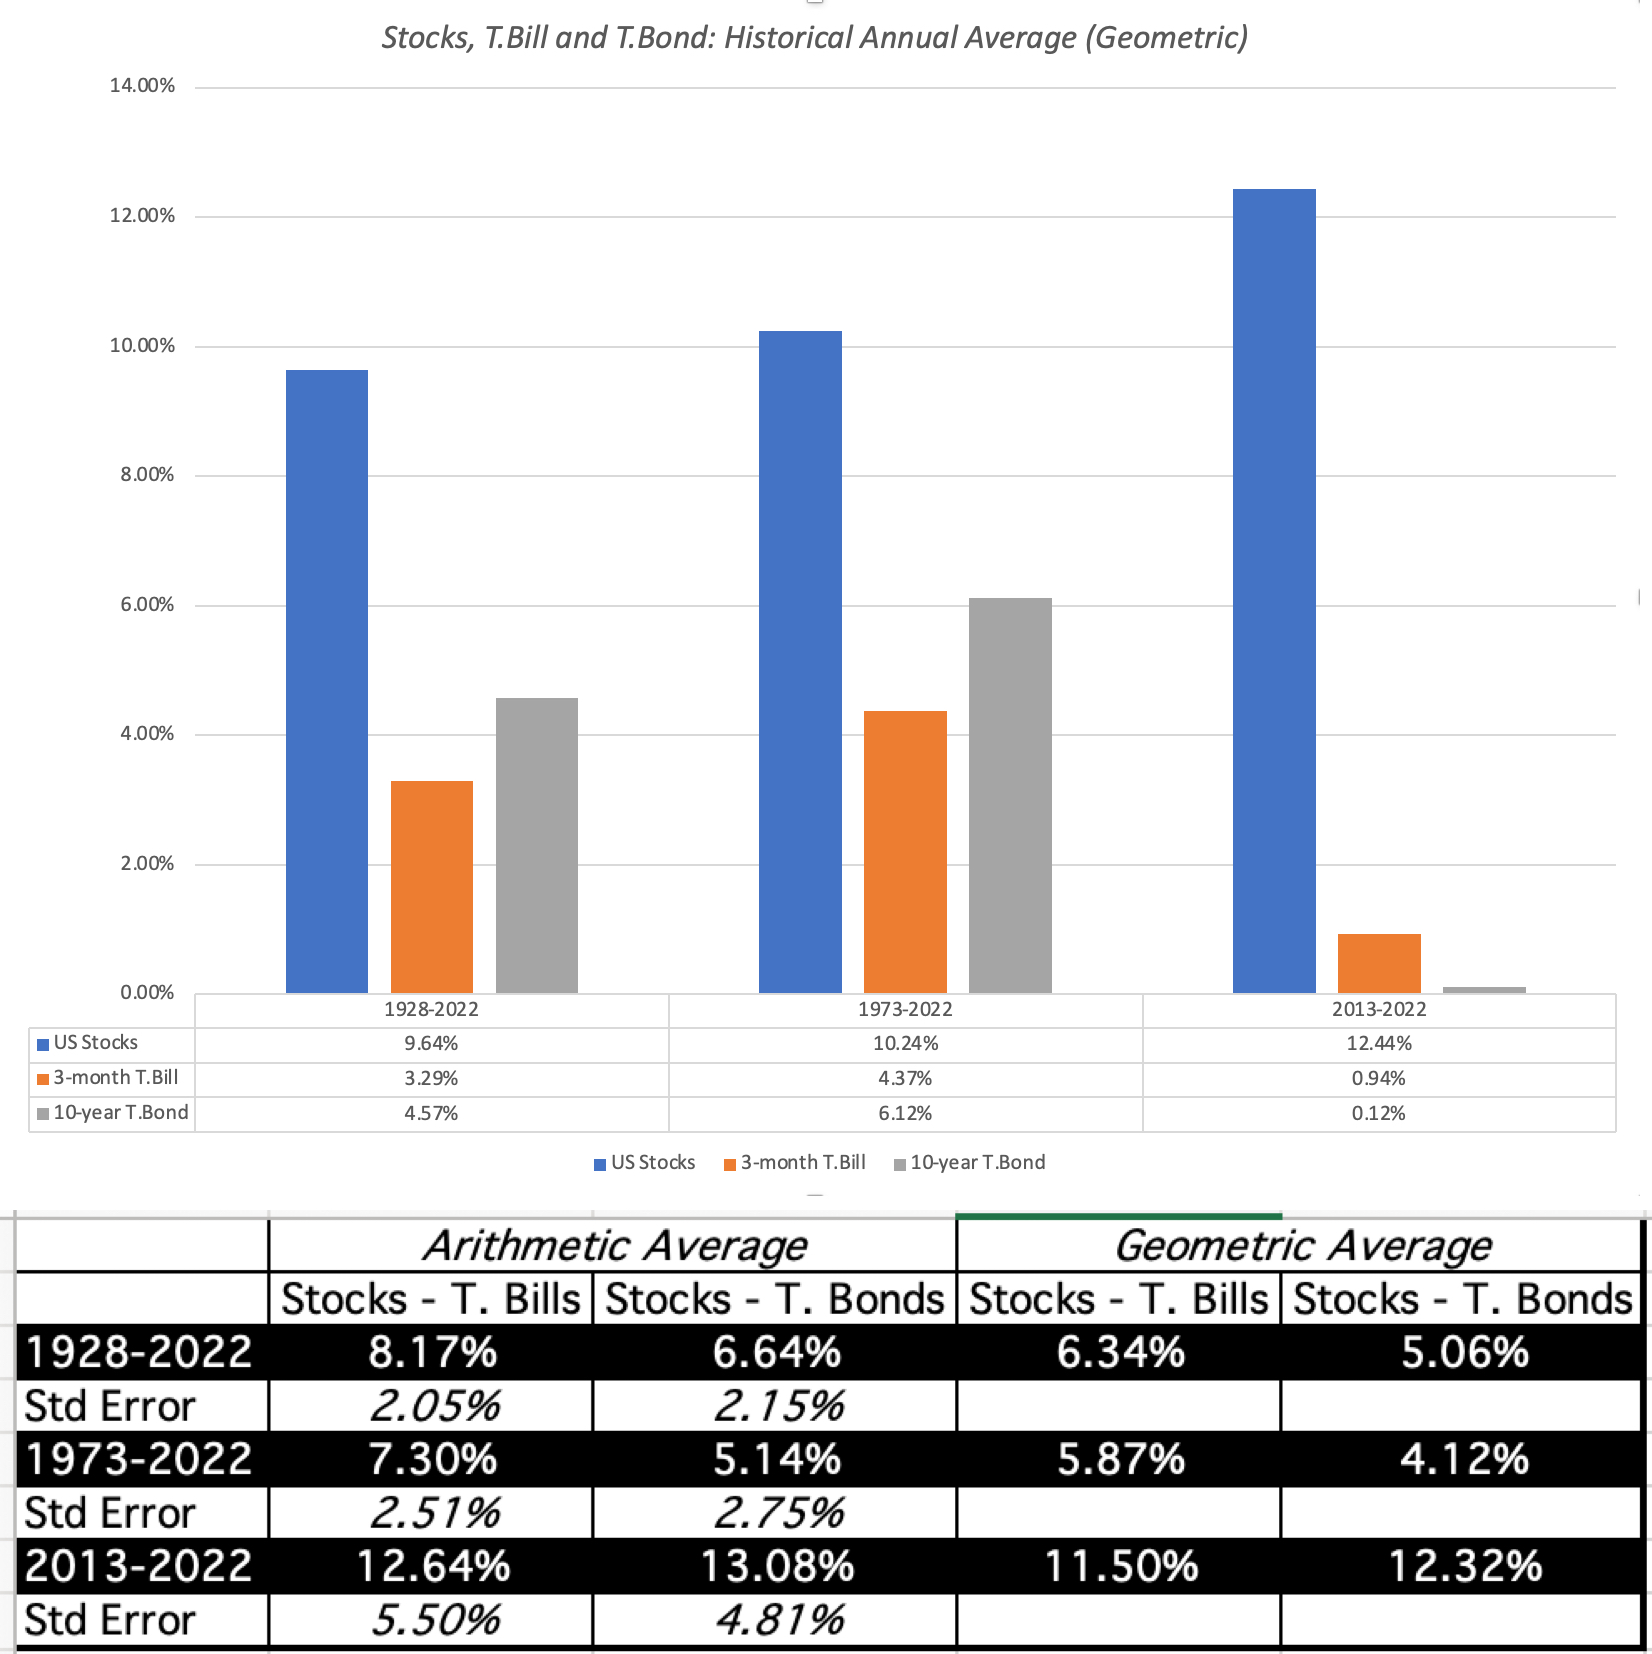
The conventional wisdom, at least as taught in business schools and practiced by appraisers, is that the only practice way to estimate equity risk premiums for the future is to use equity risk premiums earned in the past. Thus, historical risk premiums are viewed as the best estimates for the future, though analysts disagree not only about how far back in time they should go, whether to compare stock returns to T.Bill or T.Bond returns and even on how to compute the historical average return (arithmetic versus geometric averages). The graph and table below provide my estimates of the historical equity risk premiums in the US market:
As you can see, I arrive at premiums ranging from 4.12% to 13.08%, depending upon my estimation choices on time period, treasury rate used and averaging approach, but I don't use any of these numbers as my estimate for the future for two reasons. The first is that the use of historical risk premiums is predicated on the belief that the future will look like the past, and the world, in all its dimensions, has changed dramatically over the last few decades. The second is that even if you are comfortable with assuming mean reversion, the estimates from the past are extremely noisy (have large standard errors), with the premium from 1928 to 2022 having a standard error of 2.15%. In effect, even with that long period, the best I can offer, if you are looking for an equity risk premium for stocks over T.Bonds is a range so wide (2.34% - 10.94%, i.e., the average plus or minus two standard errors) that it is not useful
Implied Expected Returns
There is another approach to estimating expected returns on stocks, and equity risk premiums, and it is forward-looking. It too requires estimate for inputs, but the range of error is magnitudes smaller than with historical premiums. In this approach, I draw on a technique used to compute the yield to maturity on a bond, the discount rate that makes the present value of cash flows on the bond (coupons and face value) equal to the price of the bond, and extend it to equities. To illustrate, I estimate this implied equity risk premium for the S&P 500 at the start of 2023, using the index level as the price that I pay on the index and using market estimates of earnings and dividends/buybacks on the index for the next five years and beyond.
As with the yield to maturity for a bond, I solve for the discount rate (IRR) that makes the present value of cashflows on the index equal to the level of the index. At the start of 2023, by my calculations and with analyst estimates of earnings, I estimate an expected return of 9.82%. which when you net out the T.Bond rate that day results in an implied equity risk premium of 5.94%. There are clearly input estimates that you can take issue with, especially on earnings and cashflows. Thus, if you assume that analysts are over estimating earnings and/or that companies will return less of these earnings to investors in the form of dividends and buybacks, the estimated equity risk premium will decrease, and if you assume that growth will be stronger than forecast, the equity risk premium will rise. In this spreadsheet, you can see that making different assumptions on these fronts yields equity risk premiums ranging from 4.83% to about 6%, a much narrower range than from historical risk premiums.
In historical context
In my first data post, I noted the increase in equity risk premiums during 2022 from 4.24% at the start of 2022 to 5.94% at the start of 2023. I posited that any debate about whether the market, as it stands now, is fairly, under or over valued is really one about whether the equity risk premium at the start of 2023 is too high (in which case, the market is under valued) or too low (in which case, it is overvalued). To answer that question, and address the question of where the expected return of 9.82% stands in historical context, I report the expected returns and equity risk premiums for the S&P 500 from 1960 to 2022:
At 5.94%, the implied equity risk premium is closer to top of the range of historical risk premiums, but the most striking feature of 2022 is that the expected return on stocks, at 9.82%, is now at its highest level since 1995.
Stocks: The So What?
It is worth noting that in valuation, demanding a higher expected return depresses value today, and the increase in expected returns over 2022 is therefore consistent with the decline in stock prices during the year. In fact, the drop in stock prices of 20% is mild, given the surge in expected returns during the course of the year. There is another reading of this expected return that ties into investment and growth, where the expected return on stocks is the cost of equity that companies need to clear to make investments. In short, an average-risk project with a return on equity of 7%, which would have passed the investment test at the start of 2022, because it was greater than the cost of equity of 5.75%, prevailing at the time, would not pass muster at the start of 2023.
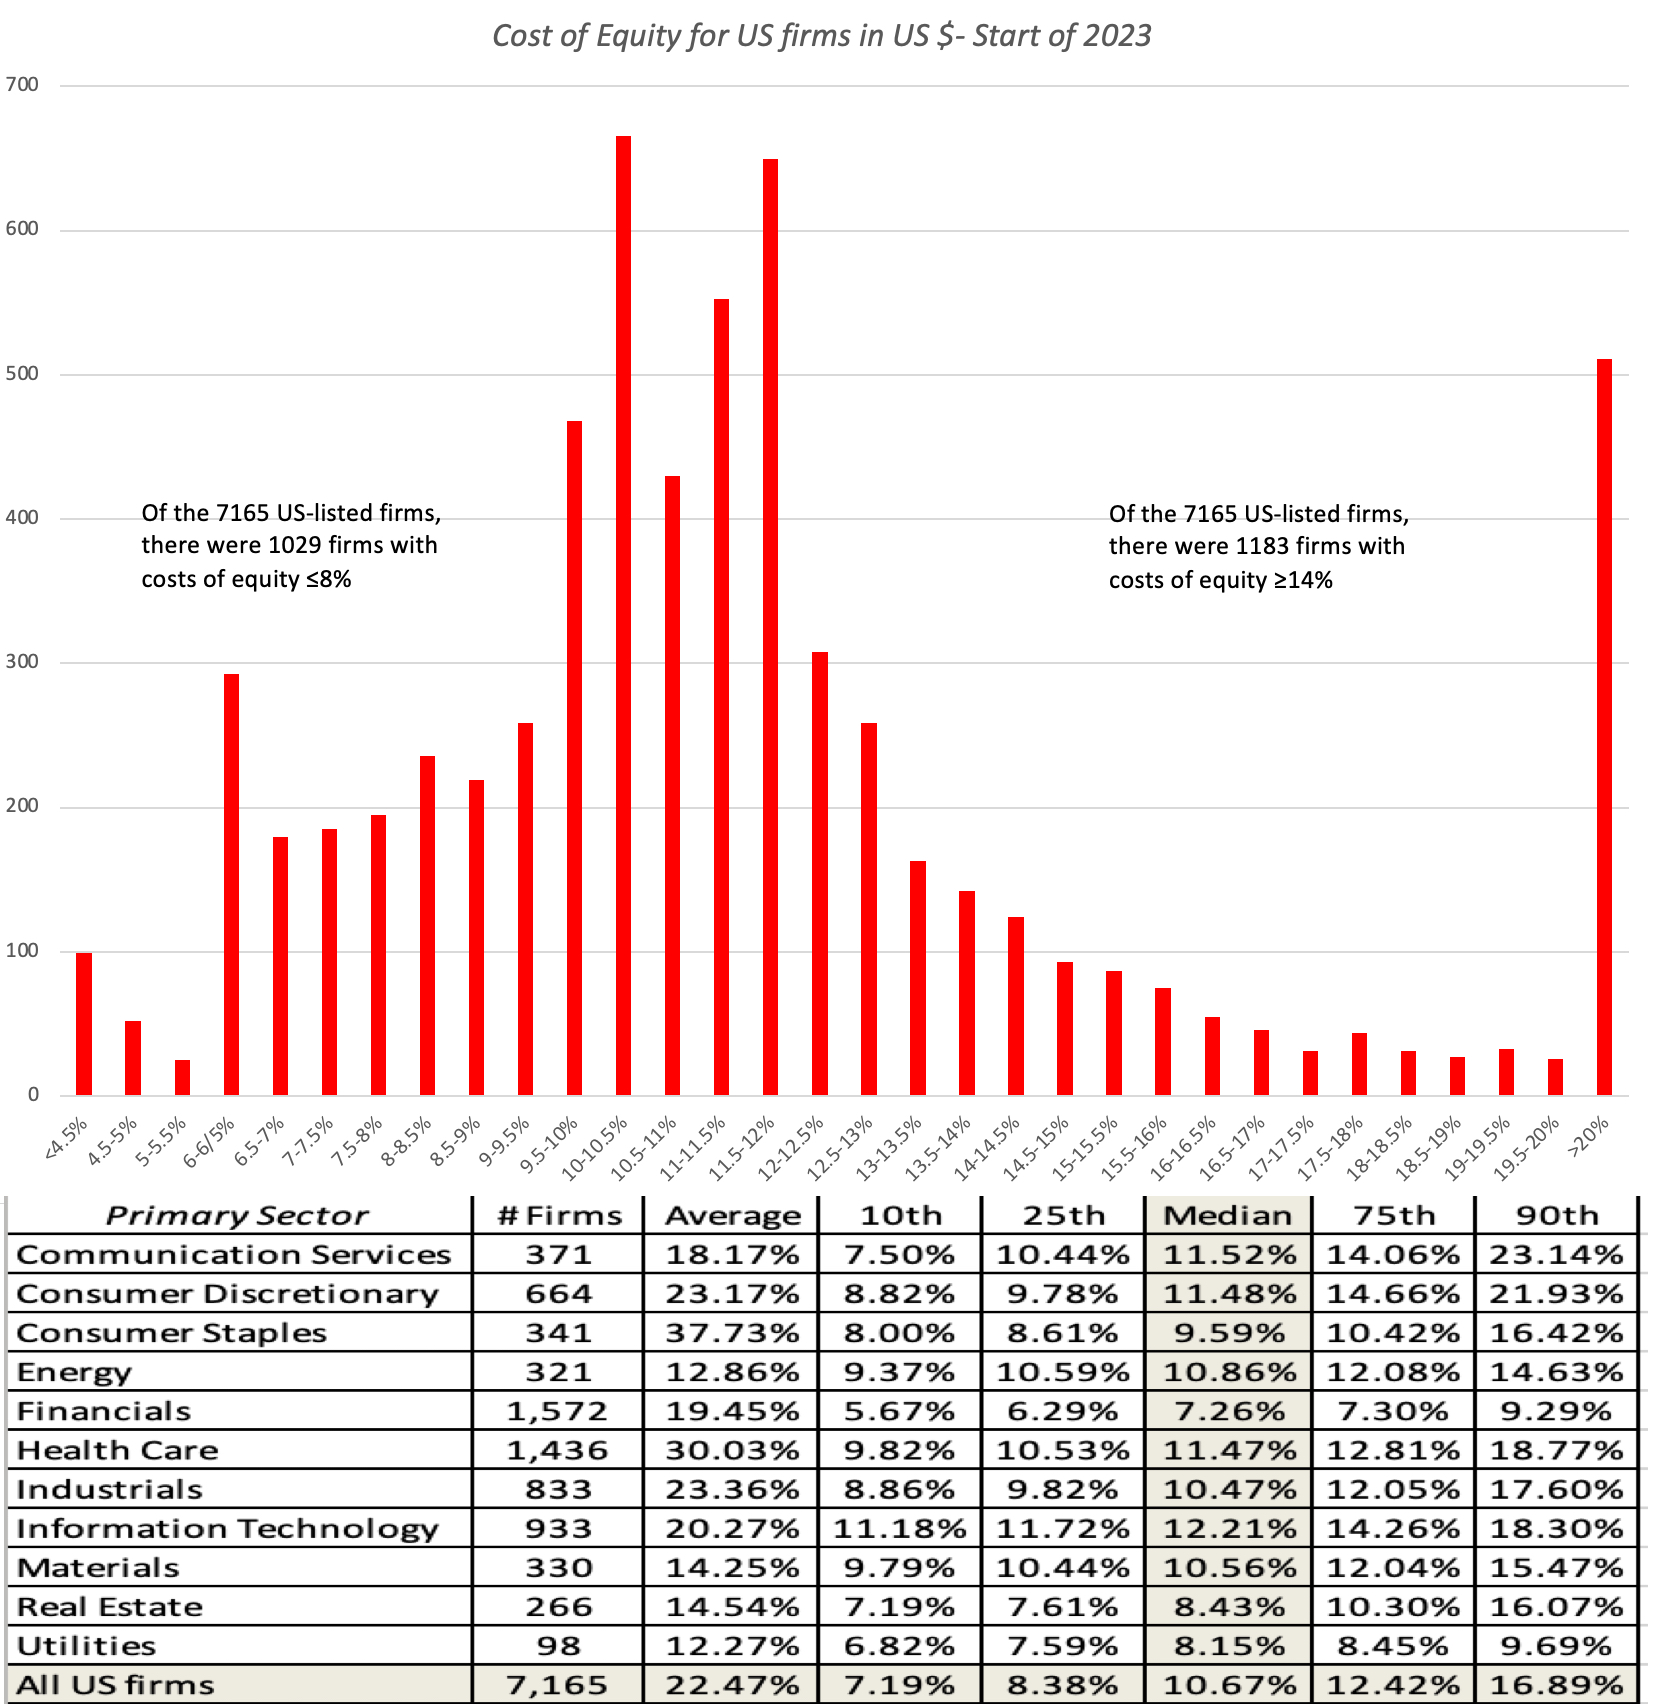
The effects of a higher equity risk premium are also not uniform across all stocks, with higher risk stocks seeing much greater rises in their costs of equity than lower risk stocks. The table below provides the cost of equity distribution across US companies at the start of 2023:
Note that, for the first time in a decade, more US firms have double digit costs of equity than single digit values, and while that may seem shocking to younger analysts, it is a return to what used to be normal in the pre-2008 market.
Stocks: The What Next?
To close this post, I revisited my valuation of the S&P 500 on September 23, 2022, and since much of last year's changes to the risk free rate, earnings expectations and the equity risk premium had happened by then, my value of the index has not changed much. In fact, if you view the current treasury bond rate as reflective of the market consensus on future inflation and rates, and assume that analyst estimates of earning already incorporate the effects of an economic slowdown in 2023 and 2024, the index value comes in at almost the current index level:
In sum, with analyst estimates of earnings for the next two years powering earnings expectations, and an desired equity risk premium of 5% (close to the average premium in the post-2008 time period), stocks started the new year closer to fair value than being under or over valued.
The market consensus can be wrong, and as the last year has shown, markets can change their minds, and especially so on two variables. The first is inflation, and whether it will recede to pre-pandemic levels or stay elevated, with consequences for both interest rates, nominal earnings growth in the long term and reinvestment. The second is the economy, where talk of recession fills the air but where a whole range of outcomes is possible from no recession to a steep drop off in economic indicators.
As you can see, the most favorable scenario for the market is one where inflation subsides quickly to pre-pandemic levels (1-2%), bringing down the treasury bond rate, and the economy escapes a recession, leaving corporate earnings unscathed; in this scenario, the index value is 4311, about 10% higher than the current level (in January 2023). In the least favorable scenario, inflation stays high, pushing interest rates further up, and the economy enters a steep recession, with earnings dropping 20% (10%) from analyst estimates for 2023 and 2024; in this scenario, the index value is 3212, leaving the market over valued by almost 20%. Note that I am not calling it the worst case scenario, because that depends on how high inflation gets, with the higher the inflation, the more dire the outcomes for stocks, as well as how bad a recession is, with worse economic outcomes lowering value more.
Summing up
One of the rituals that start the market year is for market strategists at investment banks to make their best predictions for where they see markets going over the course of the year. While this exercise has zero predictive power, and perhaps even a perverse relationship with actual returns, it does offer some insights into how much strategists are in agreement or disagreement about the year to come. At the start of 2023, here are the predictions from strategists for the year:
What should you do with these forecasts? Absolutely nothing, given the track records of these forecasts, but the wide divergence in forecasts comes from different expectations of how the inflation/real economy story will play out. Rather than adopt one of their outlooks, or mine, you should, as an investor, find your point of view and let it drive your investment actions for the year. The first step in being a good investor is to take ownership of your investment decisions, and I hope that my framework/spreadsheet helps you on that path.
YouTube Videos
Datasets (If you have download trouble, switch browsers)
In my last post, I talked about the ritual that I go through every year ahead of my teaching each spring, and in this one, I will start on the first of a series of posts that I make at the start of each year, where I look at data, both macro and company-level. In this post, I will provide a motivation, if you need one, for why I create and share the data updates, followed up by a description of my data sample, which includes publicly traded companies listed and traded across the world, as well as the data variables that I estimate and report.
Data: Trickle to a Flood!
It is perhaps a reflection of my age that I remember when getting data to do corporate financial analysis or valuation was a chore. To obtain company-level information, you needed to find its annual reports in physical form and for industry-level data, you were dependent on services that computed and reported industry averages, such as Value Line and S&P. The times have changed, and if there is a problem now, it is that we have too much data, rather than too little. As I noted in my posts on data disclosure last year, this has led to at least three unhealthy developments.
Data distractions: Faced with massive amounts of data, quantitative as well as qualitative, many investors and analysts find themselves distracted by immaterial, irrelevant and sometimes misleading data points along the way.
Data as a crutch: At the other extreme, there are some who believe that they answer to every question lies in the data, and that when seeking an input for valuation and corporate financial analysis, the data will provide it. Rather than make their best judgments or reason their way, when faced with estimation challenges, these investors and analysts embark on a search for more data, and if they do not find that data, they give up.
Data bias: There is the canard that data is objective, as opposed to estimates or judgments, which are considered subjective. That is not true! In my experience, data is malleable, and if there is enough of it at your disposal, you can screen it and selectively choose the data to support whatever viewpoint you want to advance.
During the course of my corporate finance and valuation journey, I have been guilty of all three of these sins, and it is to counter these pre-dispositions that I started spending the first week of every year looking at data with four objectives:
Get perspective: One of the challenges that anyone doing business analysis, investing or valuation faces is getting a measure of what comprises a reasonable value for a business metric. Thus, without a sense of what comprises a high or low profit margin for a firm, or what the cost of capital is for the typical company, it is easy to create "fairy tale" valuations and analyses. By the same token, it is impossible to use a pricing metric (PE or EV to EBITDA), without a sense of the cross sectional distribution of that metric at the time.
Mean reversion: I am not a knee-jerk believer in mean reversion, but the tendency for numbers to move back towards averages is a strong one. That said, to use mean reversion in analysis or investing, you need to know what these averages are, either over time or across companies, and data can help in that pursuit.
Counter made-up numbers: It remains true that people (analysts, market experts, politicians) often make assertions based upon either incomplete or flawed data, or no data at all. For instance, is it true, as some assert, that inflation was high last year because companies raised prices to increase profits? Or, do US companies pay far less in taxes than companies incorporated in the rest of the world? Rather than indulge in endless debates, where each side provides anecdotal evidence, data can prove to be the tie-breaker.
Check rules of thumb: Investing and corporate finance are full of rules of thumb, many of long standing. For example, I have seen it asserted that a stock that trades at less than book value is cheap or that a stock that trades at more than twenty times EBITDA is expensive. These assertions may very well be true, but cheap and expensive, at least in pricing terms, is relative, and looking at the data can help you detect rules of thumb that work from those that do not.
When valuing or analyzing a company, I find myself looking for and using macro data (risk premiums, default spreads, tax rates) and industry-level data on profitability, risk and leverage. Rather than collecting this data each time I do an analysis, I realized that having these numbers computed and ready to go ahead of the analysis not only saves me time, but also allows me to focus more on the company that I am valuing and analyzing. I also realized that while these numbers are useful to me, they could be useful to others doing analysis as well, and I could not think of a single reason not to share what I had on hand.
Data: Sources and Description
My first attempt at sharing data was in 1997, and it was limited to about a dozen data sets, all related to US companies, and I never expected very many people to use my data. That has changed, and this year, I am posting two hundred data sets, including more than a thousand data items, and extended the coverage to global companies. While I hope that you find this data useful, I also hope that you will spend a few minutes reading what I have to say about the companies that comprise my data universe, the data items I report on, the timing of the data and caveats.
Data Universe and Grouping
At first sight, computing an industry average seems like a simple computation, where you take individual company numbers in an industry group and average them out. However, embedded in this statement are multiple estimation choices that you have to make that affect the reported numbers, and it behooves me to describe my choices:
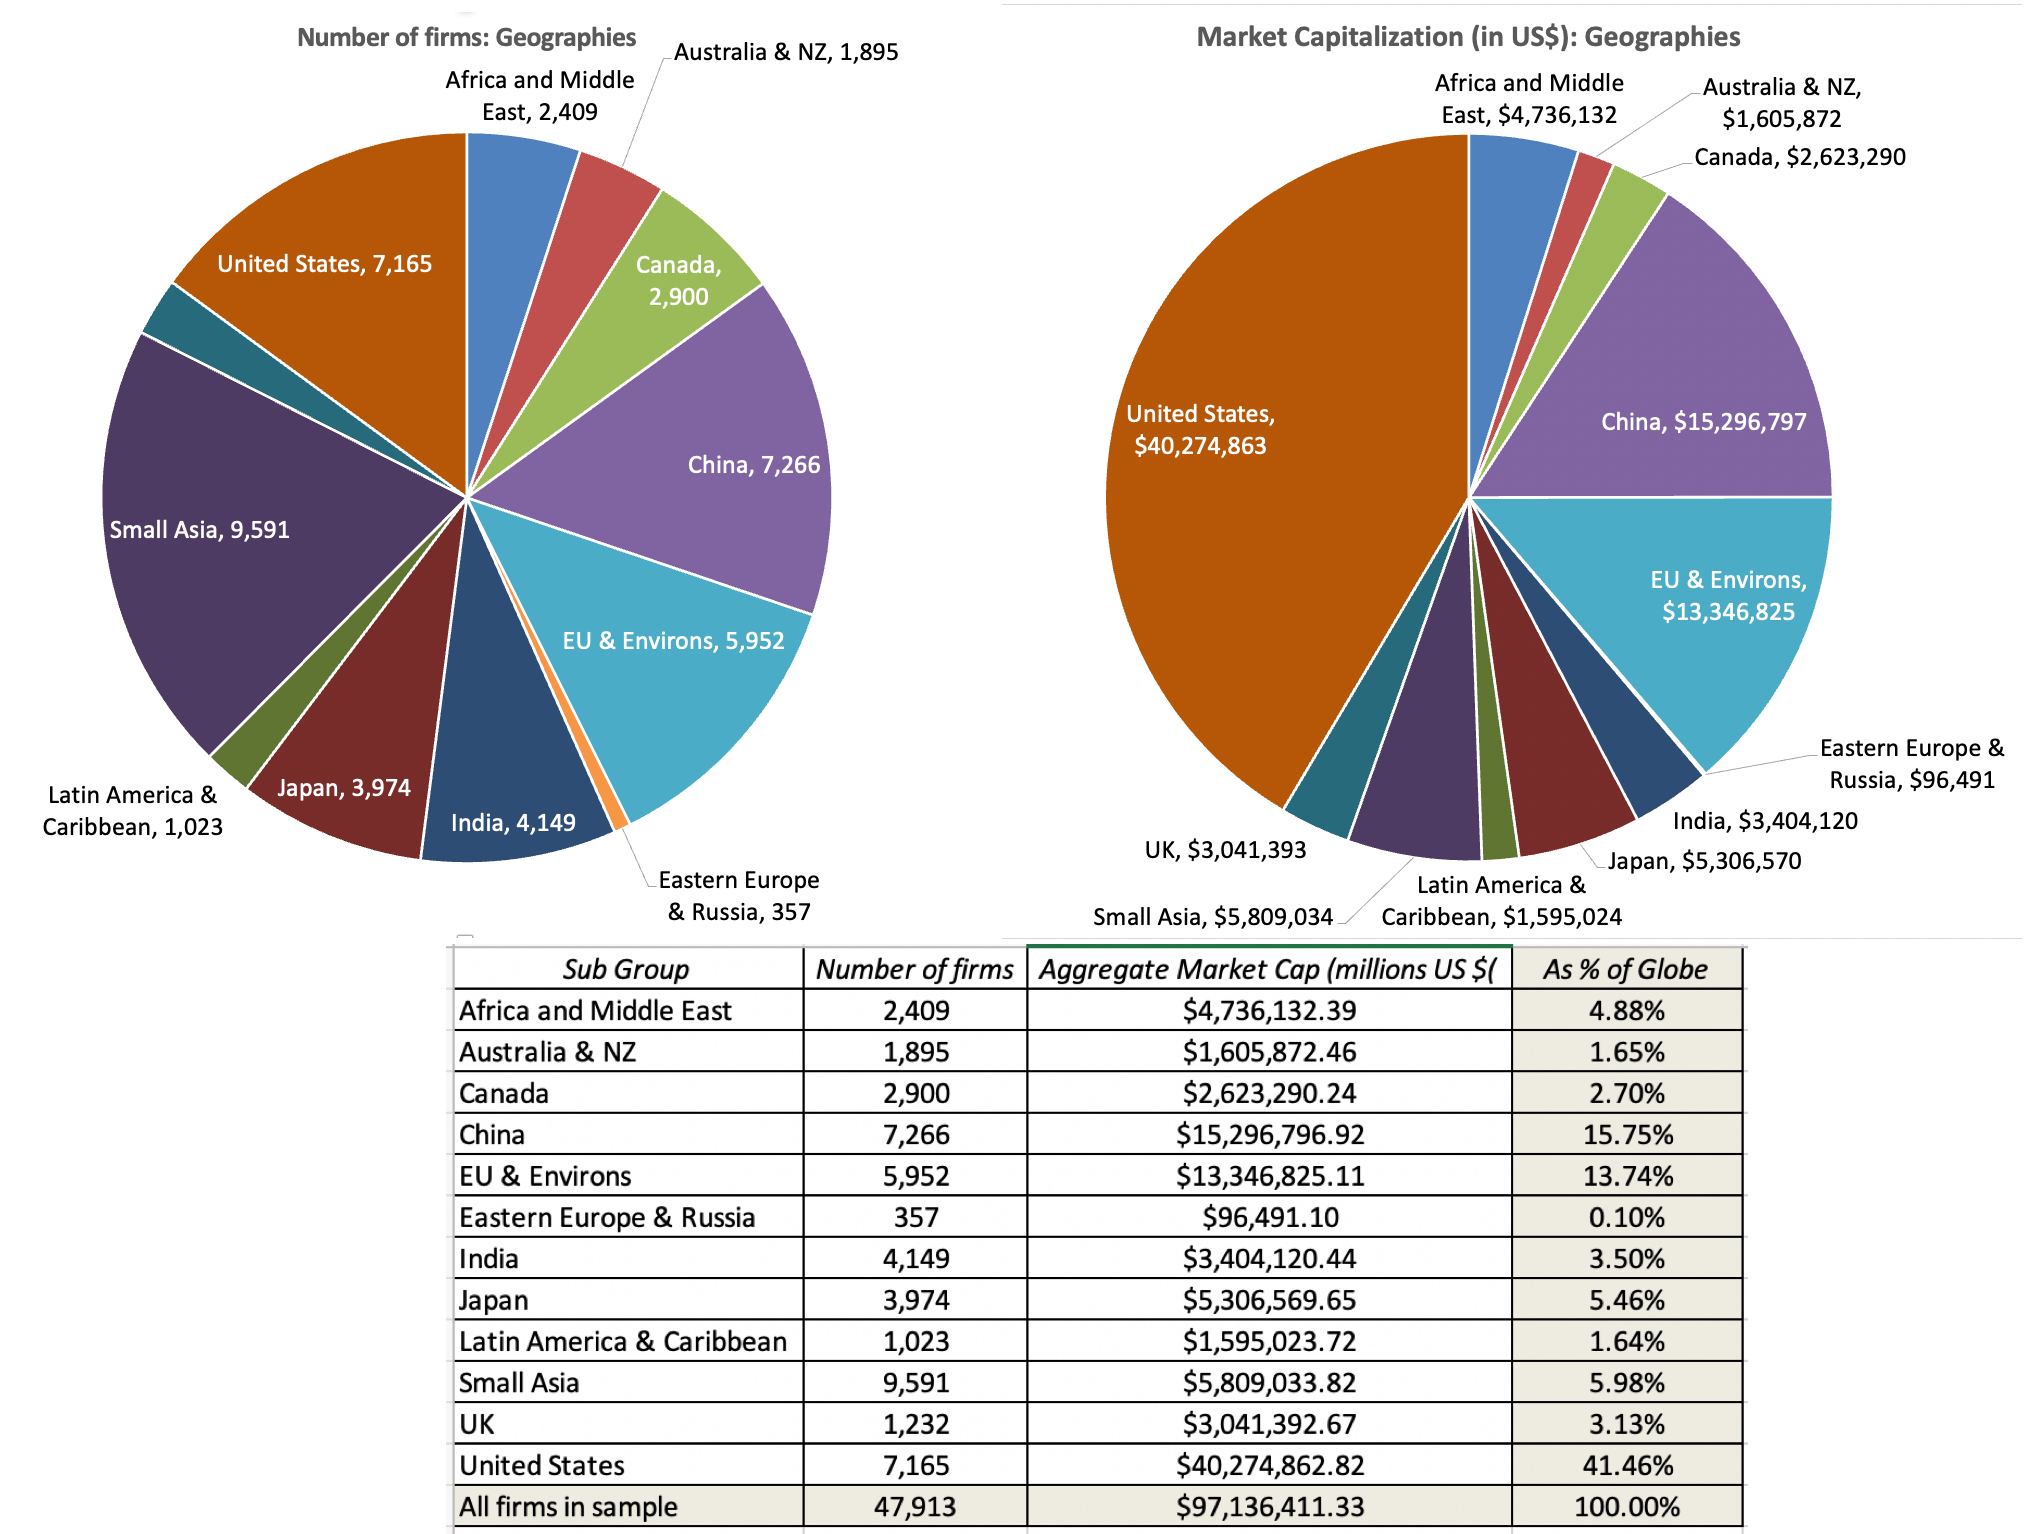
1. Data universe: In my sample, I include all publicly traded firms with market capitalizations that exceed zero, traded anywhere in the world. While there are risks bringing in very small and lightly-traded companies, with shaky data, into the sample, I include them to avoid the biases that will be created in industry averages by looking at just larger publicly traded companies, or just US-listed companies. In January 2023, I ended up with 47,913 publicly traded firms in my sample, with the pie chart below providing a geographic breakdown.
Speaking of biases, I do exclude privately owned (non-listed) companies for two reasons. The first is that in much of the world, these companies are not required to make their financial statements public, thus making it impossible to get the data. The second is that for data items that require market prices, including all the pricing metrics, private businesses cannot be included, since they have no market values.
2. Sectors and Industries: To make data useful for corporate financial analysis and valuation, I break the companies down into groupings, based upon the sectors and industries that they operate in. For the former, I use S&P's sector categorization and for the latter, I create 95 industry groups, built to allow users of my data to compare statistics over time. The sector breakdown of my overall sample is reported below:
My industry groupings are open to questioning for many reasons. First, for multi-business companies, I use the company's primary business (in terms of revenues) for categorization. Second, for some companies, it is not clear what industry group best fits the company. Thus, for Apple, it is unclear whether to put the company into company hardware, reflecting its history as a computer maker, or telecommunication equipment, reflecting its current dependence on the iPhone.
Data Items
Much of my focus, when it comes to data, is on company-specific variables, rather than macro economic data, for two reasons. The first is that there are other and much better sources for raw macroeconomic data than mine, and my favorite remains. Federal Reserve Economic Data (FRED): This is hands down, in my view, the best site for macroeconomic data in the world. While its focus is naturally on the US economy, inflation and rates, there is data for the rest of the world as well. I do report on a few market-wide data items especially on risk premiums for both equity and debt. The second is that in my line of work, which is corporate finance and valuation, the numbers I need lie in micro or company-level data, not in the macro space.
At the company-level, I provide data on risk, profitability, leverage and dividends, broken down by industry-groups, to be used in both corporate finance and valuation. I also report on pricing statistics, again broken down by industry grouping, with equity (PE, Price to Book, Price to Sales) and enterprise value (EV/EBIT, EV/EBITDA, EV/Sales, EV/Invested Capital) multiples. The table below shows a subset of the data items that I have on my website, with the links to the US versions of the data sets, in html. To get to the excel versions of this data, or the excel versions by region (Emerging Markets, Europe, Australia & Canada, Japan) as well as globally, please go the current data page of my website:
If you are interested in the archived data from prior years, you can get them by going to this link. For a description of the variables (and how I compute them), please try this link.
Data Timing
There is one final estimation detail that needs clarification. I did my updates in the last week (January 1- January 5, 2023), and used the most updated data that I could find on each company.
For market data, where the updating is continuous, that is data as of the January 1, 2023. Thus, market capitalization, interest rates and risk premiums, the data is as of that date.
For accounting flow items, in income statements and statements of cash flows, such as revenues, earnings and expenses, I used the data in the most recent twelve months of reporting; for most firms, that data is from October 2021 to September 2022.
For accounting stock items, from balance sheets, I use the numbers from the most recent balance sheet; again, for most firms, the numbers are from the balance sheets, as of September 30, 2022 or the most recent quarterly statements.
While these timing differences may strike some as inconsistent, they do meet my timing consistency test, which is that they are the most updated numbers that decision-makers (CFOs and investors) would have as of January 1, 2023.
Data Caveats
I have no qualms about sharing my data, since there is nothing particularly original or unique about what I do, and I am glad that there are some to whom the data is proving useful. If I save analysts and investors time in their decision making, I consider the time spent on my data analysis to have earned its required returns and more. Given the wide range of uses to which my data is put, I do have some caveats on its usage.
Mistakes and Errors: I am a team of one, reflecting more my desire for control that unwillingness on the part of others to help. That said, working with a data sheet with 47,913 companies and hundreds of data items can get daunting, as is updating individual excel sheets, by variable and region. If you find a mistake or mistakes, please bring it to my attention and I will fix it.
Judgment calls: I have made judgment calls starting with my creation of industry groups (which you may not like) and my assignment of companies into groups. Some take issue with my regional classifications, arguing that Mexico should be North America (geographically, you are absolutely right) rather than in Latin America (which is where I put it).
Company-level data: I do not provide company-level data for two reasons. One is that it would violate agreements that I (or NYU) have with my raw data providers and the other is that getting company-level data has become trivial. I know that most of you cannot afford a Bloomberg terminal or S&P Capital IQ, but you can get the data not just from Yahoo! Finance but also from a variety of online data services that are affordable and very well done.
Agenda: If you are using my data to advance a point of view that you hold, you are welcome to do so, but please be clear that this is your reading of my data, not mine. If you are in a fight (legal or online) and using my data as ammunition, you are entirely on your own, and I will not enter the fight on either side, unless you have a clarification question.
Staleness: I update my data once a year, and I will not return to do an update until January 2024; the equity risk premiums for the US will get updated every month and the equity risk premiums for other countries will get a mid-year update. While I have no compunctions continuing to use industry averages for risk, profitability and leverage over the course of the year, the pricing metrics (PE, EV/EBITDA etc.) will become dated as the year goes on, and especially so if the market moves up or down significantly.
You owe nothing to me for the data, and if it does get you into trouble, feel free to blame me. If you really want to offer something in return, the best favor you can do for me is to help someone else out there.
The Posts to come
In the posts to come, I will talk about what the numbers tell us about the state of the market and the companies that inhabit them, as of the start of 2023. It is undeniable that 2022 was a tumultuous year, with inflation taking center stage, and driving markets. In my next three posts, I will look at inflation's effects on equity markets (in post 2), government and corporate bond markets (in post 3) and other asset classes (real estate, collectibles and cryptos). For those who had become somnolent about country risk, the year provided a reminder of how quickly country risk can flare up and change, with Russia's invasion of Ukraine a precipitating factor, and in my fifth post, I will look at the evolution of country risk during the year. In the three posts that follow, I will look at the shifts in corporate hurdle rates (in post 6), debt loads and worries (in post 7) and dividends/cash returned in post 8. In the ninth post, I will look at how market pricing changed during 2022, across sectors/industries (with technology taking the biggest hit) as well as across growth and corporate life cycles. There is always the chance that I will get distracted along the way, since I want to value Tesla later this month and return to my FANGAM valuations in February!