Wednesday, December 2, 2020

The Sharing Economy come home: The IPO of Airbnb!

On Monday, November 16, Airbnb filed it’s preliminary prospectus with the SEC, starting the clock on its long awaited initial public offering. On the same day, rising COVID cases caused more shut downs and restrictions around the world, creating a clear disconnect. Why would a company that derives its value from short term rentals by people who travel want to go public, when a out-of-control virus is causing its business to shut down? In this post, I will argue that there are good reasons for Airbnb's IPO timing, and make my first attempt at valuing this latest entrant into public markets.

Setting the Table

As with any valuation, the first step in valuing Airbnb is trying to understand its history and its business model, including how it has navigated the economic consequences of the COVID. In this section, I will start with a  brief history of the company, move on to reviewing its financials leading into 2020, and then look at how it has performed in 2020. I will end the section by looking at information disclosed in the recent prospectus filing that provides insights into the company’s journey to its initial public offering.

Timeline of Airbnb

Airbnb's roots go back to 2007, when during an industrial design conference in San Francisco, Brian Chesky and Joe Gebbia realized that there were opportunities for homeowners to rent their homes to visitors, and created a company called AirBed & Breakfast. Joined in 2008, by Nathan Blecharczyk, a Harvard graduate and technical architect, AirbedandBreakfast.com was born and later renamed Airbnb. In subsequent years, the company grew, with multiple rounds of funding from venture capital. Along the way, investors in the company rapidly escalated their pricing of the company from $1 billion in 2011 to $10 billion in 2014 to more than $30 billion in 2016. The time line below captures some (but not all) of the highlights in Airbnb’s history:


While the company has been able to hit new milestones of growth each year, there are two challenges that it has faced along the way, that need to be incorporated into any valuation you attach to the company today. 
  1. Legal Challenges: The company has faced multiple challenges from cities that feel that its business model violates local zoning laws and regulations, and evades taxes. While you can attribute some of this pushback to hotel company lobbying and the inertia of the status quo, there is no doubt that Airbnb, like Uber, pushes regulatory and legal limits, taking action first and asking for permission later. While Airbnb has found a way to co-exist with laws in different cities, the restrictions they face vary widely across the world, with some locations (like New York) imposing much more stringent rules than others.
  2. Acquisitions: As the number of hosts and guests on Airbnb have climbed over the years, the company has invested in building a more robust platform for its rentals. While some of that money has been spent on internal improvements, much of it has been spent acquiring more than two dozen companies, most of them small, technology businesses. 

Business Model

Airbnb's primary business model connects hosts who own houses and apartments with guests who want to rent them for short term stays, while providing a secure and easy-to-use platform for search, reservations, communications and payments. That said, though, it is worth peeking under the hood to see how this business model plays out as revenues and earnings. In the picture below, I look at the Airbnb business model, both in its original form (which still holds for hosts renting their own houses or apartments) and professional hosts (who own multiple units or even operate small hotels), a model it introduced recently and is still transitioning into:


In both versions of the model, Airbnb's revenues come from fees collected on rentals, with both the host and the guest paying in the individual host version, but only the host paying in the professional host version. In 2016, Airbnb extended the model, allowing hosts to offer experiences to their guests, for a fee, with Airbnb keeping 20% of the payment. While the concept was heavily promoted, it has been slow to take off, with only $10 million in sales in 2017, but Airbnb has not given up, hiring Catherine Powell, a Disney theme park executive in 2020, to revamp the business.

The Financials, leading into 2020

The proof of a business is in the numbers, and Airbnb, in addition to posting impressive numbers on hosts, listings and guest nights, has also seen financial results from that growth. In the graph below, I look at gross bookings (the total amount spent by guests on their rentals), revenues to Airbnb from these booking (in dollar values and as a percent of gross bookings) and operating profitability, in dollar and percentage terms:

Source: Airbnb Prospectus (November 16, 2020)

Taking a closer look at the numbers, here are some preliminary features that stand out:

  1. Growth is high, but the rate is declining: It may seem churlish too take issue with a company that has grown its revenues more than five fold over a five-year period, but as the company's base gets bigger, its growth rate, not surprisingly, is also declining. By the start of 2020, Airbnb had already become one of the largest players in its market of vacation and travel rentals, a sign of success, but also a crimp on future growth.
  2. Airbnb's revenue share has stayed stable: As gross bookings have increased, Airbnb's share of these bookings has remained stable, ranging from 12-13% of overall revenues. Note that the shift to the new business model for professional hosts (where Airbnb keeps 14% of the transaction revenue) is relatively recent, and it will take some time for that change to play out in the numbers. In addition, growth in the experiences business will also push this metric upwards, since Airbnb keeps a 20% share of those revenues.
  3. The company is edging towards profitability: To Airbnb's credit, it is closer to profitability than many of its high profile sharing-economy predecessors (such as Uber and Lyft) and the fact that it was able to report positive operating profits, albeit fleetingly in 2018, without playing the adjusted earnings game (where companies add back stock based compensation and other items to their bottom line to claim fictional profitability) puts them ahead of the pack.

In summary, coming into 2020, Airbnb was delivering a combination of growth driven by disruption and a pathway to profitability that made them a prime candidate for a public offering.

The COVID effect

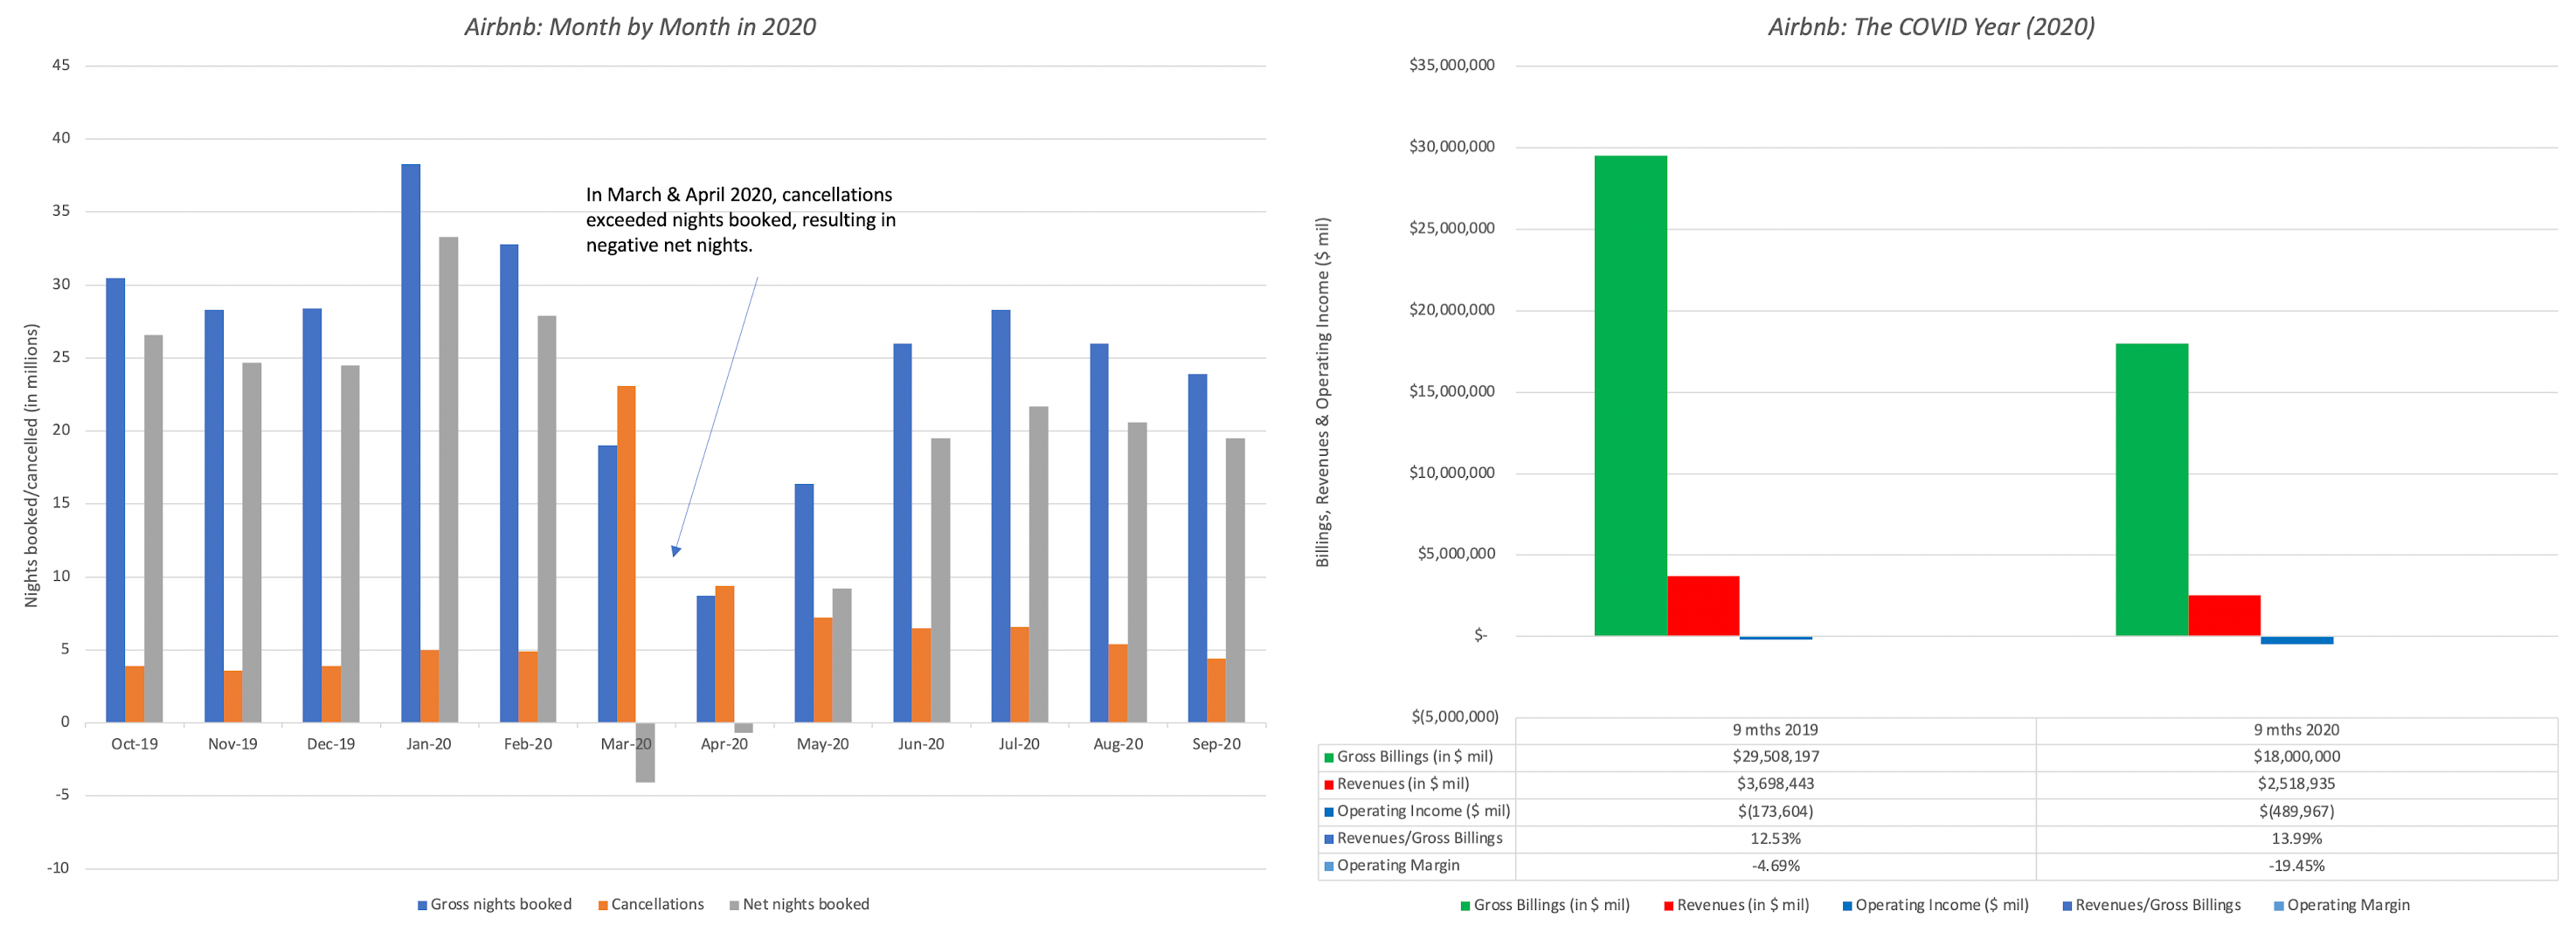
I don’t think anyone expected 2020 to be the year that it was, and even in hindsight, it has been full of unwelcome surprises for individuals and businesses. While there were news stories about the virus for the first few weeks of 2020, they centered either on China or passengers on cruise ships that had been exposed to the virus. Once the virus made its presence felt elsewhere, in February and March, countries responded with partial and full economic shut downs that hurt all businesses. The travel business was particularly exposed, as people curtailed flying and traveling to distant destinations, and Airbnb was hurt badly in 2020, as can be seen in the graphs below:

Source: Airbnb Prospectus

The graph to the left looks at the effect of COVID on gross bookings and cancellations (in millions of nights), with the net bookings representing the difference. Note that cancellations exceeded bookings in March and April, at the height of the global shutdown, but have come back surprisingly well in the months after. In the graph to the right, you can see the effects on the financials, in a comparison of first nine months of 2019 to the first nine months of 2020, with gross bookings dropping 39% and operating losses almost tripling over the period.

The Prospectus Revelations

If Airbnb had broached the idea of a public offering in March and April, where the numbers were not just dire but potential catastrophic, it is likely that they would have been laughed out of the market. There are two factors that may have led Airbnb to reassess their prospects and file for a public offering now. 

  • It’s relative:  The first is that it was not just Airbnb that felt the pain from the economic shut down. As we will see in the next section, the hotel and travel booking businesses were damaged even more than Airbnb, because of their large asset bases and debt levels. In relative terms, Airbnb might emerge stronger from the COVID crisis, than it was, going into it. 
  • Rebound:The second is that business returned stronger than most had anticipated in 2020, with third quarter numbers coming in above expectations, and markets rebounded even more strongly with stocks recouping all of their early losses. When Airbnb filed its prospectus with the SEC on November 16, I don't think that there were many who were surprised at the timing. 
While Airbnb's general financial performance has been mostly public for the last few years, the prospectus provides more detail as well as guidance on governance and the terms of the offering.

  1. Pathway to Profitability: Digging through Airbnb's financials over the last five years, and breaking down the expenses, here is what we see:
    Source: Airbnb Prospectus (Nov 16)

    Note that, at least through the most recent years, there is little evidence of economies of scale, since the direct operating costs have stayed at between 40-42% of revenues and the other costs have, for the most part, been rising. In 2019, the company also reported a substantial restructuring charge that presumably was one-time and extraordinary, but that item bears watching, since it has become a convenient vehicle for companies to hide ongoing operating expenses.
  2. Use of Proceeds: While the details are still being worked out, it is rumored that Airbnb is looking to raise about $3 billion in proceeds on the offering date, and that while some of the proceeds will be used to retire existing debt, most of it will be held by the company to cover future investment needs.
  3. Share classes: In keeping with the practices of tech companies that have gone public in recent years, Airbnb has shares with different voting rights: class A shares with one voting right per share, class B shares with 20 voting rights per share, and class C & class H shares with no voting rights per share. Not surprisingly, the class B shares will be held by founders and other insiders, allowing them control of the company, even if they own well below 50% of all shares outstanding. It is the class A shares that will be available to shareholders who buy on the offering day, and will remain the most liquid of the share classes thereafter. It is not clear why there are class C shares, other than to give founders, who already have control, even more control in future years, if they feel threatened. 
  4. An ESG twist: It should come as no surprise that in an age where companies are valued on their "goodness", Airbnb is signaling it's intent to be socially responsible, with Brian Chesky making explicit the corporate values for the company, including "having an infinite time horizon" and "serving all of our customers". In addition, the proceeds from the non-voting class H shares will be set aside is an endowment to serve Airbnb hosts, though it is not clear whether the primary intent is to give hosts a stake in the company’s success, or to help them out during periods of need. I remain skeptical about ESG, but will hold off on passing judgment on whether this is just a public relations ploy.

The Hospitality Business

To value Airbnb, we need to start with an assessment of the market that it is targeting and then understand the competition that the company faces. In this section, I will start with a look at the market size and then examine the hotel and booking companies that comprise its competition.

The Market (TAM)

There are two ways in which I can describe Airbnb's total addressable market. One is to look the hotel business globally, which generated in excess of $600 billion in revenues in 2019, with the following characteristics:

The hotel business is large, but its growth has slowed over the last five years, and it remains concentrated, with the top five hotel chains accounting for a larger and larger portion of the overall market every year since 2014. While the US remains the largest market, geographically, Asia is the center of growth, with China leading the way. 

There are some who believe that the conventional hotel market understates the potential market for a sharing economy company like Airbnb, since it can increase the supply of rental units without major new investment, and perhaps induce new entrants into the business. After all, the ride sharing companies have doubled or even tripled the size of the car service business in the last decade, using this template. It should come as no surprise that Airbnb believes that its total addressable market is much bigger than the hotel business. In 2011, in its infancy as a company, Airbnb estimated that its total addressable market at the 1.9 billion trips that were booked in 2010, and its share of that market at 10.6 million trips, as can be seen in this graph from the company in an early VC pitch:

In its prospectus, driven partially by its past success, and partly by the need to justify a large market cap, Airbnb has expanded its estimate of market potential to $3.4 trillion, as evidenced in this excerpt from the prospectus:

We have a substantial market opportunity in the growing travel market and experience economy. We estimate our serviceable addressable market (“SAM”) today to be $1.5 trillion, including $1.2 trillion for short-term stays and $239 billion for experiences. We estimate our total addressable market (“TAM”) to be $3.4 trillion, including $1.8 trillion for short-term stays, $210 billion for long-term stays, and $1.4 trillion for experiences.

In my view, Airbnb's targetable market falls somewhere in the middle, clearly higher than just the hotel business of $600 billion, but below Airbnb's upper end estimate of $2 trillion for this business. That is because there are parts of the world, where the Airbnb model will be less successful than it has been in the United States, either because of consumer behavior or regulatory restrictions. Given how much trouble Airbnb has had in the experiences business, I think Airbnb’s estimate of $1.4 trillion for that business is more fictional than even aspirational.

The Players

To make a judgment on Airbnb's future, we need to understand two peer groups. The first is the hotel business, since it is the business that is most at risk of being disrupted by the Airbnb model. The other is the online travel booking business, where there are large players like Expedia and Booking.com which have, at least for segments of their business, made their money by acting, like Airbnb, as intermediaries or brokers connecting guests with hospitality offerers. 

1. The Hotel Business

The hotel business is both large and diverse, composed of hotels that range the spectrum from luxury to budget. To get a measure of the business, I have listed the 25 largest publicly traded hotel companies (in market capitalization) in the world below, with Marriott topping the list, with revenues of about $21 billion in 2019:

The conventional hotel business is an asset-heavy business, with a significant real estate component to its value, and while some hotel companies have stayed with that model, others have moved on to a more capital-light model, where the real estate is owned by a separate entity (both in terms of ownership and control) and the hotel companies operates primarily as an operator. Marriot, for instance, follows the latter model, with the Marriott REIT owning the real estate, and Marriott collecting operating revenues from running the hotels. In addition, the global economic shutdown precipitated by COVID has wreaked havoc on hotel company revenues and profits, with revenues down about a third (in annualized terms) in the last 12 months, relative to 2019. 

2. The Travel Booking Business

While the hotel business is the one being disrupted the most by Airbnb, it is the travel booking business that is closest to the Airbnb business model. That business is also dominated by large players, with Expedia and Booking.com being the biggest. In the table below, I look at the revenues and operating income at these companies in 2019 and the last 12 months:

While Expedia and Booking.com both generate revenues from operating as middlemen between travelers and hospitality providers, just like Airbnb does, there are two key differences:

  1. Other businesses: Both Expedia and Booking.com also operate in other businesses that drive revenues and margins. First, they generate revenues by buying blocks of hotel rooms at a discount from hotels, and then reselling them at a higher price, in what they call the "merchant" business. Second, they also derive revenues from online advertising by hotels and travel providers. Expedia gets a much larger share (47%) of its revenues from the merchant business than Booking.com (25%), which may explain its lower margins.
  2. Status Quo vs Disruption: Both Expedia and Booking.com were designed to make money off the status quo in the hospitality business, and derived all of their revenues until recently from existing hotels and airlines. In reaction to Airbnb's success, both companies have tried to expand into the home and apartment rental businesses, but these listings still represent a small fraction of overall revenues.

The Valuation

To value Airbnb, I will follow a familiar script, at least for me. I will start by telling my Airbnb story, based upon the market it is in and its competition, current and potential, and then use this story as a launching pad for my valuation of the company. I will complete the valuation by looking at its sensitivity to key value drivers and bring in uncertainty into the equation.

Story and Numbers

I believe that Airbnb will continue to grow, while finding a pathway to profitability. Airbnb's growth in gross bookings will come not only from disrupting and taking market share from the hotel business, bad news for conventional hotel companies and travel providers who serves them, but also from continued expansion of non-conventional hospitality providers (home and apartment owners). As it grows, Airbnb's share of those gross bookings is likely to plateau at close to current levels, but its operating margins will continue to improve towards travel booking industry levels, as product development, marketing and G&A costs decrease, not in dollar terms, but as a percent of revenues. While Airbnb is enthusiastic about the experiences business, it is likely to remain a tangential business, contributing only marginally to revenues and profitability. Since Airbnb has a light debt load and is closer to profitability than most of the sharing-economy companies that have gone public in recent years, I will assume that their risk will approach that of the travel business, and that the risk of failure is low. In terms of inputs, this story translates into the following:

  1. The COVID After-effects: The comeback from COVID will be slow in 2021, with Airbnb seeing revenues return, albeit to less than 2019 levels, while continuing to lose money (with operating margins of -10%).
  2. Growth in Gross Bookings: In 2019, Airbnb’s gross bookings grew 29.25%, lower than the growth rate in prior years, reflecting its increasing scale. After its recovery from COVID in 2021, gross bookings will continue to grow at a compounded annual growth rate of 25% between 2022 and 2025, and growth will drop down over the following years. In 2031, I expect Airbnb’s gross bookings to climb above $150 billion, about 60% higher than Booking.com’s gross bookings in 2019 and 40% higher than Expedia's gross bookings in that year.
  3. Revenues as percent of Bookings: Over the next decade, revenues as a percent of gross bookings will increase only mildly from current levels (12%-13) to 14%, sustained by the new host model for professional hosts and the supplemental benefits from Experiences business. 
  4. Target Operating Margin: This will be a key component of Airbnb’s story, and I will assume that the operating margins will improve over the next decade to 25%, lower than Booking.com’s 2019 operating margin of 35.48%, but higher than the margins for Expedia or the hotel business.
  5. Sales to Invested Capital: While Airbnb has a capital-light model, it’s platform requires new investments in either product development and acquisitions. In 2020, Airbnb's sales to invested capital was 1.82, but the invested capital was negative in the prior year, making it unreliable, and  Booking.com had a sales to invested capital of 1.91 in 2019. I assume that Airbnb will be able to generate $2.00 of revenues per dollar of invested capital in the next decade.
  6. Cost of Capital & Failure Risk: For the cost of capital, I will assume that Airbnb’s cost of capital will be 6.50%, close to the cost of capital of hotel companies, to start the valuation, but over time, it will rise to 7.23%, reflecting an expected increase in the treasury bond rate from current levels to 2% in 2031. While Airbnb has flirted with profitability and has little debt, it still remains a young, money losing company, and I will assume a 10% chance of failure.
  7. Share Count: Getting the share count for a company on the verge of going public is always tricky, as preferred shares get converted to common shares, options and warrants are outstanding and additional shares are issued on the offering date. For Airbnb, there is the added complication of a 2 for 1 stock split which occurred only a few weeks prior to the offering. For the moment, therefore, the share count is still a number that is in progress, but the next update on the prospectus should provide more clarity. (Right after I posted this, Airbnb updated their prospectus to reflect a more accurate share count. The value per share should now be closer to the right value)
With these inputs, my valuation of Airbnb is captured in the picture below:
Download spreadsheet

The value that I derive for Airbnb, with my story and inputs, is about $36 billion, with $3 billion in expected proceeds from the IPO augmenting the value and netting out the value of options outstanding. The per share value based upon the latest share count is about $54/share.

Value Drivers and Dealing with Uncertainty
There are two key drivers of Airbnb’s value. The first is the growth rate in gross bookings and the resulting expected dollar value in 2031, with value increasing with expected gross bookings. The other is the target operating margin, in 2031, with higher margins translating into higher value. In the table below, I list out the value of equity in Airbnb for variants of gross booking growth and operating margins:

Rather than view this table as anything goes, I would use it to make break even assessments, given what Airbnb trades at. For instance, if the market capitalization of Airbnb today is $60 billion, you would need it to deliver gross billings of $200 billion in 2031, with an operating margin of close to 35%. There is ample room for disagreement on Airbnb’s value, since there are plausible combinations of revenue growth and margins that deliver very different equity values. To more explicitly capture the effect of this uncertainty, I replace my point estimates of gross bookings growth, target margin and cost of capital with distributions, run simulations and capture the consequences in a value distribution:

Download spreadsheet

In short, there is nothing sacrosanct about my value judgment for Airbnb and if you disagree with me, even strongly, I understand your point of view. In fact, it is these differences that allow for buyers and sellers to co-exist in the market.

Previewing the IPO

While we can debate what Airbnb’s value truly is, an IPO is a pricing game. Put simply, rather than operate under the delusion that it is value that drive decisions, it is healthier to recognize that bankers price IPOs, not value them, for the offering, that much of the trading on the offering day and the weeks thereafter is driven by traders, trying to gauge mood and momentum. In this section, I will look at the contours of this pricing game for Airbnb, and implications for investors who may be more concerned about value.

An IPO is a Pricing Game
To price an IPO, traders look at two places for guidance. The first is the VC pricing of the company in the rounds leading into the public offering. The second is the market pricing of publicly traded companies in the peer groups, companies that investors will compare the company to, in setting prices. 
1. Venture Capital Pricing:  As mentioned earlier, Airbnb has raised more than two dozen rounds of venture capital over its lifetime, and has been reprised multiple times. In the graph below, I look at the trend lines in Airbnb’s pricing, based upon VC assessments:


The pricing attached to Airbnb climbed dramatically in the first few years, reaching $31 billion in 2016, but then settled into a period of stagnation. In April 2020, at the height of the COVID crisis, the company raised more capital from VC investors, who reduced its pricing to $26 billion. 
2. Peer Group Pricing: To price Airbnb, relative to publicly traded companies, I have computed pricing multiples for hotel and booking companies in the table below:

Applying any of these multiples to Airbnb’s current operating metrics (revenues, EBITDA or net income) will yield valuations that are too low, because the company is still growing and finessing its business model. To get a more realistic pricing, I apply the multiples to Airbnb’s expected values for these metrics in 2025, and then discounting the future values back to today.


In summary, these numbers yield a much higher pricing for Airbnb’s equity, if it is priced similarly to Booking.com, and a much lower pricing, if Expedia is used as the comparable.

Investment Judgments

In the coming weeks, Airbnb will update its prospectus to reflect more details on its IPO, and bankers will set an offering price per share, based primarily on the feedback that they get from potential investors to different  I may be jumping the gun here, but given how well the market has treated capital-light and technology companies this year, I would not be surprised if the market attaches a pricing of all above my estimated value for Airbnb's equity. As a market participant, you have three ways of participating in the Airbnb sweepstakes:

  1. Get in on the offering: Given the propensity of bankers to under price offerings, and given how the market has been behaving in the last few months, you can try to get a share of the shares at the offering price. This game gets easier to play if you are on the preferred client list at Morgan Stanley or Goldman Sachs, and are allowed access to the offering, but much more difficult, if you are not. Even if you do get in on the offering, there is no guaranteed payoff, because bankers do sometimes over price IPOs, as they did a few times in 2019.
  2. Play the trading game: In the trading game, value is a minor factor, at best, in whether you succeed. Your success will depend upon gauging the market mood and momentum on Airbnb and getting ahead of it and paying attention to what I call incremental information, small news stories that may have little or even no effect on value but can be consequential for momentum. 
  3. Be an investor: If you are truly a value investor, you should not be ruling out Airbnb just because it is money-losing or a young company facing multiple uncertainties. Instead, you should value Airbnb yourself, and draw up decision rules well ahead of the offering. Since I have my estimated  value for Airbnb at $36 billion, I will go first, using the valuation results, by decile, that come from my simulation: 
  • If equity is priced at <$28 billion (20% percentile): A bargain
  • If equity is priced between $28 & $33 (40th percentile) billion: A solid buy
  • If equity is priced between $33 (40th percentile) & $38 billion (60thpercentile): A fair value
  • If equity is priced between $38 (60th percentile) & $44 billion (80thpercentile): Too richly priced
  • If equity is priced > $44 billion: Over valued

As I have argued in prior posts, it is not my preference to sell short on stocks like Airbnb, even if I believe the they are significantly over priced, given how much more powerful momentum is than any fundamentals in driving stock prices.


Thursday, November 5, 2020

A Viral Market Update XIV: A Wrap on the COVID market, premature or not!

Over the last eight months, I have written a series of posts on the market and how it has adapted and adjusted to COVID. The very first of these posts, on February 26, 2020, was about two weeks into the meltdown and it is indicative of how little we knew about the virus then, and what effects it would have on the economy and the market. More than seven months later, there is still much that we still do not know about COVID, as it continues to wreak havoc on global economies and businesses. In this post, I intend to wrap up this series with a final post, reviewing how value has been reallocated across companies during the months, and providing an updated valuation of the S&P 500. Given that much of Europe is going into lockdown, and that there is no vaccine in sight, this may seem premature, but I have a feeling that there will be other uncertainties that will vie for market attention over the coming weeks, especially as the US election results play out in legal and legislative arenas. 

A Market Overview

For those of you who have read my prior posts on COVID's market effects, I will follow a familiar script. I will start by noting that this crisis has played out in markets in three acts, captured in the graph below where I look at the S&P 500 and the NASDAQ, since the start of this year:


The year began auspiciously for US equities, as stocks built on positive performance in 2019 (when it was up more than 30%) and continued to rise. In fact, on February 14, US equities were are at all time highs, when news of the virus encroaching into Europe and then rapidly expanding across the world caused stocks to go into a tailspin that lasted just over five weeks. On March 23, 2020, amidst talk of doomsday for stocks, momentum shifted, with some credit to the Fed, and stocks went on a run that extended through the end of August, recovering almost all of the ground lost during the meltdown. In September and October, stocks were choppy with more bad days than good, as investors recalibrated. While the graph is US-centric, this was a global crisis, and equities around the global moved through the same three phases, as you can see in the table below, where I look at selected equity indices from around the world:

Download data
Note that the pattern  is very similar, across indices, with steep drops in the first phase (2/14-3/20), followed by steep increases in the following months (3/20-9/1) before settling down in the last two months (9/1-11/1). As equities went on a turbulent ride, other asset classes were also affected, with US treasuries benefiting from a flight to safety in the first five weeks:
Download data
US treasury yields dropped across all maturity classes between February 14 and March 20, with short term rates dropping close to zero and 10-year T.Bond rates dropping fro 1.7% to 0.7%. I know it is fashionable now to attribute all things related to interest rates to the Fed's actions, but the bulk of the decline in treasury rates occurred before the Fed finally acted in mid-March, and it is surprising how little movement there has been in treasury rates in the months since. Though treasury yields have stayed at their mid-March levels, the rise and fall of the fear factor in the equity markets also played out in the corporate bonds, in the form of movements in corporate default spreads:
Download data

When stocks were melting down between February 14 and March 20, corporate bond spreads were also widening dramatically, but those spreads have fallen back almost to pre-crisis levels for the higher ratings, and mostly recovered even for the lower ratings. 

Looking at oil and copper, two economically sensitive commodities, you see reflections of the turbulence that affected equities and corporate bond markets:
Download data

Both oil and copper prices dropped significantly between February 14 and March 20, with oil showing a much larger decline (down more than 50%) than copper (about 15%), but both commodities have recovered, with copper now up almost 17% from pre-crisis levels. Oil, in spite of its comeback in the last few months, is still down more than 30% from pre-crisis levels. Finally, I look at gold and bitcoin, an odd pair, but both touted by their advocates as crisis assets:
Download data
While bitcoin is now up more than gold over the period, gold has performed better as a crisis asset, holding its own when equities were melting down between February 14 and March 20. In contrast, the crypto currencies (Bitcoin and Ethereum) have behaved like very risky equities, going down more than equities, when stocks were going down, and rising more, when they rose.

Equity Markets: A Wealth Transfer
The quick recovery in equity markets has led some to believe that the market has ignored the crisis, but that is not true. While equity values have recovered globally, there has been a significant shift in value across regions, sectors and company types. While I have talked about this value reallocation in previous posts, I will update the numbers and provide a summary of what the data is showing as of November 1. First, this crisis has played out very differently in different parts of the world, as you can see below, where I break down the market capitalizations of all publicly traded companies, by region, on February 14, 2020 and on November 1, 2020, with a table showing the percentage changes over the period:
Download data

The markets that are showing the most residual damage are Africa, Eastern Europe & Russia and Latin America. While the easy explanation is that they are all emerging markets, note that Asia has emerged not just unscathed, but as one of the best performing regions of the world. Among the developed markets, the UK is the worst performer, perhaps dragged down by the continued uncertainty of how Brexit will play out. A better explanation would be that these are regions heavily dependent on natural resource and infrastructure businesses, and as we will see in the next section, those have been adversely affected by this crisis. In addition, since these returns are in US dollars, currency movements add to the effect, with depreciating (appreciating) currencies, against the dollar, worsening (improving) returns. Building on the theme that damage has varied across sections, I break down aggregate market cap by sectors, on February 14 and November 20, in the graph below (also with percent changes over the period:
Download data

Again, the shift in value is clear and decisive, with consumer discretionary, technology and health care gaining at the expense of energy, real estate, utilities and financials. Put simply, capital light businesses have gained at the expense of capital intensive ones, and breaking down sectors into finer industry detail, emphasizes this shift, with the ten best and worst performing industries below:
Download data

In an earlier post, I connected this value shift across industries to corporate life cycles, noting that younger, higher growth companies have gained value at the expense of older, more mature businesses, as can be seen in the tables below, where I break down the value change across companies, first by age, and then by expected revenue growth rate, into deciles:
Download corporate age data & revenue growth data

The youngest companies have gained value over this crisis, whereas the oldest companies have lost value, and high growth companies have benefited at the expense of low growth firms. As this shift has occurred, it is not surprising that the stocks most favored by value investors (low PE/PBV, high dividends) have underperformed the stocks that are most favored by growth investors. I capture this in the table below, where I first look at value changes across companies, first classified across PE ratios and then across dividend yields:
Download PE decile data & Dividend decile data
Value investors have also warned us over the last decade about two trends in corporate behavior, an increase in debt loads at some companies and a surge in stock buybacks. To evaluate whether those warnings were justified, I looked at companies classified by debt load (net debt to EBITDA) into deciles and computed value changes between February 14 and November 1.
Download data

On this front, I think that the message is clear that the more indebted a company, the more exposed it was to damage during this crisis. On the buyback front, the results are a little murkier. In the graph below, I look at value changes for four groups of companies, (1) those that returned no cash at all in 2019 (no dividends or buybacks), (2) those that paid only dividends, (3) those that returned cash in the form of buybacks and (4) those that did both:


There is a muddled message in this graph. While companies that returned no cash to their shareholders in 2019 fared better overall than companies that returned cash (either in dividends or in buybacks) in 2019, companies that returned cash only in the form of buybacks recovered faster and more completely the companies that paid only dividends. Companies that both paid dividends and bought back stock did worst of all. If flexibility is key to surviving a crisis, it is possible that this crisis will make companies more reluctant to return cash, in general, and when they do, it is also more likely that you will see that cash returned in the form of buybacks than dividends, since the former are easily retracted but the latter are sticky.

Finally, no post on US equities is complete without a mention of the FANGAM stocks, a topic that I focused on in my last post. Updating the numbers through November 1, here is how these six companies have performed over the crisis, relative to the rest of the market:
Download data

As you can see, the FANGAM stocks have added $1.25 trillion in aggregate market cap since February 14, while all other US equities have shed $1.32 trillion over that period. If the market has almost fully recovered from its early swoon, the credit has to go almost entirely to these six companies.

The Resilient Risk Capital Thesis
The best way to summarize how this crisis has affected companies is to summarize the value transfer from what would be consider "risk on" categories (young, high growth, high PE, low or no dividends and high debt) to "risk off" categories (old, low growth, low PE, high dividends and low debt), looking at the top and bottom deciles of each grouping:

Note that in almost every category, other than debt, the "risk on" group gained value at the expense of the "risk off" group. One explanation that I offered in my post from a  few weeks ago was that, unlike prior crises, risk capital (defined as capital invested in the highest risk assets, such as venture capital and investments in below investment grade bonds) has stayed in the game, as can be seen in the behavior of VC fund flows and issuances of high yield bonds (updated to include the third quarter of 2020):

In fact, it is this resilience of risk capital that explains why the equity risk premium for the S&P 500, which soared in the first five weeks of this crisis, has reverted back to pre-crisis levels:
Download data

Put simply, markets, for better or worse, seem to be sending the message that the fear factor of the crisis has passed, though earnings and cash flows will need to be tweaked.

Market Assessment: Predictive Mechanism or Animal Spirits
As markets have risen over the last few months, there has been a fair amount of hand wringing about animal spirits and irrational exuberance driving markets higher. Some of this concern has come from the clear disconnect between stocks going up and economic malaise, but I noted that this is neither unusual nor unexpected, using this graph of stock returns and real GDP growth, by quarter:

Download data
Looking at the quarterly data over the last 60 years, there has been little to no relationship between stock returns in a quarter and the GDP change in that quarter, and if there is one, it is mildly negative, i.e., stocks are  slightly more likely to go up (down) in a quarter when GDP is down (up). While that may surprise some people, it is entirely understandable, when you recognize that stock markets are predictive mechanisms, and that is borne out by the data, with stock returns becoming positively correlated with GDP growth in future quarters. Note that while the correlation increases as you look three or four quarters ahead, it flattens out at about 0.26 indicating that markets are noisy predictors; they are wrong as often as they are right, but given a choice between trusting markets and going with market gurus, I will take the former every single time.

There is a debate to be had about whether markets have over adjusted to the possibility of a vaccine and the economy reopening, and to address that question, I decided to value the S&P 500 again; I did value it on June 1, 2020 and found it to be close to fairly valued. I revisited my assumptions, updating my estimates of earnings for the index in the near years (2020, 2021 and 2022), where the bulk of the damage from this crisis will be done.

Note that in the intervening five months, since my last valuation, analysts tracking the index have become more optimistic about earnings in 2020 and 2021. The resulting valuation reflects these improved estimates:

Download spreadsheet
Based upon my inputs, I arrive at a value for the index of just over 3100, which would make stocks mildly over valued. I also followed up with a simulation of this valuation, based upon distributions for my key inputs, and the results are below:
Download spreadsheet with simulation results

The simulation reinforces the findings in the base case valuation. You could make a case that stocks are over valued, and that case will be built on the premise that the economic damage from this crisis will be much greater and long lasting that analysts believe. However, if your argument is that markets have gone crazy and that nothing explains stock prices, you may want to evaluate that view, and consider at least the possibility that your world view (about how the economy will recover and the virus will play out) is wildly at odds with the market consensus. That leaves open the unpleasant possibility that it is you that is being irrational and wrong, not the market.

Crisis as Crucible: Lessons learned, unlearned and relearned
Every crisis is a crucible, exposing what we don't know and putting our faith to the test. This one has been no different, and while I will not tell you that I have enjoyed it, I have learned some lessons from it.
  • Respect markets, even if you disagree with them: Markets are not all knowing and they are definitely not efficient, but they are extraordinary platforms for conveying a consensus view of the future. While you and I may disagree with the market view, and markets can be wrong, it behooves us all to at least try and understand the message that it delivers.
  • Time to move on: For many managers and investors, the COVID crisis is a reminder, sometimes in painful terms, that we are now well into the 21st century and continuing to use tools, techniques and metrics that were developed and tested on 20th century data is a recipe for disaster. That was the underlying message in my posts on value investing from last month.
  • Importance of Flexibility: If you look across what companies that have done well during this crisis share in common, it is flexibility, with companies that can adapt quickly to new circumstances improving their odds of winning. In the same vein, it seems self defeating for companies to borrow too much or lock themselves into paying large dividends, since both reduce their capacity to respond quickly to changed circumstances.
All in all, it has been an interesting roller coaster ride over these last few months, and I am glad that you were able to join me for at least some of the ride. It is definitely not over, but I have a feeling it is time for me to move on. There are other attractions at this fair!

YouTube Video

Data

  1. Market data (November 1, 2020)
  2. Regional breakdown - Market Changes (November 1, 2020)
  3. Country breakdown - Market Changes (November 1, 2020)
  4. Sector breakdown - Market Changes (November 1, 2020)
  5. Industry breakdown - Market Changes (November 1, 2020)
  6. PE breakdown - Market Changes (November 1, 2020)
  7. PBV breakdown - Market Changes (November 1, 2020)
  8. Dividend Yield breakdown - Market Changes (November 1, 2020)
  9. Cash Return breakdown - Market Changes (November 1, 2020)
  10. Age breakdown - Market Changes (November 1, 2020)
  11. Revenue Growth breakdown - Market Changes (November 1, 2020)
  12. Debt load breakdown - Market Changes (November 1, 2020)
Spreadsheets

Viral Market Update Posts


Friday, October 23, 2020

Value Investing III: Requiem, Rebirth or Reinvention?

If you have had the endurance to make your way through my first two posts on value investing, I compliment you on your staying power, but I am sure that, if you are a value investor, you have found my take on it to be unduly negative. In this, my third post, I want to explain why value investing is in trouble and point to ways in which it can be reinvented, to gain new life. I am sure that many of you will disagree both with my diagnosis and my solutions, but I welcome your points of view.

Value Investing: Has it lost its way?

I have never made the pilgrimage to the Berkshire Hathaway meetings, but I did visit Omaha, around the time of the annual meeting, a few years ago, to talk to some of the true believers who had made the trek. I do not think that I will be invited back again, because I argued in harsh terms that value investing had lost its way at three levels.

  1. It has become rigid: In the decades since Ben Graham published Security Analysis, value investing has developed rules for investing that have no give to them. Some of these rules reflect value investing history (screens for current and quick ratios),  some are a throwback in time, and some just seem curmudgeonly. For instance,  value investing has been steadfast in its view that companies that do not have significant tangible assets, relative to their market value, and that view has kept many value investors out of technology stocks for most of the last three decades. Similarly, value investing's focus on dividends has caused adherents to concentrate their holdings in utilities, financial service companies and older consumer product companies, as younger companies have shifted away to returning cash in buybacks. 
  2. It has become ritualistic: The rituals of value investing are well established, from the annual trek to Omaha, to the claim that your investment education is incomplete unless you have read Ben Graham's Intelligent Investor and Security Analysis to an almost unquestioning belief that anything said by Warren Buffett or Charlie Munger has to be right. 
  3. It has become righteous: While investors of all stripes believe that their "investing ways" will yield payoffs, some value investors seem to feel entitled to high returns because they have followed all of the rules and rituals. In fact, they view investors who deviate from the script as shallow speculators, but are convinced that they will fail in the "long term".

Put simply, value investing, at least as practiced by some of its advocates, has evolved into a religion, rather than a philosophy, viewing other ways of investing as not just misguided, but wrong and deserving of punishment. 

A New Paradigm for Value Investing

For value investing to rediscover its roots and reclaim its effectiveness, I believe that it has to change in fundamental ways. As I list some of these changes, they may sound heretical, especially if you have spent decades in the value investing trenches. 

  1. Be clearer about the distinction between value and price: While value and price are often used interchangeably by some market commentators, they are the results of very different processes and require different tools to assess and forecast.

    Value is a function of cash flows, growth and risk, and any intrinsic valuation model that does not explicitly forecast cash flows or adjust for risk is lacking core elements. Price is determined by demand and supply, and moved by mood and momentum, and you price an asset by looking at how the market is pricing comparable or similar assets. I am surprised that so many value investors seem to view discounted cash flow valuation as a speculative exercise, and instead pin their analysis on comparing comparing on pricing multiples (PE, Price to book etc.). After all, there should be no disagreement that the value of a business comes from its future cash flows, and the uncertainty you feel about those cash flows, and as I see it, all that discounted cash flow valuation does is bring these into the fold:


    It is true that you are forecasting future cash flows and trying to adjust for risk in intrinsic valuation, and that both exercises expose you to error, but I don't see how using a pricing ratio or a short cut makes that error or uncertainty go away. 
  2. Rather than avoid uncertainty, face up to it: Many value investors view uncertainty as "bad" and "something to be avoided", and it is this perspective that has led them away from investing in growth companies, where you have to grapple with forecasting the future and towards investing in mature companies with tangible assets. The truth is that uncertainty is a feature of investing, not a bug, and that it always exists, even with the most mature, established companies, albeit in smaller doses.

    While it is true that there is less uncertainty, when valuing more mature companies in stable markets, you are more likely to find those mistakes in companies where the uncertainty is greatest about the future, either because they are young or distressed, or because the macroeconomic environment is challenging. In fact, uncertainty underlies almost every part of intrinsic value, whether it be from micro to macro sources:

    To deal with that uncertainty, value investors need to expand their tool boxes to include basic statistical tools, from probability distributions to decision trees to Monte Carlo simulations
  3. Margin of safety is not a substitute risk measure: I know that value investors view traditional risk and return models with disdain, but there is nothing in intrinsic value that requires swearing allegiance to betas and modern portfolio theory. In fact, if you don't like betas, intrinsic valuation is flexible enough to allow you to replace them with your preferred measures of risk, whether they be based upon earnings, debt or accounting ratios.

    For those value investors who argue that the margin of safety is a better proxy for risk, it is worth emphasizing that the margin of safety comes into play only after you have valued a company, and to value a company, you need a measure of risk. When used, the margin of safety creates trade offs, where you avoid one type of investment mistake for another:

    As to whether having a large MOS is a net plus or minus depends in large part on whether value investors can afford to be picky. One simply measure that the margin of safety has been set too high is a portfolio that is disproportionately in cash, an indication that you have set your standards so high that too few equities pass through. 
  4. Don't take accounting numbers at face value: It is undeniable that value investing has an accounting focus, with earnings and book value playing a central role in investing strategies. There is good reason to trust those numbers less now than in decades past, for a few reasons. One is that companies have become much more aggressive in playing accounting games, using pro forma income statements to skew the numbers in their favor. The second is that as the center of gravity in the economy has shifted away from manufacturing companies to technology and service companies, accounting has struggled to keep up. In fact, it is clear that the accounting treatment of R&D has resulted in the understatement of book values of technology and pharmaceutical companies. 
  5. You can pick stocks, and be diversified, at the same time: While not all value investors make this contention, a surprisingly large number seem to view concentrated portfolios as a hallmark of good value investing, arguing that spreading your bets across too many stocks will dilute your upside. The choice of whether you want to pick good stocks or be diversified is a false one, since there is no reason you cannot do both. After all, you have thousands of publicly traded stocks to pick from, and all that diversification requires is that rather than put your money in the very best stock or the five best stocks, you should hold the best thirty or forty stocks. My reasoning for diversification is built on the presumption that any investment, no matter how well researched and backed up, comes with uncertainty about the payoff, either because you missed a key element when valuing the investment or because the market may not correct its mistakes. In a post from a few years ago, I presented the choice between concentration and diversification in terms of those two uncertainties, i.e., about value and the price/value gap closing:


    I think that value investors are on shaky ground assuming that doing your homework and focusing on mature companies yield precise valuations, and on even shakier ground, when assuming that markets correct these mistakes in a timely fashion. In a market, where even the most mature of companies are finding their businesses disrupted and market momentum is augmented by passive trading, having a concentrated portfolio is foolhardy.
  6. Don't feel entitled to be rewarded for your virtue: Investing is not a morality play, and there are no virtuous ways of making money. The distinction between investing and speculating is not only a fine one, but very much in the eyes of the beholder. To hold any investing philosophy as better than the rest is a sign of hubris and an invitation for markets to take you down. If you are a value investor, that is your choice, but it should not preclude you from treating other investors with respect and borrowing tools to enhance your returns. I will argue that respecting other investors and considering their investment philosophies with respect can allow value investors to borrow components from other philosophies to augment their returns. 
Moving Forward
Investors, when asked to pick an investment philosophy, gravitate towards value investing, drawn by both its way of thinking about markets and its history of success in markets. While that dominance was unquestioned for much of the twentieth century, when low PE/PBV stocks earned significantly higher returns than high PE/PBV stocks, the last decade has shaken the faith of even diehard value investors. While some in this group see this as a passing phase or the result of central banking overreach, I believe that value investing has lost its edge, partly because of its dependence on measures and metrics that have become less meaningful over time and partly because the global economy has changed, with ripple effects on markets. To rediscover itself, value investing needs to get over its discomfort with uncertainty and be more willing to define value broadly, to include not just countable and physical assets in place but also investments in intangible and growth assets.

YouTube Video