Sunday, May 7, 2023

Good (Bad) Banks and Good (Bad) Investments: At the right price...

In my last post, I looked at banking as a business, and used  a simple banking framework to advance the notion that the key ingredient tying together the banks that have failed so far in 2023 is an absence of stickiness in deposits, created partially by depositor and deposit characteristics (older are  stickier than younger) and partly by growth in deposits (high growth increases stickiness). I also used the banking framework to argue that good banks have stickier deposits, with a higher precent of these deposits being non-interest bearing, that they invest in loans and investment securities on which they earn interest rates that cover and exceed the default risk in these investments. While differentiating between good and bad banks can be straightforward, it does not follow that buying good banks and selling bad banks is a good investment strategy, since its success depends entirely on what the market is incorporating into stock prices. An investor who buys a good bank at too high a price, given its goodness, will underperform one who buys a bad bank at too low a price, given its badness. In this post, I will begin by looking at  how to value banks and follow up with an examination of investor views of banking have changed, by looking at pricing, before examining divergences in how banks are priced in the market today.

The Intrinsic Value of Bank Equity

   I am a dabbler in all things valuation-related, and I find the process fascinating, as stories about businesses get translated into valuation inputs, and finally into value. I enjoy challenging valuations, but banks remain, at least for me, the last frontier in valuation, simply because so much of what we do in conventional valuation does not work with banks, and a crisis or panic can upend even the most carefully done bank valuation.

All Equity, All the time!

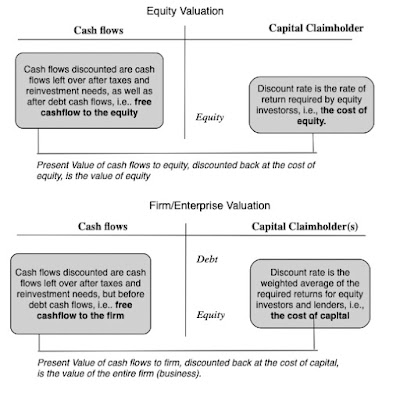
    With most non-financial service businesses, you face a choice in how you approach valuation. You can value the enterprise or the entire business, focusing on valuing the operations or assets of the business, and consider capital as inclusive of both debt and equity. Alternatively, you can value just the equity in the business, focusing on cash flows left over after debt payments and discounting back at a rate of return that reflects the risk that equity investors face:

With banks, this choice does not exist, since debt to a bank can be expansively defined to include deposits as well, making it effectively raw material for the bank's operations, where the objective is borrow money (from depositors and lenders) at a low rate and lend it out or invest it at a higher rate. Consequently, you can only value the equity in a bank, and by extension, the only pricing multiples you can use to price banks are equity multiples (PE, Price to Book etc.).  The notion of computing a cost of capital for a bank is fanciful and fruitless, and any attempt to compute an enterprise value for a bank is destined to end in failure.

Equity Valuation 101 and Dividend Discount Model

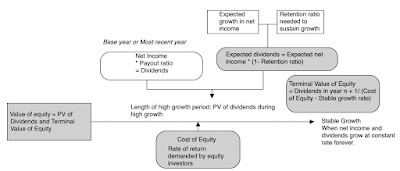
    Staying on equity valuation, the intrinsic value of equity can be written as a function of the cash flows left for equity investors, after reinvestment and taxes, and after all other claim holders have been paid, and the cost of equity:


Over the decades, analysts trying to put this model into practice with banks have run into trouble estimating cash flows for banks, using the traditional structure, since items like capital expenditures and working capital are impossible to measure at banks. It should come as no surprise that, at least with banks, analysts fell back on the only observable cash flows to equity, i.e., dividends;


It is this line of reasoning, i.e., that it is difficult, if not impossible, to estimate banking free cashflows to equity, that I used prior to 2008, when I argued for the use of the dividend discount model to value banks In using the dividend discount model, I was making two implicit assumptions. The first was that banks were run by sensible people, who paid out what they could afford to in dividends, neither holding back on paying dividends nor paying too much in dividends. The other was that the bank regulatory framework operated effectively, preventing banks from overreaching on risk or being under capitalized. 

A Bank FCFE Model

    The events of 2008 dispelled me of both delusions that allowed for the use of the dividend discount model, as it became clear that the managers of banks were anything but sensible and the regulatory framework had large holes in it that were exploited. In the years after, I have replaced dividends with a variant on free cash flow to equity, defined through the lens of a banking business, discounted back at a cost of equity reflecting banking risks (duration mismatches, low regulatory capital and riskiness of loan/investment portfolios).

Note the differences between the bank FCFE and bank dividend discount models. 

  • The first is that unlike dividends, which are floored at zero, the free cash flow to equity for a growing or severely undercapitalized bank can be negative, reflecting the need to raise fresh equity to survive. 
  • The other is that by tying cashflows to capitalization, it allows us to bring in that same factor into risk and costs of equity, with under capitalized banks have higher costs of equity. 
  • As a final component of bank equity value, and 2023 has brought this home to us is the reality that even a healthy, profitable bank can see its value melt away in days, if its depositors decide, for good, bad or no reasons at all, to withdraw their deposits and put the bank into the death spiral from which recovery can be close to impossible. Since this risk is existential, it is almost impossible to build into a discounted cash flow model, which is for a going-concern, and has to be incorporated as a risk of failure.
In short, the banking version of a FCFE model gives us access to levers that allow us to differentiate across banks and bring in the elements that make some banks better than others.

Valuing Citi

    Intrinsic valuation models connect only when applied to real companies, and in the table below, I used the Bank FCFE model described above in my valuation of Citi (a choice that may strike you as odd, but which you will understand if you read the rest of my post). To set the table, in the battle of big banks for investor acclaim, Citi has clearly lost the battle not only against JP Morgan Chase, but against most of the other big US banks. It has delivered low growth and subpar profitability, but it has built up buffers in its capital ratios and still has a banking model that delivers a lucrative interest rate spread.

    In my valuation, I will assume that Citi will continue on its cautious, low-growth path, growing its risk-adjusted assets at 3% a year in perpetuity, a little lower than its 3.74% growth rate over the last 5 years. Over time, I expect some improvement in the return on equity, which was 8.78% in 2022, to its five-year average of 9.50%, which is still lower than the cost of equity of 11.67% that I am using for large commercial banks (see picture below for how I am computing an implied cost of equity for the 25 largest banks). Finally, I will assume that the bank will continue to marginally improve its Tier 1 capital ratio, currently at 14.80% to reach a target of 15.00%, in five years:

Download spreadsheet to value Citi (or any bank)

Note that the combination of low growth and a healthy, current regulatory capital ratio keep the needs for reinvesting in regulatory capital low, allowing for large potential dividends. Those high cash flows, even though they are delivered by a bank that earns and expects to continue to earn an ROE less than its cost of equity translate into a value of equity for Citi of about $69, making it about 32% under valued auto the stock price of $46.32, at close of trading on May 5, 2023. Obviously, you will have very different views about Citi than I do, and you are welcome to download the spreadsheet and input your numbers not just for Citi, but for any bank.

The Pricing of Bank Equity

    You have heard me say this before, but I don't think there is any harm in repeating this. Value and price are words that are often used interchangeably, but they come from different processes and can yield different numbers for the same asset or company. 

Since pricing requires comparison across companies, often with different units (numbers of shares outstanding), we generally convert market values into pricing multiples, to allow for this comparison. As we noted in the last section, the pricing multiples that we use to compare banks have to be equity multiples, with price earnings rations and price to book ratios being the most common choices. 

Price to Book Ratio: Choice and Drivers

   There is no sector where price to book ratios get used more than in banking and financial services, for two reasons. The first is that the book value of equity for a bank, by becoming the basis for regulatory capital, has operating consequences, since actions or events that lower than book value of equity (an unexpected loss, a regulatory fine, a trading shortfall) can cause a bank to become undercapitalized and go out of business. The other is that marking to market is more common in banks than at other sectors, the hold-to-maturity loophole notwithstanding, and that should make book value of equity a more meaningful figure than book value of equity at a software or a consumer product company. 

    To use the price to book ratio to price banks, I begin by identifying its drivers, and that is simple to do, if you start with an intrinsic equity valuation model. In fact, using the simplest equity valuation model that I can think of, which is a stable growth dividend discount model, we get:


Dividing both sides by book value of equity, and setting growth rate = (1- Payout ratio) ROE, we can simplify this equation:

This equation, in its simple, stable growth form, suggests that whether a bank trades at below or above its book value of equity will be driven by whether investors expect banks to earn more than their cost of equity (price to book>1), roughly the cost of equity (price to book = 1) or less than the cost of equity (price to book <1).

Price to Book for Banks: Over time

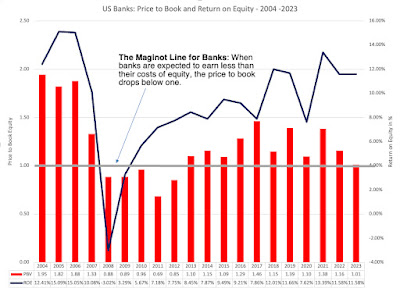
    To get a measure of how banks are being priced today, it is worth getting perspective as to how investor views on bank profitability and risk have changed over time. To gain this perspective, I looked at the aggregated price to book ratio of all US banks, obtained by first aggregating the market capitalizations of all banks and dividing by the aggregated book equity from 2004 to 2022, at the end of each year, and in May 2023:


If there is a lesson in the graph, it is that the 2008 crisis has left a lasting impression, as US banks have struggled since that crisis to elevate price to book ratios. Even as returns on equity have slowly recovered close to pre-2008 levels, the price to book ratios have not recovered, even as the rest of the market has seen rising price to book ratios, due to lower interest rates. In fact, the 2023 crisis has reduced the aggregate price to book ratio for US banks to close to one, the Maginot line below which investors are assuming that banks will generate return on equity roughly equal to their cost of equity in the long term.
    For some, this drop in price to book ratios over time is a sign of market overreaction, and there are some value investors who have overweighted their bank holdings as a consequence. That may very well be the case, but I think it is prudent to see if there are fundamental reasons for the shift:
  • Higher Risk: One explanation is that investors perceive banks to be riskier than they were prior to 2008, and at first sight, that seems puzzling since banks have become better capitalized over the last decade, as the regulatory authorities have reacted to the 2008 crisis by tightening safety capital requirements: 

    As you can see the Tier 1 capital at US banks collectively has risen to 13-14% from 10-11% in the years leading into the 2008 crisis and after. It is true, though, that equity as a percent of total assets dipped especially in 2020 and 2021, before bouncing back, but even that statistic has shown little change over the decade.
  • Lower Profitability: Another is that investors don't trust net income reported by banks as final numbers, given the propensity of some banks to surprise them with after-the fact and unexpected losses (from trading mistakes and asset write-downs) or believe that banks are becoming less profitable over time. To see if this is the case, I looked at the interest income and expenses over time at banks:

    Like the book equity, the spread dropped in 2020 and 2021, with 2022 showing a recovery. However, as interest rates have risen, it is likely that rates on deposits will rise faster than rates earned on loans and investments in the near term, perhaps a source of concern for investors.
  • Business Economics; If banks are not more risky, at least collectively, and interest spreads have held their own, the only remaining explanation is that investors believe that the banking business is much less likely to be value-adding now than two decades ago. Almost every aspect of banking is under stress, with deposits becoming less sticky, increased competition for the loan business from fintech and other disruptors and increased risks of contagion and crisis, and while banks remain profitable on the surface, investors have good reason to wonder whether the good times will last.
I know that a contrarian take, especially after the last few months, would suggest investing in banking as a sector, but I believe that the long term trends for the business are negative.

The Pricing of Banks - Across Banks

    Even though I would not make a collective bet on banks collectively, I do believe that, as in any crisis, individual banks are getting mis-placed. Thus, as investors panic and sell regional banks, it is likely that good regional banks and lumped in bad ones, in the sell off,  and if that money is being redirected to the bigger banks, some of those banks may not merit the price increases. Staying with price to book as my pricing metric for banks, I looked at the distribution of price to book ratios across banks, both at the end of 2022, and in May 2023, as the banking crisis has unfolded:


As you can see, the crisis has lowered price to book ratios across the board, with the median price to book ratio dropping from 1.12 at the end of 2022 to 0.94 in May 2022. That decline is almost entirely the result of a decline in market capitalization, since the book values of equity for banks were little changed between the third quarter of 2022 (used for the end of 2022 calculation) and the end of 2022 (used for the May 2023 calculation).

    Since the key driver of price to book ratio is the return on equity, I looked at the distribution of returns on equity at US banks in 2021 and 2022:


Unlike companies in other sectors, where there are wide variations across companies, the returns on equity at banks is tightly clustered, with 50% of banks having 9.38% (9.24%) and 14.80% (13.75%) in 2021 (2022). However, there are clearly banks that generate higher returns on equity than other banks, and that should play a role in explaining differences in price to book ratios. To check how closely price to book ratios at banks hew to the returns on equities generated by banks, I did a scatter plot of price to book against ROE, both at the end of 2022 and again in May 2023:


While banks with higher ROE generally trade at higher price to book ratios, there is significant noise in the relationship, though more in May 2023 (with an R squared just above 11%) than in December 2022 (with an R squared just above 14%). In a final visual display, I looked a 3D scatter plot, of PBV against ROE and Tier 1 capital ratios:


I have highlighted the combination that characterizes the most under valued banks (low price to book, high ROE and a high Tier 1 capital ratio) as well as the combination for the most over valued banks (high price to book, low ROE and low Tier 1 capital

The Biggest Banks- Trawling for Bargains!

    One of the exercises that I find useful, when pricing,  is to look for the perfect underpriced stock, one that looks cheap with no good reason for why it is so cheap. Applying that practice to banks, here is what you would want to see in your underpriced bank:

Applying this approach to the 25 largest banks, for instance, I computed the median values for each of these variables for the 25 largest US banks, in terms of market cap, and used it as the dividing line for good and bad on each of the variables. Thus, a return on equity higher than the median of 12% is considered a good (and in green) and less than 12% is considered bad (and in red). 
Source: S&P Capital IQ

Put simply, you are looking for a preponderance of green numbers for your under priced banks, and while there no all green banks, Citi comes closest to meeting the tests,  scoring well on risk (with a higher than median Tier 1 capital ratio and a lower percent of securities held to maturity among the five biggest banks), deposit stickiness (with low deposit growth) and  trades at half of book value (the lowest price to book ratio). Its weakest link is a return on equity of 8.11% (in 2022) and 9.50% (average from 2018-2022), lower than the median for US banks, and while that would suggest a lower than median price to book ratio, the discount at Citi exceeds that expectation. Citi's banking business, though slow growing, remains lucrative with the higher interest rate spread in this sample. I will be adding Citi to my portfolio, since it offers the best mix of cheapness and low risk, and hope that it can at least maintain its profitability, though an increase would be icing on the cake. It is a slow-growth, stodgy bank that seems to be priced on the presumption that it will not only never earn a ROE even close to its cost of equity, and that makes it a good investment. 
    At the other end of the expectation scales, JP Morgan Chase scores well on operating metrics, with a high ROE, low deposit growth and a high Tier 1 capital ratio, but it trades at a much higher price to book ratio than the other banks, and iwith a lower dividend yield. I have owned JPM Chase for close to a decade in my portfolio, and I don't see anything in this table that would lead me to sell, though I would not be in a hurry to buy either, at today's prices, if I did not own it.
    As a value investor, I would be uncomfortable making an investment in Citi, purely based upon this pricing analysis, and it is for that reason that I retraced my steps to do the intrinsic valuation of the bank that you saw in the last section. That reinforces a more general point that even investors who are true believers in valuation can benefit from understanding and using pricing, just as traders, who play the pricing game, can benefit from an understanding of the core principles of intrinsic valuation.

Wrapping up
In my last post, my focus was on the qualities that made for the distinction between good and bad banks, and those qualities includes deposit stickiness, a low interest rate on deposits combined with a high interest rate (given default risk) on loans and investments and a big buffer against shocks (with high book equity and Tier 1 capital ratios). In this post, I  shifted attention to the investing side of the picture, and that puts the price you pay to acquire banks on center stage. Acquiring a good bank, while paying too high a price, will make for a bad investment, just as acquiring a bad bank, at a bargain price, will be a good investment. On the contest of banking quality, JP Morgan Chase would beat Citi handily, with a high return on equity and continued growth, combined with safety, but in the contest for investing dollars, Citi is the better priced bank. Since I will have both stocks in my portfolio starting tomorrow, I will have a ringside seat to watch this contest play out over the next few years.

YouTube Video


Posts on the Banking Crisis 2023

  1. Breach of Trust: Decoding the Banking Crisis (of 2023)
  2. Good (Bad) Banks and Good (Bad) Investments: At the right price...

Bank Valuation Spreadsheet
  1. Bank Valuation Spreadsheet (with Citi Valuation)

Friday, May 5, 2023

Breach of Trust: Decoding the Banking Crisis

In March 2023, the fall of Silicon Valley Bank shocked investors not only because it was unforeseen, but also because of the speed with which it unfolded. That failure has had a domino effect, with Signature Bank falling soon after, followed by Credit Suisse in April 2023 and by First Republic last week. The banks that have fallen so far collectively controlled more deposits than all of the banks that failed in 2008, but unlike that period, equity markets in the United States have stayed resilient, and even within banking, the damage has varied widely across different segments, with regional banks seeing significant draw downs in deposits and market capitalization. The overarching questions for us all are whether this crisis will spread to the rest of the economy and market, as it did in 2008, and how banking as a business, at least in the US, will be reshaped by this crisis, and while I am more a dabbler than an expert in banking, I am going to try answering those questions.

The Value of a Bank

    Banks have been an integral part of business for centuries, and while we have benefited from their presence, we have also been periodically put at risk, when banks over reach or get into trouble, with their capacity to create costs that the rest of us have to bear. After every banking crisis, new rules are put into place to reduce or minimize these risks to the economic system, but in spite of these rules or sometimes because of them, there are new crisis. To understand the roots of bank troubles, it is important that we understand how the banking business works, with the intent of creating criteria that we can use to separate good banks from average or bad ones.

The Banking Business Model

    The banking business, when stripped down to basics, is a simple one. A bank collects deposits from customers, offering the quid quo pro of convenience, safety and sometimes interest income (on those deposits that are interest-beating) and either lends this money out to borrowers (individuals and businesses), charging an interest rate that is high enough to cover defaults and leave a surplus profit for the bank. In addition, banks can also invest some of the cash in securities, usually fixed-income, and with varying maturities and degrees of default risk, again earning income from these holdings. The profitability of a bank rests on the spread between its interest income (from loans and financial investments) and its interest expenses (on deposits and debt), and the leakages from that spread to cover defaulted loans and losses on investment securities:


To ensure that a bank survives, it's owners have to hold enough equity capital to buffer against unanticipated defaults or losses. 

The Bank Regulators

    If you are wondering where bank regulators enter the business model, it is worth remembering that banks predate regulators, and for centuries, were self regulated, i.e., were responsible for ensuring that they had enough equity capital to cover unexpected losses. Predictably, bank runs were frequent and the banks that survived and prospered set themselves apart from the others by being better capitalized and  better assessors of default risk than their competition. In the US, it was during the civil war that the National Banking Act was passed, laying the groundwork for chartering banks and requiring them to maintain safety reserves. After a banking panic in 1907, where it fell upon J.P. Morgan and other wealthy bankers to step in and save the system, the Federal Reserve Bank was created in 1913. The Great Depression gave rise to the Glass-Steagall Act in 1933 which restricted banks to commercial banking, with the intent of preventing them from investing their deposit money in riskier businesses. The notion of regulatory capital has always been part of bank regulation, with the FDIC defining "capital adequacy" as having enough equity capital to cover one-tenth of assets. In subsequent decades, these capital adequacy ratios were refined to allow for risk variations across banks, with the logic that riskier assets needed more capital backing than safer ones. These regulatory capital needs were formalized and globalized after the G-10 countries created the Basel Committee on Banking Supervision and explicitly created the notions of "risk-weighted assets" and "Tier 1 capital", composed of equity and equity-like instruments, as well as specify minimum capital ratios that banks had to meet to continue to operate. Regulators were given punitive powers, ranging from restrictions of executive pay and acquisitions at banks that fell below the highest capitalization ranks to putting banks that were undercapitalized into receivership.

    The Basel accord and the new rules on regulatory capital have largely shaped banking for the last few decades, and while they have provided a safety net for depositors, they have also given rise to a dangerous game, where some banks arrived at the distorted conclusion that their end game was exploiting loopholes in regulatory capital rules, rather than build solid banking businesses. In short, these banks found ways of investing in risky assets that the regulators did not recognize as risky, either because they were new or came in complex packages, and using non-equity capital (debt and deposits), while getting that capital classified as equity or equity-like for regulatory purposes. The 2008 crisis  exposed the ubiquity and consequences of this regulatory capital game, but at great cost to the economy and tax payers, with the troubled assets relief program (TARP) investing $426 billion in bank stocks and mortgage-backed securities to prop up banks that had over reached, mostly big, money-center banks, rather than small or regional banks. The phrase "too big to fail" has been over used, but it was the rationale behind TARP and is perhaps at the heart of today's banking crisis.

Good and Bad Banks

    If the banking business is a simple one, what is that separates good from bad banks? If you look back at the picture of the banking business, you can see that I have highlighted key metrics at banks that can help gauge not just current risk but their exposure to future risk. 

  1. Deposits: Every banks is built around a deposit base, and there are deposit base characteristics that clearly determine risk exposure. First, to the extent that some deposits are not interest-bearing (as is the case with most checking accounts), banks that have higher percentages of non-interest bearing deposits start off at an advantage, lowering the average interest rate paid on deposits. Second, since a big deposit base can very quickly become a small deposit base, if depositors flee, having a stickier deposit base gives a bank a benefit. As to the determinants of this stickiness, there are numerous factors that come into play including deposit size (bigger and wealthier depositors tend to be more sensitive to risk whispers and to interest rate differences than smaller ones), depositor homogeneity (more diverse depositor bases tend to be less likely to indulge in group-think) and deposit age (depositors who have been with a bank longer are more sticky). In addition to these bank-specific characteristics, there are two other forces that are shaping deposit stickiness in 2023. One is that the actions taken to protect the largest banks after 2008 have also tilted the scales of stickiness towards them, since the perception, fair or unfair, among depositors, that your deposits are safer at a Chase or Citi than they are at a regional bank. The other is the rise of social media and online news  made deposits less sticky, across the board, since rumors (based on truth or otherwise) can spread much, much faster now than a few decades ago.
  2. Equity and Regulatory Capital: Banks that have more book equity and Tier 1 capital have built bigger buffers against shocks than banks without those buffers. Within banks that have high accumulated high amounts of regulatory capital, I would argue that banks that get all or the bulk of that capital from equity are safer than those that have created equity-like instruments that get counted as equity. 
  3. Loans: While your first instinct on bank loans is to look for banks that have lent to safer borrowers (less default risk), it is not necessarily the right call, when it comes to measuring bank quality. A bank that lends to safe borrowers, but charges them too low a rate, even given their safer status, is undercutting its value, whereas a bank that lends to riskier borrowers, but charges them a rate that incorporates that risk and more, is creating value. In short, to assess the quality of a bank's loan portfolio, you need to consider the interest rate earned on loans in conjunction with the expected loan losses on that loan portfolio, with  a combination of high  (low) interest rates on loans and low (high) loan losses characterizing good (bad) banks. In addition, banks that lend to a more diverse set of clients (small and large, across different business) are less exposed to risk than banks that lend to homogeneous clients (similar profiles or operate in the same business), since default troubles often show up in clusters.
  4. Investment Securities: In the aftermath of the 2008 crisis, where banks were burned by their holdings in riskier mortgage-backed securities, regulators pushed for more safety in investment securities held by banks, with safety defined around default and liquidity risk. While that push was merited, and banks with safer and more liquid holdings are safer than banks with riskier, illiquid  holdings, there are two other components that also determine risk exposure. The first is the duration of these securities, relative to the duration of the deposit base, with a greater mismatch associated with more risk. A bank that is funded primarily with demand deposits, which invests in 10-year bonds, is exposed to more risk than if invests in commercial paper or treasury bills. The second is whether these securities, as reported on the balance sheet, are marked to market or not, a choice determined (at least currently) by how banks classify these holdings, with assets held to maturity being left at original cost and assets held for trading, being marked to market. As an investor, you have more transparency about the value of what a company holds and, by extension, its equity and Tier 1 capital, when securities are marked to market, as opposed to when they are not.
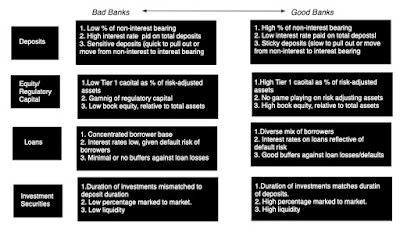
At the risk of over simplifying the discussion, the picture below draws a  contrast between good and bad banks, based upon the discussion above:

Banks with sticky deposits, on which they pay low interest rates (because a high percentage are non-interest bearing) and big buffers on equity and Tier 1 capital, which also earn "fair interest rates", given default risk, on the loans and investments they make, add more value and are usually safer than banks with depositor bases that are sensitive to risk perceptions and interest rates paid, while earning less than they should on loans and investments, given their default risk. 

Macro Stressors

    While we can differentiate between good and bad banks, and some of these differences are driven by choices banks make on how they build their deposit bases and the loans and investments that they make with that deposit money, these differences are often either ignored or overlooked in the good times by investors and regulators. If often requires a crisis for both groups to wake up and respond, and these crises are usually macro-driven:

  1. Recessions: Through banking history, it is the economy that has been the biggest stressor of the banking system, since recessions increase default across the board, but more so at the most default-prone borrowers and investment securities. Since regulatory capital requirements were created in response to one of the most severe recessions in history (the Great Depression), it is not surprising that regulatory capital rules are perhaps most effective in dealing with this stress test.
  2. Overvalued Asset Classes: While banks should lend money using a borrower's earnings capacity as collateral, it is a reality that many bankers lend against the value of  assets, rather than their earning power. The defense that bankers offer is that these assets can be sold, if borrowers default, and the proceeds used to cover the outstanding dues. That logic breaks down when asset classes get overvalued, since the loans made against the assets can no longer be covered by selling these assets, if prices correct. This boom and bust cycle has long characterized lending in real estate, but became the basis for the 2008 crisis, as housing prices plunged around the country, taking down not just lenders but also holders of real-estate based securities. In short, when these corrections happen, no matter what the asset class involved, banks that are over exposed to that asset class will take bigger losses, and perhaps risk failure.
  3. Inflation and Interest Rates: Rising inflation and interest rates are a mixed blessing for banks. On the one hand, as rates rise, longer life loans and longer term securities will become less valuable, causing losses.. After all, the market price of even a default-free bond will change, when interest rates change, and bonds that were acquired when interest rates were lower will become less valuable, as interest rates rise. In most years, those changes in rates, at least in developed markets like the US, are small enough that they create little damage, but 2022 was an uncommon year, as the treasury bond rate rose from 1.51% to 3.88%, causing the price of a ten-year treasury bond to drop by more than 19%.

Put simply, every bank holding ten-year treasury bonds in 2022 would have seen a mark down of 19% in the value of these holdings during the year, but as investors, you would have seen the decline in value only at those few banks which classified these holdings as held for sale. That pain becomes worse with bonds with default-risk, with Baa (investment grade) corporate bonds losing 27% of their value. On the other hand, banks that have higher percentages of non-interest bearing deposits will gain value from accessing these interest-free deposits in a high interest world. The net effect will determine how rising rates play out in bank value, and may explain why the damage from the crisis has varied across US banks in 2023.

The Banks in Crisis

    It is worth noting that all of the pain that was coming from writing down investment security holdings at banks, from the surge in interest rates, was clearly visible at the start of 2023, but there was no talk of a banking crisis. The implicit belief was that banks would be able to gradually realize or at least recognize these losses on the books, and use the time to fix the resulting drop in their equity and regulatory capital. That presumption that time was an ally was challenged by the implosion of Silicon Valley Bank in March 2023, where over the course of a week, a large bank effectively was wiped out of existence. To see why Silicon Valley Bank (SVB)  was particularly exposed, let us go back and look at it through the lens of good/bad banks from the last section:

  1. An Extraordinary Sensitive Deposit Base: SVB was a bank designed for Silicon Valley (founders, VCs, employees) and it succeeded in that mission, with deposits almost doubling in 2021. That success created a deposit base that was anything but sticky, sensitive to rumors of trouble, with virally connected depositors drawn from a common pool and big depositors who were well positioned to move money quickly to other institutions. 
  2. Equity and Tier 1 capital that was overstated: While SVB's equity and Tier 1 capital looked robust at the start of 2023, that look was deceptive, since it did not reflect the write-down in investment securities that was looming. While it shared this problem with other banks, SVB's exposure was greater than most (see below for why) and explains its attempt to raise fresh equity to cover the impending shortfall.
  3. Loans: A large chunk of SVB's loan portfolio was composed of venture debt, i.e., lending to pre-revenue and money-losing firms, and backed up by expectations of cash inflows from future rounds of VC capital. Since the expected VC rounds are conditional on these young companies being repriced at higher and higher prices over time, venture debt is extraordinarily sensitive to the pricing of young companies. In 2022, risk capital pulled back from markets and as venture capital investments dried up, and down rounds proliferated, venture debt suffered. 
  4. Investment Securities: All banks put some of their money in investment securities, but SVB was an outlier in terms of how much of its assets (55-60%) were invested in treasury bonds and mortgage-backed securities. Part of the reason was the surge in deposits in 2021, as venture capitalists pulled back from investing and parked their money in SVB, and with little demand for venture debt, SVB had no choice but to invest in securities. That said, the choice to invest in long term securities was one that was made consciously by SVB, and driven by the interest rate environment in 2021 and early 2022, where short term rates were close to zero and long term rates were low (1.5-2%), but still higher than what SVB was paying its depositors. If there is an original sin in this story, it is in this duration mismatch, and it is this mismatch that caused SVB's fall.


In short, if you were building a bank that would be susceptible to a blow-up, from rising rates, SVB would fit the bill, but its failure opened the door for investors and depositors to reassess risk at banks at precisely the time when most banks did not want that reassessment done.

    In the aftermath of SVB's failure, Signature Bank was shut down in the weeks after and First Republic has followed, and the question of what these banks shared in common is one that has to be answered, not just for intellectual curiosity, because that answer will tell us whether other banks will follow. It should be noted that neither of these banks were as exposed as SVB to the macro shocks of 2022, but the nature of banking crises is that as banks fall, each subsequent failure will be at a stronger bank than the one that failed before.  

  • With Signature Bank, the trigger for failure was a run on deposits, since more than 90% of deposits at the bank were uninsured, making those depositors far more sensitive to rumors about risk. The FDIC, in shuttering the bank, also pointed to "poor management" and failure to heed regulatory concerns, which clearly indicate that the bank had been on the FDIC's watchlist for troubled banks.
  • With First Republic bank, a bank that has a large and lucrative wealth management arm, it was a dependence on those wealthy clients that increased their exposure. Wealthy depositors not only are more likely to have deposits that exceed $250,000, technically the cap on deposit insurance, but also have access to information on alternatives and the tools to move money quickly. Thus, in the first quarter of 2023, the bank reported a 41% drop in deposits, triggering forced sale of investment securities, and the realization of losses on those sales.
In short, it is the stickiness of deposits that seems to be the biggest indicator of banks getting into trouble, rather than the composition of their loan portfolios or even the nature of their investment securities, though having a higher percentage invested in long term securities leaves you more exposed, given the interest rate environment. That does make this a much more challenging problem for banking regulators, since deposit stickiness is not part of the regulatory overlay, at least at the moment. One of the outcomes of this crisis may be that regulators monitor information on deposits that let them make this judgment, including:
  1. Depositor Characteristics: As we noted earlier, depositor age and wealth can be factors that determine stickiness, with younger and wealthier depositors being less sticky that older and poorer depositors. At the risk of opening a Pandora's box, depositors with more social media presence (Twitter, Facebook, LinkedIn) will be more prone to move their deposits in response to news and rumors than depositors without that presence.
  2. Deposit age: As in other businesses, a bank customer who has been a customer for longer is less likely to move his or her deposit, in response to fear, than one who became a customer recently. Perhaps, banks should follow subscriber/user based companies in creating deposit cohort tables, breaking deposits down based upon how long that customer has been with the bank, and the stickiness rate in each group. 
  3. Deposit growth: In the SVB discussion, I noted that one reason that the bank was entrapped was because deposits almost doubled in 2021. Not only do very few banks have the capacity to double their loans, with due diligence on default risk, in a year, but these deposits, being recent and large, are also the least sticky deposits at the bank. In short, banks with faster growth in their deposit bases also are likely to have less sticky depositors.
  4. Deposit concentration: To the extent that the deposits of a bank are concentrated in a geographic region, it is more exposed to deposit runs than one that has a more geographically diverse deposit base. That would make regional bank deposits more sensitive that national bank deposits, and sector-focused banks (no matter what the sector) more exposed to deposit runs than banks that lend across businesses. 
Some of this information is already collected at the bank level, but it may be time for bank regulators to work on measures of deposit stickiness that will then become part of the panel that they use to judge exposure to risk at banks.

The Market Reaction
    The most surprising feature of the 2023 banking crisis has been the reaction of US equity markets, which have been resilient, rising in the face of a wall of worry. To illustrate how the market reaction has played out at different levels, I looked at four indices, starting with the S&P 500, moving on the S&P Financials and Banks Index to the S&P Select Bank Index and finally, the S&P Regional Bank Index.


The S&P 500 index is up 6.5% this year, indicative of the resilience on the part of the market, or denial on the part of investors, depending on your perspective. The S&P Financial Sectors index is down 5.72%, but the S&P Select Banks index is down 26.2% and the regional bank index has taken a pummeling, down more than 35%. The damage from this banking crisis, in short, has been isolated to banks, and within banks, has been greater at regional banks than at the national banks.
    The conventional wisdom seems to bethat big banks have gained at the expense of smaller banks, but the data is more ambiguous. I looked at the 641 publicly traded US banks, broken down by market capitalization at the start of 2023 into ten deciles and looked at the change in aggregate market cap within each decile. 


As you can see the biggest percentage declines in market cap are bunched more towards the bigger banks, with the biggest drops occurring in the eighth and ninth deciles of banks, not the smallest banks. After all, the highest profile failures so far in 2023 have been SVB, Signature Bank and First Republic Bank, all banks of significant size. 
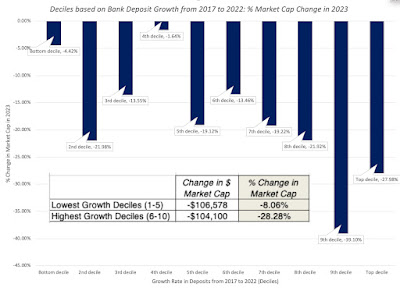
    If my hypothesis about deposit stickiness is right, it is banks with the least stick deposits that should have seen the biggest declines in market capitalization. My proxies for deposit stickiness are limited, given the data that I have access to, but I used deposit growth over the last five years (2017-2022) as my  measure of stickiness (with higher deposit growth translating into less stickiness):
The results are surprisingly decisive, with the biggest market capitalization losses, in percentage terms, in banks that have seen the most growth in deposits in the last five years. To the extent that this is correlated with bank size (smaller banks should be more likely to see deposit growth), it is by no means conclusive evidence, but it is consistent with the argument that the stickiness of deposits is the key to unlocking this crisis.

Implications
    I do believe that there are more dominos waiting to fall in the US banking business, with banks that have grown the most in the last few years at the most risk, but I also believe that unlike 2008, this crisis will be more likely to redistribute wealth across banks than it is to create costs for the rest of us. Unlike 2008, when you could point to risk-seeking behavior on the part of banks as the prime reason for banking failures, this one was triggered by the search for high growth and a failure to adhere to first principles when it comes to duration mismatches. That said, I would expect the following changes in the banking structure:
  1. Continued consolidation: Over the last few decades, the US banking business has consolidated, with the number of banks operating dropping 14,496 in 1984 to 4,844 in 2022. The 2023 bank failures will accelerate this consolidation, especially as small regional banks, with concentrated deposit bases and loan portfolios are assimilated into larger banks, with more diverse structure.
  2. Bank profitability: For some, that consolidation is worrisome since it raises the specter of banks facing less competition and thus charging higher prices. I may be naive but I think that as banks consolidate, they will struggle to maintain profitability, and perhaps even see profits drop, as disruptors from fintech and elsewhere eat away at their most profitable segments. In short, the biggest banks may get bigger, but they may not get more profitable.
  3. Accounting rule changes for banks: The fact that SVB's failure was triggered by a drop in value of the bank's investments in bonds and mortgage backed securities, and that this write down came as a shock to in investors, because SVB classified these securities as being held till maturity (and thus not requiring of mark-to-market) will inevitably draw the attention of accounting rule writers. While I don't foresee a requirement that every investment security be marked to market, a rule change that will create its own dangers, I expect the rules on when securities get marked to market to be tightened.
  4. Regulatory changes: The 2023 crises have highlighted two aspects of bank behavior that are either ignored or sufficiently weighted into current regulatory rules on banks. The first is duration mismatches at banks, which clearly expose even banks that invest in default free securities, like SVB, to risk. The other is deposit stickiness, where old notions of when depositors panic and how quickly they react will have to be reassessed, given how quickly risk whispers about banks turned into deposit flight at First Republic and Signature Bank. I expect that there will be regulatory changes forthcoming that will try to incorporate both of these issues, but I remain unsure about the form that these changes will take.
I know I have said very little in this post about whether banks are good investments today, either collectively or subsets (large money center, regional etc.), and have focused mostly on what makes for good and bad banks. The reason is simple. Investing is not about judging the quality of businesses, but about buying companies at the right price, and that discussion requires a focus on what expectations markets are incorporating into stock prices. I will address the investing question in my next post, which I hope to turn to very soon! 

YouTube Video