It is never pleasant to be in the midst of a market correction, but a market correction does operate as a cleanser for excesses that enter into even the most disciplined investors' playbooks in the good times. This correction has been no exception, as the threat of losing investment capital has focused the minds of investors, and led many to reexamine practices adopted during the last decade. In particular, there has been more talk of earnings than of revenue or user growth this year, and the notion of cashflows driving value seems to be back in vogue. As someone who believes that intrinsic value comes from expected cash flows, I find that development welcome, but I do find myself doing double takes when I see concoctions of free cash flow that violate first financial principles. While I understand that there is no one overriding definition of cash flow that trumps others, it is essential that we define what we mean when we talk about free cash flows, and get perspective on what companies look like, on these cash flow measures.
Free Cash Flows: The What and The Why!
Free cash flow is one of the most dangerous terms in finance, and I am astonished by how it can be bent to mean whatever investors or managers want it to, and used to advance their sales pitches. I have seen analysts and managers argue that adding back depreciation to earnings gives you free cash flow, an intermediate stop, at best, if you truly are intent on computing free cash flow. In the last two decades, I have seen free cash flow measures stretched to cover adjusted EBITDA, where stock-based compensation is added back to EBITDA, and with WeWork, to community-adjusted EBITDA, where almost all expenses get added back to get to the adjusted value. I will use this section to clarify what free cash flows are trying to measure, how they get used in investing and valuation, and the measurement questions that can cause measurement divergences.
What is Free cash flow (FCF)?
I believe that any measurement of free cash flow has to begin with a definition of to whom those cash flows accrue. Since a business can raise capital from owners (equity) and lenders (debt), the free cash flows that you compute can be to just the equity investors in the business, in which case it is free cash flow to equity, or to all capital providers in the business, as free cash flow to the firm.


Estimation of FCFE
If you have to compute the FCFE for a firm, you can see that every item that you need for the calculation should be accessible in its statement of cash flows, and there seems to be little room for disagreement. However, you will wrestle with what items to include and which ones to exclude, when computing the FCFE for a firm. To illustrate, we have used the statement of cash flows for Microsoft for the 2021 fiscal year (from July 2020- June 2021) as the basis for computing its FCFE in the figure below:


Using Free Cash Flows
While there are facile reasons that you can give for computing free cash flows, including the usual “we don’t trust accounting earnings” and “cash is king”, calculating it does involve added computations and there are three contexts where free cash flows get used. The first is that is that computing free cash flows for a past period helps in explaining what happened at a business during that period, in operating, investing and financing terms. The second is that it is that the free cash flows that you compute for a past period can be used as the basis for forecasting expected free cash flows in the future, a key ingredient if you are doing intrinsic valuation. The third is to compute the free cash flow as a base to be used to compare pricing across companies, where the market price is scaled to free cash flow, rather than to earnings. Since each of these missions has a different end game, there can be consequences for how we estimate free cash flows in each one; put simply, the free cash flow you compute, if you just want to explain what a firm did last year, can be different from the free cash flow you compute as the base year number for intrinsic valuation, which, in turn, can be different from the free cash flow that you estimate, if you are computing a pricing multiple.
1. Explain the past
It is true that when investing in a company, it is what happens in the future that will determine whether you make money, but it is also true that to make these future assessments, a good place to start is by understanding what that company has done in the past. Notwithstanding the mission bloat that has bedeviled accounting in the last few decades, where the notion of fair value has distracted accountants, explaining what a company has done in the past, and where it stands now remains the core mission that should animate financial statements. As a believer in cash flows, I have always gravitated to the statement of cash flows as the accounting disclosure that is least contaminated by accounting overreach and the one that best reflects the true operations of a business.

Note that the statement of cash flows looks at cash flows through the eyes of equity investors, starting as it does with net income and working its way down through investing and financing cash flows, before concluding with an explanation of the change in the company’s cash balance. As you can see in my earlier computation of FCFE for Microsoft, every item that you need for the calculation is in the FCFE, with your key decisions becoming which items not to count (any cash flows to equity, investments in securities etc.) and which ones to include (cash acquisitions, foreign exchange gains or losses etc.)
An intuitive reading of the FCFE is that it is cash available to be returned to equity investors, either in the form of dividends or as cash buybacks. It is the rare firm that follows a residual cash policy, returning its FCFE every year as dividends and/or buybacks. Some firms hold back and return less than they can, for good reasons (buffer against future bad years, set aside to cover investment opportunities) as well as bad ones (managers/insiders control the cash, over priced acquisitions); when they do hold back, the difference adds to their cash balances. Others choose to return more cash than they should be, and funding the difference from cash balances accumulated in the past and in some cases, fresh equity issuances, again for good reasons (a cyclical or commodity company riding out a down phase of a cycle) and for bad ones (inertia, an unwillingness to cut dividends, me-tooism on dividend policy or buybacks).

Companies with negative FCFE start in a hole, and even if they do not return any cash, they will find themselves with declining cash balances and/or new equity issuances, and if they do choose to pay dividends or buy back stock, they will make the cash deficits bigger. This approach of computing FCFE and comparing it actual cash return can be a device that can explain how some companies end up with huge cash balances and why other companies, especially young and money losing, will be dependent on equity infusions to stay alive.
One of the limitations of focusing of free cash flows to equity is that you can get tunnel vision, since borrowing money operates as a cash inflow, inflating free cash flow to equity. That can explain why a firm with moderate or even below-average profitability can use debt to fund large dividends and buybacks, and to the extent that the firm is borrowing too much, it can dig a hole for itself. Estimating free cash flows to the firm can alert you to this occurrence, since it is a pre-debt cash flow and new debt issuances or repayments cannot alter it. In fact, the free cash flows to the firm, while less intuitive, are the source of cash flows to all claim holders (lenders as well as equity investors):

Mapping out these cash flows can provide a big picture perspective on where a firm’s cash flows are coming from and going, as well as a better assessment of the operating health of its business. It can also provide advance warning of the company’s exposure to downside risk, since the cash flows to lenders (interest and debt payments) are contractually set.
2. Intrinsic Valuation
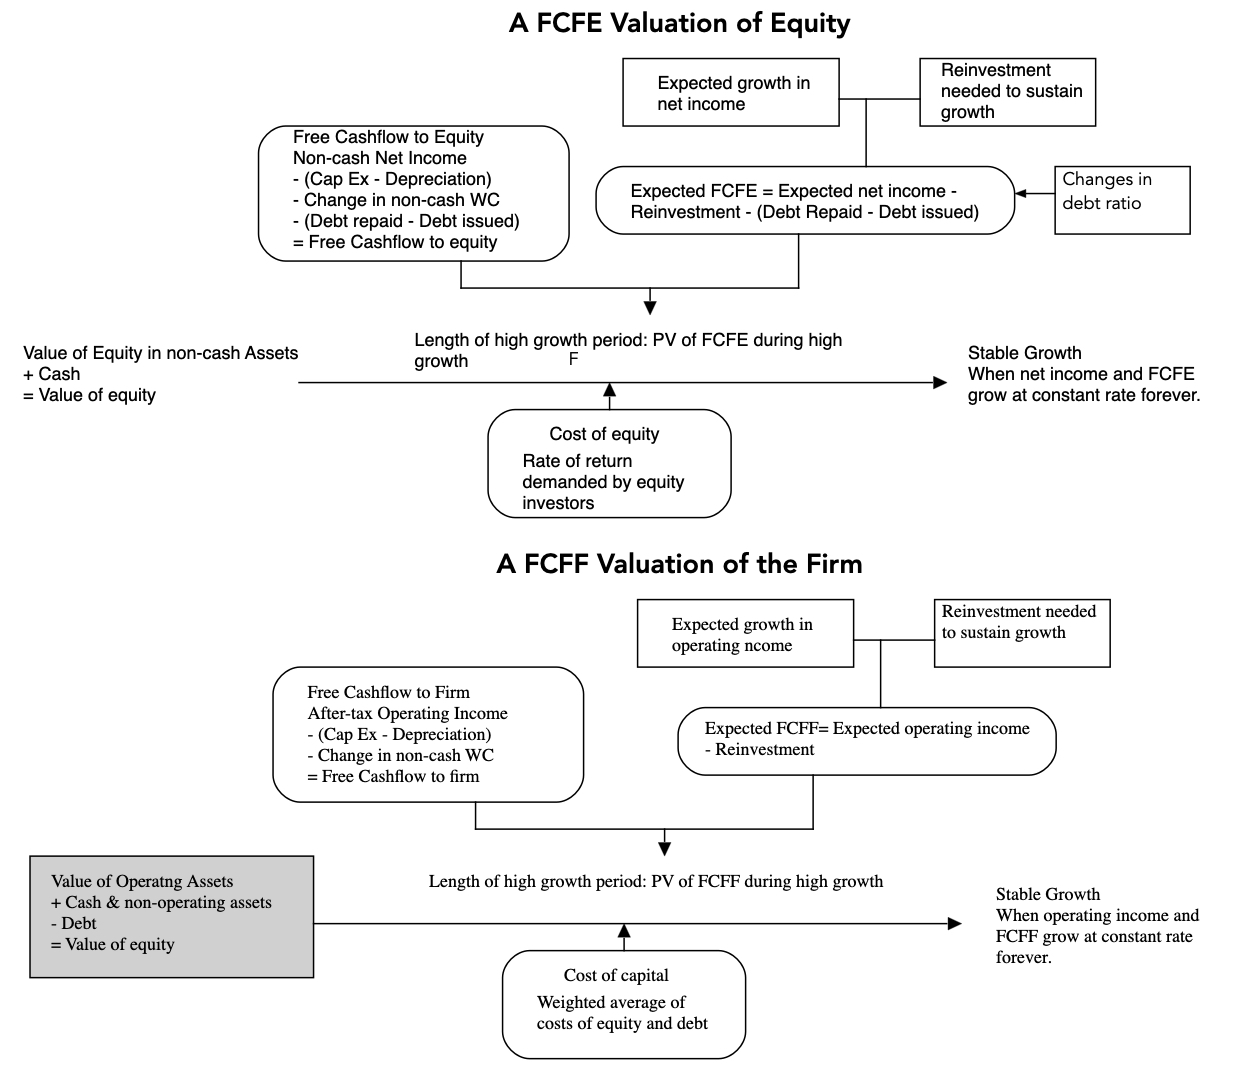
In intrinsic value, the value of an asset, business or equity stake in a business is the present value of the expected cash flows on it. Thus, in intrinsic valuation, the free cash flows (to equity or the firm) that you compute for the most recent year or time period is never part of value, but is useful only because it provides a base for forecasting the future. The question of whether you should be estimating free cash flows to equity or to the firm cannot be answered until you decide whether you are valuing just the equity in a business or the entire operating assets of the business.
- If you are valuing just the equity, you’ll be estimate the free cash flows to equity in future years, and discounting back at the cost of equity, i.e., the rate of return that equity investors can make on other investments in the public market, of equivalent risk.
- If you are valuing all operating assets in a business, you will estimate free flows the entire firm or business, and discount these cash flows back to today at a weighted average of the costs of equity and debt, with the weights reflecting the proportions of each funding type.
- Unusual or Extraordinary items: When explaining last year’s cash flows, you should consider all items, even if they are one-time or extraordinary, since they are cash flows. However, if you are computing cash flows as a base for forecasting the future, you should eliminate any items that you don’t expect to recur in the future. Thus, a cash inflow from a one-time divestiture of a division or a cash outflow due to a loss in a lawsuit, though part of free cash flows last year, will be excluded, if you are computing a base-year free cash flow for estimating future cash flows.
- Normalized vs Actual numbers: For items that are recurring, but volatile, there is a good case to be made that while you will use the actual values, if computing free cash flows for the most recent year, you should be normalizing them, though the methods you use for normalization can vary across items. With the change in non-cash working capital, a notoriously volatile item on a year-to-year basis, I have found that looking at non-cash working capital as a percent of revenues, and using that statistic to reestimate the change in non-cash working capital in the most recent year provides a better base year foundation. In the Microsoft FCFE calculation, shown in the earlier section, using the historical average of non-cash working as percent of revenues of -10.18% (average from 2012-21), would have yielded a change in non-cash working capital of -$2,552 million in the base year, making it a cash inflow, rather than the outflow of $1,086 million that we attributed to working capital that year. With cash acquisitions, where a company may do only one big acquisition every three or four years, taking a long time series and averaging acquistions over that period will yield a better recurring value.
- Stock-based Compensation and Acquisitions: The most hotly discussed item in cash flow estimation is stock-based compensation, in the form of restricted stock or options. A simplistic reading is to argue that is non-cash and add it back, just as you depreciation and amortization, but stock-based compensation is not comparable. While depreciation and amortization are truly non-cash, stock-based compensation is more of an in-kind expense, where you give away shares of equity in the company instead of paying cash. If you are estimate free cash flows (to the firm or to equity), with the intent of valuing that firm, adding back stock-based compensation is equivalent to arguing that you can either stop paying employees in the future (and still hold on to them) or that you can keep giving away equity stakes in your company with no consequences for value per share. In short, there is no justification for adding back stock-based compensation to get to cash flows, and none of the numerous variants of adjusted EBITDA that you see populating annual reports or prospectuses holds up to scrutiny. Using the logic that paying for something with shares, instead of cash, still has an effect on free cash flows, we would argue that a company that plans to grow through acquisitions, using its own stock as currency, is reinvesting, and that this reinvestment should reduce expected free cash flows to equity, to existing shareholders. During the 2021 fiscal year, Microsoft bought Nuance Communications for $19.76 billion in all stock transaction, and that amount should be treated as reinvestment for the year, even though it is technically non-cash.
- Taxes: With free cash flows to equity, you start with net income but that net income can be skewed up if the company had a low effective tax rate that year, either because of write offs or losses carried forward into that year, or down, if it faced an unusually high tax rate that year. With free cash flows to the firm, the effective tax rate plays an even more direct role in determining cash flows, when you use it compute your after-tax operating income. In both cases, it makes sense to leave the effective tax rate at its actual level, when computing free cash flows for the past, but to rethink that when your objective is to forecast future free cash flows. I would suggest looking at an average effective tax rate over a longer period, in computing the base year free cash flow, and then also targeting the marginal tax rate, as you forecast taxes for the future. In the Microsoft FCFF calculation, this would imply replacing the effective tax rate of 13.83% with an average effective tax rate of 22%, using the 2017-2021 time period, which would lower free cash flows to the firm.
- Accounting Inconsistencies: I have written about the inconsistency in how accountants calculate capital expenditure at firms with significant investments in intangible assets and R&D, and that inconsistency can play out in your FCFE computation. While R&D remains a cash outflow, whether you treat it as an operating or a capital expenditure, moving it from operating to capital expenditures can alter your perception of a company's operations. In the case of Microsoft, for instance, capitalizing the $20,716 million that the company spent on R&D in 2021, will increase the net income for the company, while also raising the reinvestment by an equivalent amount. Put simply, Microsoft is much more profitable than the accounting statements lead you to believe, while reinvesting more than you thought it was, and both of those conclusions will have implications for valuation

- With equity multiples, you can scale the market value of equity (or market capitalization) of a company to its free cash flow to equity, to estimate a Price to FCFE multiple, and offer it as an alternative to the much more widely used PE ratio, where market capitalization is scaled to net income.
- With enterprise value multiples, you can scale enterprise value to FCFF, instead of using EBITDA or revenues as your scalar. Again, you could argue for the benefits of a more complete measure of cash flow, but as with FCFE, FCFF will be more volatile than revenues or EBITDA, making it difficult to pass pricing judgment.
Free Cash Flows: Perspective
With that long lead in on free cash flows, let us talk about why free cash flows vary across companies and across time. To make the connection, I am going to fall back on a structure that I have used before, the corporate life cycle, to look at the evolution of FCFE, as companies age, and use that structure to also examine how these FCFE play out as cash returned to shareholders, over time.
The Life Cycle Effect
In a corporate life cycle structure, you trace a business from start-up (birth) to the toddler years (very young businesses) through their teenage years into middle and old age. I have found it useful in explaining why the focus of a business changes from finding investment opportunities, when young, to finessing capital structure, as middle age companies, to deciding how best to return cash to investors, in old age, as well as why the challenges you face in valuation are different for young companies than more mature businesses. The corporate life cycle also provides a framework for explaining how free cash flows evolve, as companies move through the life cycle:

Focusing on free cash flows to equity, you should expect to see negative values, early in the life cycle, as businesses struggle to make money and have to reinvest to deliver on their growth potential at the same time, and a resultant dependence on raising fresh equity capital (from VCs and public market investors) to keep going. As their business models take form, and they turn the corner on profitability, you should continue to see negative cash flows because of the need to reinvest to grow; in general, you should expect to see positive cash flows lag positive earnings. At mature businesses, you should expect to see free cash flows to equity to not only stay positive, but also to grow faster than earnings, and in decline, while earnings will follow revenues on their path down, divestitures and asset sales can allow FCFE to be higher than earnings. To see how net income and FCFE evolve, as a company ages, I computed the net income and FCFE for Tesla every year from 2006 to 2021:
 |
| Source: Capital IQ |
For much of its existence, Tesla has been a money-losing company, reflecting its young, high growth status. It turned the profitability corner in 2020, though FCFE stayed mildly negative that year, and in 2021, the FCFE also turned positive. In corporate life cycle terms, Tesla is growing up, which is good news in terms of profitability and cash flows but bad news, if growth is what rings your bell.
To see if the corporate life cycle has relevance in explaining differences in free cash flows to equity across companies, I looked at US companies, broken down by age, into ten deciles, from youngest to oldest, and computed each component of the FCFE, by decile:

As you can see in the table, among the youngest companies (in the lowest decile), more than 73% are money-losing and more than three quarters of these companies have negative free cash flows to equity. As companies age, the proportion of companies that are money making increasing, as does the percent that has positive FCFE. In relative terms, the companies in the middle of the corporate life cycle, deliver the highest FCFE as a percent of market capitalization

Pricing
 |
| Source: S&P Capital IQ |
The good news is that the distribution for price to FCFE resembles the distribution for PE ratios, but the bad news is that you are replacing a multiple where you lose almost half the firms in your sample, with PE ratios, with an even more flawed multiple in Price to FCFE, which cannot be calculated in more than 63% of publicly traded companies. Put simply, if you start with a peer group of 25 firms, you may end up with a final sample of 10 firms or less, if you are pricing with a price to FCFE multiple. Moreover, price to FCFE ratios show more divergence than PE ratios, as can be seen in the spread between the first and third quartiles of each one.
 |
| Source: S&P Capital IQ |