Continuing an annual ritual of long standing, ahead of starting my spring teaching at NYU starting in a couple of weeks, I would like to invite you, if you are interested, to come along for the ride. I know! I know! Most of you are not enrolled at NYU, paying nosebleed prices, and that is prerequisite to be in the classroom, but thanks to technology and a loose reading of the rules that constrain me, you can get a close approximation of the classroom experience, wherever you are in the world, with broadband being your only constraint.
My Teaching Journey
I am a product of my life experiences, and at the risk of boring you, I would like to give you a short history of the lucky breaks and choices that have led me to where I am today. I came to the United States in 1979, and having lived here much of my life, I feel nothing but gratitude for the kindness and opportunities that this country has offered me. I started in the MBA program at University of California at Los Angeles (UCLA) in 1979, at the tail-end of its basketball glory days, fully expecting to move on to a career in consulting or investment banking, when I was done. To ease my financial constraints, I became a teaching assistant in the second year of my MBA program, and in what I can only describe as a moment of grace, I realized that teaching was what I wanted to do with the rest of my life.
Recognizing the need for a doctorate as an entree into college teaching, I stayed on at UCLA to get my Phd. In 1984, I moved on to the University of California at Berkeley, as a visiting lecturer, teaching anything that needed to be taught. The six classes that I prepped for in those two years ranged from banking to investments to corporate finance, and while I have never worked harder, much of what I teach today came out of those classes. In 1986, I joined New York University's business school as an assistant professor, and asked to teach Security Analysis, a class made legendary by Ben Graham, who taught it at Columbia University in the 1950s. By 1986, though, it was showing its age, more a collection of topics about institutions and types of securities, than a cohesive class. I balked at teaching this motley collection of topics and wanted to teach a class on valuation, but I was told that there was not enough stuff in valuation to fill a class. I learned early in my academic life that if you want to get anything done in an academic setting, it is better to do it subversively than it is to ask (and get) official permission. In the fall of 1986, I taught a valuation class in my security analyst slot, and with no cameras in the classroom or complaints from students, no one was any wiser. In spring 2024, I will be teaching valuation again to the MBAS, for the 59th time, and I have an identical class that I will delivering to undergraduates during the semester.
The very first class that I taught at Berkeley in 1984 was an introductory corporate finance class (BA 130, for those who are from Berkeley and remember the class codes) and I have continued to teach that class as well to the MBAs at Stern, usually in the first year of the program. Since many MBAs consider taking both my corporate finance and valuation classes, I am asked what the difference is between the classes, and my explanation is that in corporate finance, we look at first principles in finance from the inside of businesses, as owners or managers, whereas in valuation, you look at those same principles, as investors or potential investors in these companies, from the outside in. In the years that I have taught these two classes, I find myself using my corporate finance framework constantly, when valuing companies, and bringing my understanding of valuation into play, when examining how companies should make investing, financing and dividend decisions.
In the 1990s, I was asked to pinch hit for a colleague and manage a semester-long class of sessions with outside speakers, all of whom were successful investors and portfolio managers. As I watched these investors come in and pitch their ideas about how markets worked and the best way to beat these markets to the students in the class, I noticed that while the speakers all shared success, they had very different perspectives about markets and divergent investment philosophies. At the end of that class, I put together a class on investment philosophies, not with the intent of picking the best one, but instead offering the entire menu, so that students could decide for themselves whether they wanted to be technical analysts, momentum trades, value investors, venture capitalists of market timers.
Pre-Season Prep
If you are new to finance or valuation, and especially if you have a non-quantitative background (a liberal arts major, a job in strategy or marketing, for example), I don't blame you for feeling intimidated at the prospect of taking a corporate finance, valuation or investment philosophies class. Investment bankers, consultants and portfolio managers often speak in a language that is foreign to those not in the space, and create an aura of mystery and layers of complexity around what they do. In my view, much of this is smoke and mirrors, and there is nothing in finance that is beyond your reach, if you are willing to use common sense and commit to doing a little bit of work that is outside your comfort zone. In particular, there are three disciplines that can help you in any finance class or analysis, and the payoff to spending time on each of them is significant.
1. The Language of Finance: Much as I take issue with the rigidity of accounting rules and the incapacity of accounting to be imaginative, the data that we use in finance is expressed in accounting terms. If you really don't understand the difference between operating earnings and net income, or know what accounting balance sheets can (and cannot) measure, you will have trouble doing any type of corporate financial analysis or valuation. That said, accounting classes are not only overkill but they also actively create perspectives that can get in the way of sensible financial analysis. A few years ago, I created my own version of an accounting class, reflecting my selfish interests in accounting data, and you can find this online, if your accounting is rusty:
If you are an accountant or have an accounting degree, you may find my treatment of accounting rules to be sacrilegious, but I have a very different end game.
2. The Building Blocks of Finance: Over the decades, finance has become specialized, but it is astonishing how much of finance is still build around basic building blocks. Since many of the students in my NYU finance classes come in with a foundational class in finance already under their belt, I used to take it for granted that they had mastered those building blocks. Over time, I have learned that this is not always true, and I have a short class on foundational finance, which includes discussions of what risk is, and how to measure it, the time value of money and the basic macroeconomic drivers of interest rates and exchange rates.
If you are well versed in these areas already, you should skip this class and move on, but it cannot hurt to refresh the basics.
3. The Data Wranglers: We live in the age of big data, and as I watch those marketing big data make tall claims about what it can do for businesses, It is worth remembering that finance discovered the power of data decades ago, and that its effects on practice have been mixed. In particular, we have discovered that having more financial data does not always lead to better decisions and that our behavioral quirks can lead us to skew and ignore data. It is for that reason that I find myself turning more and more to statistics, a discipline designed to take large amounts of contradictory data and make sense of that data. Again, I have a short course that I put together that covers the statistical concepts needed in finance, from summary statistics (averages, medians) to measures of relationships (correlations, covariances) to predictive and analytics tools (regressions, simulations):
If you are a statistics maven, you will undoubtedly find my discussion of statistical topics to be simplistic and naive, but if you are not, I hope that this revisiting of statistical concepts helps.
Learning Choices
If I have not already talked you out of taking my classes, and you are still interested, the classes exist in multiple formats, and you can make your choice, based upon time available, preferences and end games.
The Classes
In the first section of this post, I described the history of the three classes that I teach - the corporate finance class that I first taught at Berkeley in 1984 and have taught every year since, the valuation class that I sneaked in, as a replacement for security analysis, into my NYU classroom in 1986, and my investment philosophies class, born out of my experience listening to great investors talk about how they make money.
I describe my corporate finance class as an applied, big-picture class. It is a big-picture class because it is really a class about how to run a business, from a financial principles perspective, and every decision that a business makes is ultimately a corporate finance decision. The class tries to answer three core questions that every business, small or large, public or private, faces - the investment question (of whether and how much to invest in new projects/assets, the financing question of how much to borrow and in what form and the dividend question of how much cash to return to shareholders, if at all:
It is an applied class, because I answer each of these questions for a mix of companies that range the spectrum from large to small, developed to emerging market and from public to private - Disney, Vale, Tara Motors, Baidu, Deutsche Bank and a privately owned bookstore in New York Since these are real businesses exposed to changes in real time, there will be surprises that they deliver during the next few months that will become fodder for discussion.
The corporate finance class ends with a valuation segment, where I link the decisions that companies make on the investing, financing and dividend dimension to value. I pick up on that segment in the valuation class, which I describe grandiosely as a class about valuing and pricing just about anything and from any perspective:
Rather than use case studies and abstractions, this class is built around valuing businesses in real time, and the companies that hit the news during the course of the next few months will find their way into my classroom versions of the valuation class. While it is offered to both undergraduates and MBAs, the class is identical in terms of content, and you can pick either to follow.
The investment philosophies class covers the spectrum of investment philosophies, and I have classified them in the picture below, based upon whether they are built around value or pricing. If you find that contrast mystifying, tune in to the class, and I will clarify:
The end game with this class is not to sell you on the best investment philosophy, but the one that best fits you, based upon what you bring to the game.
Class Format
My classes are available in three formats. The first is the classroom format, where you can watch recordings of my undergraduate and MBA classes at Stern this semesters, shortly after they are delivered in real time. In that format, you will also have access to all of the materials that I use in the classroom, including lectures notes and exams/quizzes, and if you really want to get close to classroom-experience, you can do the project that everyone in class is required to do. You will not get credit or a grade, and you are not enrolled the class, but you don't have to pay tuition. The second is a free online version that I have created for each class, with the lectures shrunk (in substance and time) to be more attuned to an online audience. You can access these online classes on my website, and as with the classroom classes, be able to download lecture notes and quizzes. The third is an online and paid version offered by NYU, where there are professional recordings of the online lectures, administered and grades quizzes and exams and virtual office hours. You will get an official certificate of course completion with this class, but NYU will extract its (financial) pound of flesh in the form of a tuition payment.
I want to emphasize that if you decide to follow the classroom or online versions of the class, it is entirely informal and that it has nothing to do with NYU. There is no registration, recording or access to NYU resources that come with taking these classes. If you take the certificate class, you will have a more formal relationship with NYU.
In choosing between these alternatives (and I really am completely okay with any choice you make), here are some things to consider:
Financial constraints: If you are budget-constrained, your choice is a simple one. Since my NYU certificate classes are available, with almost nothing held back, for free on my webpage, why pay for these classes? The corollary to this proposition, however, is if you do choose to take the certificate class, please recognize that NYU sets the prices and complaining to me that the price is too high accomplishes nothing.
Time constraints: You have lives to live, work to do and families that you want to spend time with, and adding one of my classes to the list of things to do will eat into your time. The NYU certificate classes run on a semester clock, and if it looks like you will be busy for the next few months, you may find yourself unable to finish the class. Unlike some university-offered certificate classes, I do require those who take these certificate classes show me through a project and exams that they understand the material, and I don't give free passes. The two free versions (classroom and free online) do not operate on a calendar. In short, you can start with the regular class in January 2024 and stretch out the class over 12 months or 18 months, if you want to.
End game: Much as we all like to buy into the notion that learning is what matters, the truth is that some of you may want to use proof of that learning as a ticket to improve your standing in life (get a different job, move up in the ranks). With the free versions, you may very well learn just as much as those taking the class in the classroom, but you will get no credit for the class. Of course, you will get the certificate if you take the NYU certificate version, but NYU will extract its pound of flesh.
Updating: You will be watching recorded lectures in all three versions of the class, but the timing of these recordings will be different. With the classroom format, you will get an updated 2024 version and in real time, but with the online versions (free and certificate), the sessions will reflect when they were recorded. While my framework and fundamentals remain the same, the examples I will be using will reflect this updating (or lack of it).
Personal preferences: The online sessions (free and certificate) are shorter (10-20 minutes) and thus more easily amenable to online consumption. Watching an 80-minute session online is not easy, especially in a world of TikTok and short YouTube videos. You may want to try both formats, before you decide.
The links to all of the classes in their different formats is below:
Note that the certificate classes for the spring 2024 will be open for enrollment only until Sunday, January 14, 2024, and that the corporate finance certificate class is available only in the fall.
Sequencing
I like all the classes I teach, and if you asked which one you should take, I would be unable to answer, partly because it depends on what you plan to do in the future. If your question is about sequence, i.e., which classes should be taken first, that too will depend on what your background is and your end game. To help you make these choices, I put together a flow chart:
In fact, you may short circuit this sequencing and take only a portion of a class. Thus, if you are involved in banking or project financing, you may choose to take only the capital structure part of the corporate finance class, and if you are a trader, your focus may be on the pricing portion of the valuation class.
The Joy of Learning
As I watch young children experience the joy of learning, it reinforces my belief that human beings love to learn and that the tragedy of education systems is that they seem to be designed to destroy that love. It would be hubris on my part to claim that I will make you rediscover that love, but I do know that one reason I teach is to expose people to how much I enjoy learning new things or relearning old lessons. I hope that you can see that joy and that some of it rubs off on you!
In January 1993, I was valuing a retail company, and I found myself wondering what a reasonable margin was for a firm operating in the retail business. In pursuit of an answer to that question, I used company-specific data from Value Line, one of the earliest entrants into the investment data business, to compute an industry average. The numbers that I computed opened my eyes to how much perspective on the high, low, and typical values, i.e., the distribution of margins, helped in valuing the company, and how little information there was available, at least at that time, on this dimension. That year, I computed these industry-level statistics for five variables that I found myself using repeatedly in my valuations, and once I had them, I could not think of a good reason to keep them secret. After all, I had no plans on becoming a data service, and making them available to others cost me absolutely nothing. In fact, that year, my sharing was limited to the students in my classes, but in the years following, as the internet became an integral part of our lives, I extended that sharing to anyone who happened to stumble upon my website. That process has become a start-of-the-year ritual, and as data has become more accessible and my data analysis tools more powerful, those five variables have expanded out to more than two hundred variables, and my reach has extended from the US stocks that Value Line followed to all publicly traded companies across the globe on much more wide-reaching databases. Along the way, more people than I ever imagined have found my data of use, and while I still have no desire to be a data service, I have an obligation to be transparent about my data analysis processes. I have also developed a practice in the last decade of spending much of January exploring what the data tells us, and does not tell us, about the investing, financing and dividend choices that companies made during the most recent year. In this, the first of the data posts for this year, I will describe my data, in terms of geographic spread and industrial breakdown, the variables that I estimate and report on, the choices I make when I analyze data, as well as caveats on best uses and biggest misuses of the data.
The Sample
While there are numerous services, including many free ones, that report data statistics, broken down by geography and industry, many look at only subsamples (companies in the most widely used indices, large market cap companies, only liquid markets), often with sensible rationale – that these companies carry the largest weight in markets or have the most reliable information on them. Early in my estimation life, I decided that while this rationale made sense, the sampling, no matter how well intentioned, created sampling bias. Thus, looking at only the companies in the S&P 500 may give you more reliable data, with fewer missing observations, but your results will reflect what large market cap companies in any sector or industry do, rather than what is typical for that industry.
Since I am lucky enough to have access to databases that carry data on all publicly traded stocks, I choose all publicly traded companies, with a market price that exceeds zero, as my universe, for computing all statistics. In January 2024, that universe had 47,698 companies, spread out across all of the sectors in the numbers and market capitalizations that you see below:
Geographically, these companies are incorporated in 134 countries, and while you can download the number of companies listed, by country, in a dataset at the end of this post, I break the companies down by region into six broad groupings – United States, Europe (including both EU and non-EU countries, but with a few East European countries excluded), Asia excluding Japan, Japan, Australia & Canada (as a combined group) and Emerging Markets (which include all countries not in the other groupings), and the pie chart below provides a picture of the number of firms and market capitalizations of each grouping:
Before you take issue with my categorization, and I am sure that there are countries or at least one country (your own) that I have miscategorized, I have three points to make, representing a combination of mea culpas and explanations. First, these categorizations were created close to twenty years ago, when I first started looking a global data, and many countries that were emerging markets then have developed into more mature markets now. Thus, while much of Eastern Europe was in the emerging market grouping when I started, I have moved those countries that have either adopted the Euro or grown their economies strongly into the Europe grouping. Second, I use these groupings to compute industry averages, by grouping, as well as global averages, and nothing stops you from using the average of a different grouping in your valuation. Thus, if you are from Malaysia, and you believe strongly that Malaysia is more developed than emerging market, you should look at the global averages, instead of the emerging market average. Third, the emerging market grouping is now a large and unwieldy one, including most of Asia (other than Japan), Africa, the Middle East, portions of Eastern Europe and Russia and Latin America. Consequently, I do report industry averages for the two fastest growing emerging markets in India and China.
The Variables
As I mentioned at the start of this post, this entire exercise of collecting and analyzing data is a selfish one, insofar as I compute the data variables that I find useful when doing corporate financial analysis, valuation, or investment analysis. I also have quirks in how I compute widely used statistics like accounting returns on capital or debt ratios, and I will stay with those quirks, no matter what the accounting rule writers say. Thus, I have treated leases as debt in computing debt ratios all through the decades that I have been computing this statistic, even though accounting rules did not do so until 2019, and capitalized R&D, even though accounting has not made that judgment yet.
In my corporate finance class, I describe all decisions that companies make as falling into one of three buckets – investing decisions, financing decision and dividend decisions. My data breakdown reflects this structure, and here are some of the key variables that I compute industry averages for on my site:
Many of these corporate finance variables, such as the costs of equity and capital, debt ratios and accounting returns also find their way into my valuations, but I add a few variables that are more attuned to my valuation and pricing data needs as well.
Thus, I compute pricing multiples based on revenues (EV to Sales, Price to Sales), earnings (PE, PEG), book value (PBV, EV to Invested Capital) or cash flow proxies (EV to EBITDA). In recent years, I have also added employee statistics (number of employees and stock-based compensation) and measures of goodwill (not because it provides valuable information but because of its potential to cause damage to your analysis).
My data is primarily micro-focused, since there are other services that are much better positioned to provide macro data (on inflation, interest rates, exchange rates etc.). My favorite remains the Federal Reserve data site in St. Louis (know as FRED, and one of the great free data resources in the world), but there are a few macro data items that I estimate, primarily because they are not as easily available, or if available, are exposed to estimation choices. Thus, I report annual historical returns on asset classes (stocks, bonds, real estate, gold) going back to 1928, mostly because data services seem to focus on individual asset classes and partly because I want to make sure that returns are computed the way I want them to be. I also have implied equity risk premiums (forward-looking and dynamic estimate of what investors are pricing stocks to earn in the future) for the S&P 500 going back annually to 1960 and monthly to 2008, and equity risk premiums for countries.
The Industry Groupings
I am aware that there are industry groupings that are widely used, including industry codes (SIC and NAICS), I have steered away from these in creating my industry groupings for a few reasons. First, I wanted to create industry groupings that were intuitive to use for analysts looking for peer groups, when analyzing companies. Second, I wanted to maintain a balance in the number of groupings - having too few will make it difficult to differentiate across businesses and having too many will create groupings with too few firms for some parts of the world. The sweet spot, as I see it, is around a hundred industry groupings, and I get pretty close with 95 industry groupings; the table below lists the number of firms within each in my data:
No matter how carefully you create these groupings, you will still face questions about where individual companies fall, especially when each company can be assigned to one industry group. Is Apple a personal computer company, an entertainment company or wireless telecom company? While you can allow it to be in all three, when analyzing the companies, for purposes of computing industry averages, I had to assign each company to a single grouping. If you are interested in seeing which companies fall within each group, you can find it by clicking on this link. (Be patient. This is a large dataset and can take a while to download)
Data Timing & Currency Effects
In computing the statistics for each of the variables, I have one overriding objective, which is to make sure that they reflect the most updated data that I have at the time that I compute them, which is usually the first week of January. That does lead to what some of you may view as timing contradictions, since any statistic based upon market data (costs of equity and capital, equity risk premiums, risk free rates) is updated to the date that I do the analysis (usually the values at the close of the last trading day of the prior year – Dec 31, 2023, for 2024 numbers), but any statistic that uses accounting numbers (revenues, earnings etc.) will reflect the most recent quarterly accounting filing. Thus, when computing my accounting return on equity in January 2024, I will be dividing the earnings from the four quarters ending in September 2023 (trailing twelve month) by the book value of equity at the end of September 2022. Since this is reflecting of what investors in the market have access to at the start of 2024, it fulfils my objective of being the most updated data, notwithstanding the timing mismatch.
There are two perils with computing statistics across companies in different markets. The first is differences in accounting standards, and there is little that I can do about that other than point out that these differences have narrowed over time. The other is the presence of multiple currencies, with companies in different countries reporting their financials in different currencies. The global database that I use for my raw data, S&P Capital IQ, gives me the option of getting all of the data in US dollars, and that allows for aggregation across global companies. In addition, most of the statistics I report are ratios rather than absolute values, and are thus amenable to averaging across multiple countries.
Statistical Choices
In the interests of transparency, it is worth noting that there are data items where the reporting standards either don’t require disclosure in some parts of the world (stock-based compensation) or disclosure is voluntary (employee numbers). When confronted with missing data, I do not throw the entire company out of my sample, but I report the statistics only across companies that report that data.
In all the years that I have computed industry statistics, I have struggled with how best to estimate a number that is representative of the industry. As you will see, when we take a closer look at individual data items in later posts, the simple average, which is the workhorse statistic that most services report for variables, is often a poor measure of what is typical in an industry, either because the variable cannot be computed for many of the companies in the industry, or because, even when computed, it can take on outlier values. Consider the PE ratio, for example, and assume that you trying to measure a representative PE ratio for software companies. If you follow the averaging path, you will compute the PE ratio for each software company and then take a simple average. In doing so, you will run into two problems.
First, when earnings are negative, the PE ratio is not meaningful, and if that happens for a large number of firms in your industry group, the average you estimate is biased, because it is only for the subset of money-making companies in the industry.
Second, since PE ratios cannot be lower than zero but are unconstrained on the upside, you will find the average that you compute to be skewed upwards by the outliers.
Having toyed with alternative approaches, the one that I find offers the best balance is the aggregated ratio. In short, to compute the PE ratio for software companies, I add up the market capitalization of all software companies, including money-losers, and divide by the aggregated earnings across these companies, against including losses. The resulting value uses all of the companies in the sample, reducing sampling bias, and is closer to a weighted average, alleviating the outlier effect. For a few variables, I do report the conventional average and median, just for comparison.
Using the data
As I noted earlier, the datasets that I report are designed for my use, in corporate financial analysis and valuation that I do in real time. Thus, I plan to use the 2024 data that you see, when I value companies or do corporate financial analysis during the year, and if you are a practitioner doing something similar, it should work for you. You can find this current data at this link, organized to reflect the categories.
That said, there are some of you who are not doing your analysis in real time, either because you are in the appraisal business and must value your company as of the start of 2020 or 2021, or a researcher looking at changes over time. I do maintain the archived versions of my datasets for prior years on my webpage, and if you click on the relevant data, you can get the throwback data from prior years.
There are two uses that my data is put to where you are on your own. The first is in legal disputes, where one or both sides of the dispute seem to latch on to data on my site to make their (opposing) cases. While I clearly cannot stop that from happening, please keep me out of those fights, since there is a reason I don’t do expert witness of legal appraisal work; courts are the graveyards for good sense in valuation. The other is in advocacy work, where data from my site is often selectively used to advance a political or business argument. My dataset on what companies pay as tax rates seems to be a favored destination, and I have seen statistics from it used to advance arguments that US companies pay too much or too little in taxes.
Finally, my datasets do not carry company-specific data, since my raw data providers (fairly) constrain me from sharing that data. Thus, if you want to find the cost of capital for Unilever or a return on capital for Apple, you will not find it on my site, but that data is available online already, or can be computed from the financial releases from these companies.
A Sharing Request
I will end this post with words that I have used before in these introductory data posts. If you do use the data, you don’t have to thank me, or even acknowledge my contribution. Use it sensibly, take ownership of your analysis (don’t blame my data for your value being too high or low) and pass on knowledge. It is one of the few things that you can share freely and become richer as you share more. Also, as with any large data exercise, I am sure that there are mistakes that have found their way into the data, and if you find them, let me know, and I will fix them as quickly as I can!
Can one person make a difference to the value of a business? Of course, and with small businesses, especially those built around personal services (a doctor or plumber’s practice), it is part of the valuation process, where the key person is valued or at least priced and incorporated into valuation. While that effect tends to fade as businesses get larger, the tumult at Open AI, where the board dismissed Sam Altman as CEO, and then faced with an enterprise-wide meltdown, as capital providers and employees threatened to quit, illustrates that even at larger entities, a person or a few people can make a value difference. In fact, at Tesla, a company that I have valued at regular intervals over the last decade, the question of what Elon Musk adds or detracts from value has become more significant over time, rather than fading. Finally, Charlie Munger's passing at the age of ninety-nine brought to a close one of the most storied key person teams of all time at Berkshire Hathaway, and generations of investors who had attached a premium to the company because of that team's presence mourned.
Key Person: Who, what and why?
While it is often assumed that key people, at least from a value perspective, are at the top of the organization, usually founders and top management, we will begin this section by expanding the key person definition to include anyone in an organization, and sometimes even outside it. We will then follow up with a framework for thinking about how key people can affect the value of a business, with practical suggestions on valuing and pricing key people. We will end with a discussion of how enterprises try, with mixed effects, to build protections against the loss of key personnel.
Who is a key person?
In the Open AI, Tesla and Berkshire Hathaway cases, it is persons at the top of the organization that have been identified as key value drivers, but the key people in an organization can be at every level, with differing value effects.
It starts of course with founders who create organizations and lead them through their early years, partly because they represent their companies to the rest of the world, but more because they mold these companies, at least in their formative years. It is worth noting that while some reach legendary status, sharing their names with the organization (like Ford and HP), others are unceremoniously pushed aside, because they were viewed, rightly or wrongly, as unfit to lead their own creations.
Staying at the top, CEOs for companies often become entwined with their companies, especially as their tenure lengthens. From Alfred Sloan at General Motors to Jack Welch at General Electric to Steve Jobs at Apple, there is a history of CEOs being tagged as superstars (and indispensable to the organizations that they head), in successful companies. By the same token, as with founders, the failures of businesses often rub off on the people heading them, fairly or unfairly.
As you move down the organization, there can be key players in almost every aspect of business, with scientists at pharmaceutical companies who come up with pathbreaking discoveries that become the basis for blockbuster drugs or design specialists like Jon Ive at Apple, whose styling for Apple’s devices was viewed as a critical component of the company's success. The skills they bring can be unique, or at least very difficult to replace, making them indispensable to the organization's success.
In businesses driven by selling, a master-salesperson or dealmaker can become a central driver of its value, bringing in a clientele that is more attached to the sales personnel than they are to the organization providing the product or service. In businesses like banking, consulting or the law, rainmakers can represent a significant portion of value, and their departure can be not just damaging but catastrophic.
In people-oriented businesses, especially in service, a manager or employee that cultivates strong relationships with customers, suppliers and other employees, can be a key person, with the loss of that person leading to not just lost sales, as clients flee, but create ripple effects across the organization.
In some businesses, the key person may not work for the organization but contribute a significant amount to its value as a spokesperson or product brander. In sports and entertainment, for instance, business can gain value from having a celebrity representing them in a paid or unpaid capacity. In my valuation of Birkenstock for their IPO, just a few weeks ago, I noted the value added to the company by Kate Moss or Steve Jobs wearing their sandals. Over the decades, a significant part of Nike’s value has been gained and sometimes lost from the celebrities who have attached their names to its shoes.
In short, the key person or people in an organization can range the spectrum, with the only thing in common being a “significant effect” on value or price.
Key Person(s): Value effects
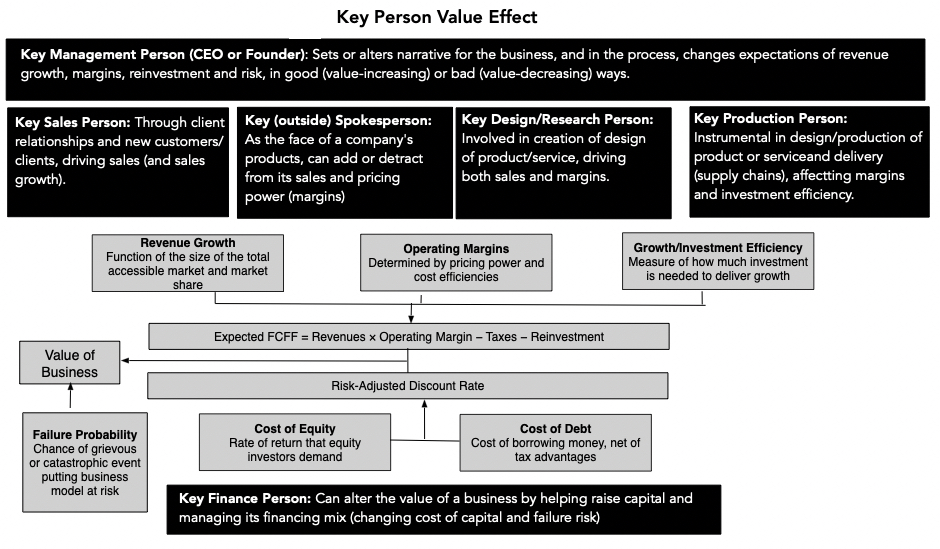
Given my obsession with value, it should come as no surprise that my discussion of key people begins by looking at the many ways that they can affect value. As I identify the multiple key person value drives, note that not all key people affect all value drivers, and the value effects can also vary not only widely across key people, but for the same key person, across time. At the risk of being labeled as a one-trick pony, I will use my intrinsic value framework, and by extension, the It Proposition, where if it does not affect cash flow or risk, it cannot affect value, to lay out the different effects a key person can have on value:
For personnel at the top, and I include founders and CEOs, the effect on value comes from setting the business narrative, i.e., the story that animates the numbers (revenue growth, profit margins, capital intensity and risk) that drives value., and that effect, as I have noted in my earlier discussions of narrative and numbers, can be all encompassing. The effects of people lower down in the organization tend to be more focused on one or two inputs, rather than across the board, but that does not preclude the effect from being substantial. A salesperson who accounts for half the sales of a business and most of its new customers will influence value, through revenues and revenue growth, whereas an operations manager who is a supply chain wizard can have a large impact on profit margins. As someone who teaches corporate finance, I have always tried to pass on the message, especially to those who are headed to finance jobs at companies or investment banks, that of all of the players in an organization, finance people are among the most replaceable, and thus least likely to be key people. It is perhaps the reason that you are less likely to see a company’s value implode even when a well-regarded CFO leaves, though there are exceptions, especially with distressed or declining companies, where financial legerdemain can make the difference between survival and failure.
With this framework, valuing a key person or persons becomes a simple exercise, albeit one that may require complex assumption. To estimate key person value, there are three general approaches:
1. Key person valuation: You value the company twice, once with the key persons included, with all that they bring to it’s cash flows and value, and then again, without those key persons, reflecting the changes that will occur to value inputs:
Value of key person(s) = Value of business with key person - Value of business without key person
A key person whose effect on a business is identifiable and isolated to one of the dimensions of value will be easier to value than one whose effects are disparate and difficult to isolate. Thus, valuing a key salesperson is easier than valuing a key CEO, since the former's effects are only on sales and can be traced to that person's efforts, whereas the effect of a CEO can be on every dimension of value and difficult to separate from the efforts of others in the organization. 2. Replacement Cost: In some cases, the value of a key person can be computed by estimating the cost of replacing that person. Thus, key people with specific and replicable skills, such as skilled scientists or engineers, may be easier to value than key people, with fuzzier skill sets, such as strong connections and people skills. However, finding replacements for people with unique or blended skills can be more difficult, since they may not exist.
3. Insurance cost: Finally, there are some key people in an organization who can be insured, where insurance companies, in return for premium payments, will pay out an amount to compensate for the losses of these key people. For companies that buy insurance, the key person value then become monetized as a cost, reducing the value of these companies when the key person is present, while increasing its value, when it loses that person.
The key person valuation approach, while general, can not only yield different values for key people, but also generate a value effect that is negative for a key person whose influence has become malignant. The framework can also help explain how the value of a key person can evolve over time, from a significant positive at one stage of an organization to neutral later or even a large negative, explaining why some key people get pushed out of organizations, including those that they may have founded.
Key Person(s): Pricing effects
It is true that markets are pricing mechanisms, not instruments for reflecting value, at least in the short term, and it should come as no surprise then that the effects of a key person are captured in pricing premiums or discounts, sometime arbitrary, and sometimes based upon data. In this section, I will start with the practices used by appraisers to try to adjust the pricing of businesses for the presence or potential loss of a key person and then move on to how markets react to the loss of key personnel at publicly traded companies.
In appraisal practice, the effect of the potential loss of an owner, founder or other key person in a business that you are acquiring is usually captured with a key person discount, where you price the business first, based upon its existing financials, and then reduce that pricing by 15%, 20% or more to reflect the absence of the key person. Shannon Pratt, in his widely used work on valuing private companies, suggested a key person discount of between 10%-25%, though he left the number almost entirely to appraiser discretion. In addition, the nature of private company appraisal, where valuations are done for tax or legal purposes, has also meant that the acceptable levels of discount for key people have been determined more by courts, in their rulings on these valuations, than by first principles.
In public companies, the market reaction to the loss of key personnel can be an indication of how much investors priced the presence of those personnel. Empirically, the research in this area is deepest on CEO departures, with the market reaction to those departures broken down by cause into Acts of God (death), firing or retirement.
CEO Deaths: In the HBO hit series, Succession, the death of Logan Roy, the imperious CEO of the company causes the stock price of Waystar Royco, his family-controlled company, to drop precipitously. While that was fiction, and perhaps exaggerated for dramatic effect, there is research that looks at the market reaction to the deaths of CEOs of publicly traded companies, albeit with mixed results. A study of CEO deaths at 240 publicly traded companies between 1950 and 2009 finds that in almost half of all of these cases, the stock price increases on the death of a CEO, and unsurprisingly, the reactions tended to be positive with under-performing CEOs and negative with highly regarded ones. Interestingly, this study also finds that the impact of CEOs, both positive and negative, was greater in the later time periods, than in earlier periods. A different study documented that the stock price reaction to CEO deaths was greater for longer-tenured CEOs in badly performing firms, strengthening the negative value effect argument.
CEO (forced) replacements: CEOs are most likely to be replaced in companies, where their policies are at odds with those that their shareholders desire, but given the powers of incumbency, change may require the presence of a large and vocal shareholder (activist), pushing for change. To the extent that shareholders have good reasons to be disgruntled, the companies can be viewed as case studies for key-person negative value, where the top manager is reducing value with his or her actions. Research on what happens to stock prices and company performance after forced replacements largely confirm this hypothesis, with stock prices rising on the firing, and improved performance following, under a new CEO.
CEO retirements: If CEO deaths represent unexpected losses of key people, and CEO dismissals represent the subset of firms where CEOs are more likely to be value-reducing key people, it stands to reason that CEO retirements should be more of a mixed bag. Research backs up this hypothesis, with the average stock price reaction to voluntary CEO departures being close to zero, with a mildly negative reaction to age-related departures. It is worth noting that market reactions tend to be much more positive, when CEOs are replaced by outsiders than by someone from within the firm, suggesting that shareholders see value in changing the way these businesses are run.
The positive reaction, at least on average, to CEO firing is understandable since CEOs usually get replaced by boards only after extended periods of poor performance at companies or personal scandal, and investors are pricing in the expectation that change is likely to be positive. The positive reaction to some CEO deaths is macabre, but it does reflect the reality that they are more likely to occur in organizations that are badly in need of fresh insights.
There are a few case studies that look at how the market reacts to a company signing or losing a key celebrity spokesperson or product endorser, especially when that loss is unexpected. Thus, when Tiger Woods, who operated as a spokesperson or product endorser for five companies (Accenture, Nike, Gillette, Electronic Arts and Gatorade), had personal troubles that were made public, these five companies collectively lost 2-3% of their market value (about $5-12 billion). That should come as little surprise, since Tiger Wood's product endorsements, prior to this incident, had added significant value to these companies, with one study noting that Nike generated a 10% increase in profits in its golf ball division, after the endorsement. In an earlier episode, Nike also lost billions in market capitalizations, when Michael Jordan, an NBA superstar whose name-branded footwear (Air Jordan) had become a game changer for Nike, unexpectedly announced in 1993, that he would be retiring from basketball, to play baseball. Finally, and this is perhaps a reach at this point, the biggest story coming out of the National Football League (NFL) this year has been the Taylor Swift-Travis Kielce romance, which in addition to creating tabloid headlines, has also increased NFL ratings, especially among women. Is it possible that the person who adds the most value to the NFL this year is not Patrick Mahomes (its highest profile quarterback) or Roger Goodell (its commissioner), but a pop star? Time will tell, but it is not an implausible claim.
Managing Key Person Value
A business that has significant positive value exposure to a key person can try to mitigate that risk, albeit with limits. The actions taken can vary depending on the key person involved, with more effective protections against losses that are easily identifiable.
Insurance: Smaller businesses that are dependent on a person or persons for a significant portion of their revenues and profits can buy insurance against losing them, with the insurance premia reflecting the expected value loss. To the extent that the insurance actuaries who assess the premiums are good at their jobs, companies buying key person insurance even out their earnings, trading lower earnings (because of the premiums paid) in periods when the key person is still present for higher earnings, when they are absent. It is also true that key person insurance is easier to price and buy, when the effects of a key person are separable and identifiable, as is the case of a master salesperson with a track record, than when the effects are diffuse, as is the case for a star CEO who sets narrative.
No-compete clauses: One of the concerns that businesses have with key people is not just the loss of value from their departure, but that these key people can take client lists, trade secrets or product ideas to a competitor. It is for this reason that companies put in no-compete clauses into employment contracts, but the degree of protection will depend on what the key person takes with them, when they leave. No-compete clauses can prevent a key person from taking a client list or soliciting clients at a direct competitor, but will offer little protection when the skills that the person possesses are more diffuse.
Overlapping tenure: As we noted earlier, it is routine, when pricing smaller, personal service businesses to attach a significant discount to the pricing of those businesses, on the expectation that a portion of the client base is loyal to the old owner, not the business. Since this reduces the sales proceeds to the old owner, there is an incentive to reduce the key person discount, and one practice that may help is for the old owner to stay on in an official or unofficial capacity, even after the business has been sold, to smooth the transition.
Team building: To the extent that key people can build teams that reflect and magnify their skills, they are reducing their key person value to the business. That team building includes hiring the “right’ people and not just offering them on-the-job training and guidance, but also the autonomy to make decisions on their own. In short, key people who refuse to delegate authority and insist on micro-management will not build teams that can do what they do.
Succession planning: For key people at the top of organizations, the importance of succession planning is preached widely, but practiced infrequently. A good succession plan starts of course by finding the person with the qualities that you believe are necessary to replicate what the key person does, but being willing to share knowledge and power, ahead of the transfer of power.
As you can see, some of the actions that reduce key people value must come from those key people, and that may seem odd. After all, why would anyone want to make themselves less valuable to an organization? The truth is that from the organization's perspective, the most valuable key people find ways to make themselves more dispensable and less valuable over time by finding successors and building teams who can replicate what they can do. That may be at odds with the key person's interests, leading to a trade off a lower value added from being key people for a much higher value for the organization, and if they own a large enough stake in the latter, can end with being better off financially at the end. I have been open about my loyalty to Apple over the decades, but even as an Apple loyalists, I admire Bill Gates for building a management team that he trusted enough, at Microsoft, to step down as CEO in 2000, and while I cringe at Jeff Bezos becoming tabloid fodder, he too has built a company, in Amazon, that will outlast him.
Determinants of Key Person Value
If key person value varies across businesses and across time, it is worth examining the forces that determine that value effect, looking for both management and investment lessons. In particular, key people will tend to matter more at smaller enterprises than at larger ones, more at younger firms than at mature businesses, more at businesses that are driven by micro factors than one driven by macro forces and more at firms with shifting and transitory moats than firms with long-standing competitive advantages.
Company size
In general, the value of a key person or persons should decrease as an organization increases in size. The value added by a superstar trader will be greater if he or she works at a ten-person trading group than if they work at a large investment bank. There are clearly exceptions to this rule, with Tesla being the most visible example, but at the largest companies, with hundreds or even thousands of employees, and multiple products and clients, it becomes more and more difficult for a single person or even a group of people to make a significant difference.
Stage in Corporate Life Cycle
I have written about how companies, like human beings, are born, mature, age and die, and have used the corporate life cycle as a framework to talk about corporate financial and investment choices. I also believe it provides insight into the key person value discussion:
As you can see, early in the life cycle, where the corporate narrative drives value, a single person, usually a founder, can make or break the business, with his or her capacity to set narrative and inspire loyalty (from employees and investors). As a business ages, CEOs matter less, as the business takes form, and scales up, and less of its value comes from future growth. At mature companies, CEOs often are custodians of value in assets in place, playing defense against competitors, and while they have value, their potential for value-added becomes smaller. At a company facing decline, the value of a key person at the top ticks up again, partly in the hope that this person can resurrect the company and partly because a CEO for a declining company who doubles down on bad growth choices can destroy value over short periods. The research provides support, with evidence that CEO deaths at young companies more likely to evoke large negative stock price reactions.
This life-cycle driven view of the value of to management may provide some perspective into the key person effects at both Open AI and Tesla.
At OpenAI, for better or worse, it is Sam Altman who has been the face of the company, laying out the narrative for the future of AI, and Open AI remains a young company, notwithstanding its large estimated value. While the board of directors felt that Altman was on a dangerous path, the capital providers, which included not only venture capitalists, but Microsoft as a joint-venture investor, were clearly swayed not in agreement, and Open AI’s employees were loyal to him. In short, once Open AI decided to open the door to eventually being not just a money-making business, but one worth $80 billion or more, Altman became the key person at the company, as Open AI’s board discovered very quickly, and to its dismay.
With Tesla, the story is more complicated, but this company has always revolved around Elon Musk. As a young company, where investors and legacy auto companies viewed it as foolhardy in its pursuit of electric cars, Musk's vision and drive was indispensable to its growth and success. As Tesla has brought the rest of the auto business around to its narrative, and become not just a successful company, but one worth a trillion dollars or more at its peak, Musk has remained the center of the story, in good and bad ways. His vision continues to animate the company’s thinking on everything from the Cybertruck to robo-taxis, but his capacity for distraction has also sometimes hijacked that narrative. Thus, the debate of whether Musk, as a key person, is adding or detracting from Tesla’s value has been joined, and while I remain convinced that he remains a net positive, since I cannot imagine Tesla without him, there are many who disagree with me. At the same time, Musk is mortal and it remains an open question whether he is willing to make himself dispensable, by not only building a management teams that can run the company without him, but also a successor that he is willing to share power and the limelight.
In general, the life cycle framework explains why good venture capitalists often spend so much time assessing founder qualities and why public market investors, especially those who focus on mature companies, can base their investments on just financial track records.
Micro versus Macro
There are some companies where value comes more from company-specific decisions on products/services to offer, markets to enter and pricing decisions, and others, where the value comes more from macro variables. A media company, like Disney, where movie or television offerings constantly have to adjust to reflect changing demand and in response to competition, would be an example of the former, whereas an oil company, where it is the oil price that is the key determinant of revenues and earnings, would be an example of the latter.
In general, you are far more likely to find key people, who can add or take away from value at the former (micro companies) than at the latter (macro companies). Consider the heated arguments that you are hearing about Bob Iger and his return to the CEO position at Disney, with Nelson Peltz in the mix, arguing for change. While some of the forces affecting Disney are across entertainment companies, as I noted in this post, I also argued that whether Disney ends up as one of the winners in this space will depend on management decisions on which businesses to growth, which ones to shrink or spin off and how they are run. With Royal Dutch, it is true that canny management can add to oil reserves, by buying them when oil prices are low, but for the most part, much of what happens to it is impervious to who runs the company.
Business Moats
Business moats refer to competitive advantages that companies have over their competitors that allow them to not just grow and be profitable, but to create value by earning well above their cost of capital. That said, moats can range the spectrum, both in terms of sources (cheap raw material, brand names, patents) as well as sustainability (some last for decades and others are transitory). Some moats are inherited by management, and others are earned, and some are high maintenance and others require little care.
In general, there will be less key person value at companies with inherited moats that are sustainable and need little care, and more key person value at companies where moats need to be recreated and maintained. To illustrate, consider two companies at opposite ends of the spectrum. At one end, Aramco, one of the most valuable companies in the world, derives almost all of its value from its control of the Saudi oil sands, allowing it to extract oil at a traction of the cost faced by other oil companies, and it is unlikely that there is any person or group of people in the organizational that could affect its value very much. At the other end, an entertainment software company like Take-Two Interactive is only as good as its latest game or product, and success can be fleeting. It should come as no surprise that there are far more key people, both value-adders and value-destroyers, in these businesses than in most others.
Implications
The notion that a key person or persons can add or detract from the value of an organization is neither surprising nor unexpected, but having a structured framework for examining the value effects can yield interesting implications.
Aging of key person(s)
There are many reasons that key persons leave companies, and while companies can try to stave them off by taking actions to protect key people, there is one reason - aging and death - which are inexorable and inevitable. As key people, especially at the top of an organization age, investors should start factoring in not just their eventual departures, but a decline in effectiveness, as they get older. Speaking of key people in large companies, Berkshire Hathaway has a had a special status, an insurance company with the best portfolio managers in the world in Warren Buffett and Charlie Munger. Well before Munger's passing, Buffett and Munger had bowed to advancing age and had passed the baton on to Ted Weschler and Todd Combs. While Buffett undoubtedly still has a say in investment choices, it is also clear that he has a far lesser role than he used ro, which may explain Berkshire's bet on a company like Snowflake, a company that has a snowball's chance in hell of getting through a Buffett-Munger investment screening.
Are markets building in the recognition that Berkshire Hathaway's future will be in the hands of someone other than the two legendary leaders? I think so, and one way to see how markets have adjusted expectations is by comparing the price to book ratio that Berkshire Hathaway trades at relative to a typical insurance company:
In the last decade, as you can see, Berkshire Hathaway's price to book has drifted down, and relative to insurance companies in the aggregate, the Buffett-Munger premium has largely dissipated, suggesting that while Combs and Weschler are well-regarded stock pickers, they cannot replace Buffett and Munger. That may explain why Berkshire's stock price was unaffected by Munger's passing.
Industry Structure
As we shift away from a twentieth century economy, where manufacturing and financial service companies dominated, to one where technology and service companies are atop the largest company list, we are also moving into a period where value will come as much from key people in the organization as it does from physical assets. It follows that companies will invest more in human capital to preserve their value, and here, as in much of the new economy, accounting is missing the boat. While there have been attempts to increase corporate disclosure about human capital, the impetus seems to be coming more from diversity advocates than from value appraisers. If human capital is to be treated as a source of value, what companies spend in recruitment, training and nurturing employee loyalty is more capital expenditure than operating expense, and as with any other investment, these expenses have to be judged by the consequences in terms of employee turnover and key person losses.
Compensation
To the extent that key people deliver more value to companies, it stands to reason that they will try to claim some or all of that added value for themselves. In organizations where they are valuable key people, you should expect to see much greater differences in compensation across employees, with the most valued key people being paid large multiples of what the typical employee earns. In addition, to encourage these key people to make themselves less key, by building teams and grooming successors, you would expect the pay to be more in the form on equity (restricted stock or options) than in cash.While that may strike you as inequitable or unfair, it reflects the economics of businesses, and legislating compensation limits will either cause key people to move on or to find loopholes in the laws.
Lest I be viewed as an apologist for monstrously large top management compensation packages, the key person framework can be a useful in holding to account boards of directors that grant absurdly high compensation packages to top managers in companies, where their presence adds little value. Thus, I don’t see why you would pay tens of millions of dollars to the CEOs of Target (a mature to declining retail company, no matter who runs it), Royal Dutch (an almost pure oil play) or Coca Cola ( where the management is endowed with a brand name that they had little role in creating). This may be a bit unfair, but I would wager that an AI-generated CEO could replace the CEOs of half or more of the S&P 500 companies, and no one would notice the difference.
In conclusion
There are many canards about intrinsic valuation that are in wide circulation, and one is that intrinsic valuations do not reflect the value of people in a company. That is not true, since intrinsic valuations, done right, should incorporate the value of a key person or people in a business, reflecting that value in cash flows, growth or risk inputs. That said, intrinsic value is built, not on nostalgia or emotion, but on the cold realities that key people can sometimes destroy value, that a key person in a company can go from being a value creator to a value destroyer over time and that key people, in particular, and human capital, in general, will matter less in some companies (more mature, manufacturing and with long-standing competitive advantages) than in other companies (younger, service-oriented and with transitory and changing moats.