I have looked at country risk, in all its dimensions, towards the middle of each year, for the last decade, for many reasons. One is curiosity, as political and economic crises roll through regions of the world, roiling long-held beliefs about safe and risky countries. The other is pragmatic, since it is almost impossible to value a company or business, without a clear sense of how risk exposure varies across the world, since for many companies, either the inputs to or their production processes are in foreign markets or the output is outside domestic markets. Coca Cola is a US company, in terms of history and incorporation, but it generates a significant portion of its revenues from the rest of the world. Royal Dutch may be a UK (or Dutch) company, in terms of incorporation and trading location, but it extracts its oil and gas from some of the riskiest parts of the world. Since country risk is multidimensional and dynamic, my annual country risk update runs to more than a hundred (boring) pages, but I will try to summarize what the last year has brought in this post.
Drivers of Country Risk
What makes some countries riskier than others to operate a business in? The answer is complicated, because everything has an effect on risk, starting with the political governance system (democracy, dictatorship or something in between), the extent of corruption in the system, the legal system (and its protection for property rights) and the presence or absence of violence in the country (from wars within or without). The table below, which I have used in prior updates, captures the mail drivers of country risk:
Things get even more complicated when you recognize that these drivers are often correlated with, and drive, each other. Thus, a country that is ravaged by war and violence is more likely to have a weak legal system and be corrupt. Furthermore, all of these risk exposures are dynamic, and change over time, as governments change, violence from internal or external forces flares up.
As you assess these factors, you can see very quickly that country risk is a continuum, with some countries exposed less to it than others. It is for that reason that we should be cautious about discrete divides between countries, as is the case when we categorize countries into developed and emerging markets, with the implicit assumption that the former are safe and the latter are risky. To the extent that divide is not just descriptive, but also drives real world investment, both companies and investors may be misallocating their capital, and I will argue for finer delineations of risk.
1. Democracy across the Globe
If your focus stays on economic risk, the question of whether democracies or authoritarian regimes are less risky for businesses to operate in depends in large part on whether these businesses are more unsettled by day-to-day continuous risk, which is often the case with democracies, where the rules can change when new governments gets elected, or by discontinuous risk, which can lie dormant for long periods, but when it does occur, it is larger and sometimes catastrophic, in an authoritarian government. Assessing freedom and democracy in countries is a fraught exercise, with both political and regional biases playing out, and that should be kept in mind when you look at the heat map that shows the results of the Economist's measures of democracy, by country and region, in 2022, as well as trend lines across time:
While the global aggregate value for 2022 is very similar to the value in 2021, there has been a significant drop off since 2016, at least according to this measure. In 2022, North America and Western Europe scored highest on the democracy index, and Middle East and Africa scored the lowest.
In my view, the question of whether businesses prefer the continuous change (or, in some cases, chaos) that characterizes democracies or the potential for discontinuous and sometimes jarring change in authoritarian regimes has driven the debate of whether a business should feel more comfortable investing in India, a sometimes chaotic democracy where the rules keep changing, or in China, where Beijing is better positioned to promise continuity. For three decades, China has won this battle, but in 2023, the battleground seems to be shifting in favor of India, but it is still too early to make a judgment on whether this is a long term change, or just a hiccup.
2. Violence across the Globe
When a country is exposed to violence, either from the outside or from within, it not only exposes its citizens to physical risk (of assault or death), but also makes it more difficult to run businesses within its borders. That risk can show up as costs (of buying protection or insurance) or as uninsurable risks that drive up the rates of return investors and businesses need to make, in order to operate. Again, there are subjective judgments at play in these measures, but the map below gives you 2023 scores for peace scores, with lower (higher) scores indicating less (more) exposure to violence.
Iceland and Denmark top the list of most peaceful countries, but in a sign that geography is not destiny, Singapore makes an appearance on that list as well. On the lease peaceful list, it should come as no surprise that Russia and Ukraine are on the list, but Sub-Saharan Africa is disproportionately represented.
3. Corruption across the Globe
Corruption is a social ill that manifests itself as a cost to every business that is exposed to it. As anyone who has ever tried to get anything done in a corrupt setting will attest, corruption adds layers of costs to routine operations, thus become an implicit tax that companies pay, where the payment instead of going to the public exchequer, finds its way into the pockets of intermediaries. Transparency International measures corruption scores, by country, across the world and their 2022 measures are in the map below:
Much of Western Europe, Australia & New Zealand and Canada/United States fall into the least corrupt category, but corruption remains a significant concern in much of the rest of the world. While it easy to attribute the corruption problem to politicians and governments, it is worth noting that once corruption becomes embedded in a system, it is difficult to remove, since the structure evolves to accommodate it. Put simply, a system where the rule-makers, regulators and bureaucrats get paid a pittance (on the assumption that they will be supplement their pay with side payments) to sign off on contracts that are worth billions will inevitably create corruption as a side cost.
4. Legal Protection across the Globe
To operate a business successfully, you need a legal system that enforces contractual obligations and protects property rights, and does so in a timely manner. When a legal system allows contracts and legal agreements to be breached, and property rights to be violated, with no or extremely delayed consequences, the only businesses that survive will be the ones run by lawbreakers, and not surprisingly, violence and corruption become part of the package. The Property Rights Alliance measures the protection offered for property rights (intellectual, physical), with higher (lower) scores going with better (worse) protection, and their most recent update (from 2022) is captured in the picture below:
By now, you can see the point about the correlation across the various dimensions of country risk, with the parts of the world (North America, Europe, Australia and Japan) that have the most democratic systems and the least corruption scoring highest on the legal protection scores. Conversely, the regions (Africa, large portions of Asia and Latin America) that are least democratic, with the most violence and corruption, have the most porous legal systems.
Measures of Country Risk
With the long lead in on the dimensions of country risk, we can now turn to the more practical question of how to convert these different components of risk into country risk measures. We will start with a limited measure of the risk of default on the part of governments, i.e., sovereign default risk, before expanding that measure to consider other country risks, in political risk scores.
1. Default Risk
Businesses and individuals that borrow money sometimes find themselves unable to meet their contractual obligations, and default, and so too can governments. The difference is that government or sovereign default has much greater spillover effects on all entities that operate within its borders, thus creating business risks. We start with an assessment of sovereign ratings, a widely accessible and hotly contested, of government default risk and then move on to market-based measures of this risk in the form of sovereign default spreads.
a. Sovereign Ratings
The most widely used measures of sovereign default risk come from a familiar source for default risk measures, the ratings agencies. S&P, Moody's and Fitch, in addition to rating companies for default risk, also rate governments, and they rate them both on local currency debt, as well as foreign currency debt. The reason for the differentiation is simple, since countries should be less likely to default, when they borrow in their domestic currencies, than when they borrow in a foreign currency. The table below summaries the sovereign local currency ratings for countries in June 2023, from S&P and Moody's:
Local Currency Ratings for countries (Some UAE emirates have ratings that are independent of the ratings for the UAE, because they issue their own sovereign debt)
The ratings scheme mirrors the one used to rate companies, with the key difference being at the Aaa (AAA) rating, with a sovereign getting that rating viewed as having no default risk, whereas a corporate with that rating still has some. If you are wondering why there should be any default risk when governments borrow in a domestic currency, since these governments should be able to print money to pay off debt, the answer is that money-printing debases a currency and given a choice between currency debasement and default, many countries choose to default. The figure backs up this proposition:
Note that while countries are less likely to default on local currency than foreign currency bonds, the default rates in the former remain substantial. In addition, the good news, if you are a user of sovereign ratings, is that they clearly are correlated strongly with ratings, with higher default rates for lower-rated sovereigns.
I know that there are many who have issues with the ratings agencies, but I do think that the conflict of interest story, where ratings agencies attach higher ratings to entities, because they get paid to rate them, is overdone, and especially so with sovereign ratings (where the revenue streams are paltry). In my view, the biggest problem with ratings agencies is not that they are biased, but that they take too long to adjust ratings to changes in a country and that they sometimes underrate or overrate regions of the world, because of their histories. Consequently, Latin American countries have to work harder to improve their ratings, or sustain current ratings, than the US or European countries, which get a bye, because they do not have a history of default.
b. Sovereign CDS Spreads
One of the advantages of a market-based measure is that the market price reflects investor perceptions of risk at the moment. Sovereign Credit Default Swaps (CDS) offer a market-based measure of default risk, since investors buy these swaps as protection against default on government bonds. When the sovereign CDS market came into being a few decades ago, there were only a handful of countries that were traded, but the market has expanded, and there are traded credit default swaps on almost 80 countries in June 2023. The graph below shows the sovereign CDS levels, by country:
There are three things to note, as you browse these numbers. The first is that these are dollar spreads (though a Euro CDS market exists as well), and thus are most suited for use with dollar-denominated government bonds. The second is that what comprises default in the sovereign CDS market may not coincide with investor definitions of default , though there are approaches that can be used to back out the likelihood of default from a CDS value. The third is that there are no countries with traded CDS that have zero risk of default, at least according to the sovereign CDS market. Consequently, I have also computed a version of the sovereign CDS spread that is net of the US CDS (on the assumption that default risk is zero in the US, a debatable proposition after the recent debt ceiling debate).
Is a sovereign CDS spread a better measure of default risk than a sovereign rating? The answer is mixed. It is true that a sovereign CDS spread gives you a more updated measure of default risk, since it is market-set, but as with all market-based measures, it comes with far more volatility and overshooting than a ratings-based spread, and it is available for only a subset of countries. My suggestion is that for countries where recent political or economic events would lead you to believe that sovereign rating is dated, you should switch to using sovereign CDS spreads.
2. Risk Scores
The advantage of default spreads is that they provide an observable measure of risk that can be easily incorporated into discount rates or financial analysis. The disadvantage is that they are focused on just default risk, and do not explicitly factor in the other risks that we enumerated in the last section. Since these other risks are so highly correlated with each other, for most counties, it is true that default risk becomes an reasonable proxy for overall country risk, but there are some countries where this is not the case. Consider portions of the Middle East, and especially Saudi Arabia, where default risk is not significant, since the country borrows very little and has a huge cash cushion from its oil reserves. Investors in Saudi Arabia are still exposed to significant risks from political upheaval or unrest, and may prefer a more comprehensive measure of country risk.
There are many services, including the World Bank and the Economist, who offer comprehensive country risk scores, and the map below includes composite country risk scores from Political Risk Services in June 2023:
The pluses and minuses of comprehensive risk scores are visible in this table. In addition to capturing risks that go beyond default, Political Risk Services also measures risk scores for frontier markets (like Syria, Sudan and North Korea), which have no sovereign ratings. The minuses are that the scores are not standardized; for instance, PRS gives its highest scores to the safest countries, whereas the Economist gives the lowest scores to the safest countries. In addition, the fact that the country risk is measured with scores may lead some to believe that they are objective measures of country risk, when, in fact, they are subjective judgments reflecting what each service factors into the scores, and the weights on these factors. Just to illustrate the contradictions that can result, PRS gives Libya a country risk score that is higher (safer) than the scores it gives United States or France, putting them at odds with most other services that rank Libya among the riskiest countries in the world.
Equity Risk across Countries
Default risk measures how much risk investors are exposed to, when investing in bonds issued by a government, but when you own a business, or the equity in that business, your risk exposure is not just magnified, but also broader. For three decades, I have wrestled with measuring this additional risk exposure and converting that measurement into an equity risk premium, but it remains a work in progress.
To estimate the equity risk premium, for most countries I start with default spreads, either based on the sovereign ratings assigned by the ratings agencies, or from the market, in the form of sovereign CDS spreads. To account for the fact that equities are riskier than bonds, I scale the standard deviation of an emerging market equity index (S&P Emerging BMI) to an emerging market government bond ETF (iShares JPM USD Emerging Markets Bond ETF), and use this ratio (1.42 in my July 2023 update) and apply this scalar to the default spread, to arrive at a country risk premium. Adding that country risk premium on to the premium that I estimate for the S&P 500 (which was 5.00% at the start of July 2023, and is my measure of a mature market premium), yields the total equity risk premium for a country:
To provide an example, consider India, which with a sovereign rating of Baa3, has a default spread of 2.35% in July 2023. Multiplying this default spread by the scalar (1.42) and adding to the equity risk premium for the S&P 500 results in an equity risk premium of 8.33% for India.
India ERP = Implied ERP for S&P 500 + Default spread for India * Scalar for Equity Risk
= 5.00% + 2.35% (1.42) = 8.33%
It is worth noting that using the sovereign CDS spread for India of 1.42% would have resulted in a lower equity risk premium for India, at 7.02%.
Using the ratings-based default spreads as starting points, I estimate the equity risk premiums for all countries rated by either S&P and Moody's in the picture below. (For the many people who will point to their country's geographical boundaries being misrepresented on this map, please cut me some slack. This map is purely a device to summarize equity risk premiums, by countries, not arbitrate on where borders should go. Suffice to say that if you are operating a business in a part of the world that is contested by two countries, your risk levels are in the danger zone, no matter where in the world you are.)
You will notice that there are countries that are not rated (NR) that have equity risk premiums attached to them. For these frontier markets, I used the PRS score for the country as a starting point, found other (rated) countries with similar PRS scores, and extrapolated an equity risk premium. The caveat, though, is that these equity risk premiums are only as good as the PRS scores that goes into them, and you can see the effect in Libya, which if PRS is right, is a green (low risk) standout in a region (North Africa) of red.
Caveats and Questions
I started publishing equity risk premiums about 30 years ago, and while data sources have become richer and more complete, the core approach that I use for the estimation has remaining stable. That said, there is no intellectual firepower or research behind these numbers, since I am letting the default ratings agencies and risk measurement services carry that weight. I am not a country risk researcher, and I try not to let my personal views alter the numbers that emerge from the analysis, since that would open the door to my biases. I will use three countries in the latest update to illustrate my point:
Saudi Arabia: As I noted earlier, using default spreads as my starting point can result in understating the risk premium for countries like Saudi Arabia, which score low on default risk but high on other risks.
Libya: As indicated in the last section, the equity risk premium for Libya, an unrated country, is entirely based upon the country risk score from PRS. That country risk score is surprisingly high (indicating low risk) and it results in an equity risk premium that is low, relative to other countries in the region.
China: China has a high sovereign rating and a low sovereign CDS spread, indicating that investors in Chinese government bonds don't see much default risk in the country. In the aftermath of a Beijing crackdown on Chinese tech giants and talk of a trade war between China and the US, the perception seems to be that China has become a riskier place to invest. That may or may not be true, but looking at how Chinese equities are priced, trading still at some of the highest multiples of earnings in the world, investors in equity markets don't seem to share that view.
With all three of these countries, I chose not to change the numbers that emerged from the data, but if you have strong views on these countries or others, nothing is stopping you from replacing my numbers with yours.
Company Hurdle Rates
This post has already become much longer than I intended it to be, but I want to end by bringing these equity risk premiums down to the company level, and examining how they play out in hurdle rates, to be used in investment analysis by companies and valuation by investors.
The Currency Question
In my discussion so far, you will notice that I have stayed away from talking about currency risk in my equity risk premium discussion and from currency choices in investment analysis. I have my reasons.
I know that the currency choice is the source of angst for many analysts, and I think unnecessarily so. Your choice of currency will affect your cash flows and your discount rates, but only because each currency brings it's own expectations of inflation, with higher inflation currencies leading to higher growth rates for cash flows and higher discount rates.
The mechanism that allows for the discount rate adjustment to reflect currency is the risk free rate, with currencies with higher expected inflation carrying higher risk free rates. In a downloadable dataset linked at the end of this post, I estimate riskfree rates in global currencies, based upon the US T.Bond rate as the riskfree rate in US dollars) and differential inflation. To provide an example, using the IMF's estimate of expected inflation for 2023-28 of 3% for the US and 13.50% for Egypt, and building on the US treasury bond rate of 3.80%. the riskfree rate in Egyptian pounds is 14.38%.
Riskfree Rate in EGP = (1+ US T.Bond Rate) (1 + Exp Infl in Egypt) (1+ Exp Infl in US) -1
= (1.038)* (1.135/1.03) -1 = .1438 or 14.38%)
To the extent that currency risk adds to the operating risk of a company, it is, in my view, already embedded in the equity risk premiums that I have computed in the last section. After all, countries with unstable governments, plagued by war and corruption, also have the most unstable currencies. The other reason to tread lightly with currency risk is that for investors with global portfolios, it becomes diversifiable risk, as some companies benefit as a currency strengthens or weakened more than expected and others lose for exactly the same reason.
My advice to you when you make a currency choice for your analysis is that you pick a currency that you are comfortable working with, but then make sure that you stay consistent with that currency in all of your estimates. Thus, if you choose to value a Russian company in Euros, rather than rubles, make sure that your growth rates reflect inflation in the Euro zone, but that you risk premiums and real growth reflect its Russian operations.
Exposure to Country Risk
For much of my valuation journey, the status quo in valuation has been to look at where a company is incorporated to determine its risk exposure (and the equity risk premium to use in assessing a hurdle rate). While I understand that where you are incorporated and traded can have an effect on your risk exposure, I think it is dwarfed by the risk exposure from where you operate. A company that is incorporated in Germany that gets all of its revenues in Turkey, is far more exposed to the country risk of Turkey than that of Germany. In the picture below, I contrast the traditional country-of-incorporation based risk measure with my alternative, where equity risk premiums come from where you operate:
We can debate how best to measure operating risk exposure, since it can come from both where you sell your products and services (revenues) as well as where you produce those products and services.
There are implications not just for investors, but for companies. For investors, an operating-risk perspective will mean that there are some emerging market companies that others may perceive as risky, simply because of their country of incorporation, but are much safer, because they get their revenues from much safer parts of the world. Embraer, the Brazilian aerospace company, and Tata Consulting Services, an Indian software company, would be good examples. Conversely, there are developed market companies that are significantly exposed to country risk, either because of where they produce (Royal Dutch) or where they sell their products and services (Coca Cola). For multinational companies, an operating risk perspective will imply that there can be no one hurdle rate across geographies, since a project in Turkey should require a higher equity risk premium (and hurdle rate) than an otherwise similar project in Germany.
Conclusion
It is ironic that a post that was meant to shorten and summarize a long paper has itself stretched to become the equivalent of a long paper, and I apologize. I do hope that you get a chance to read the paper or at least review my country risk measures in this post, since there is significant room for improvement. I don't have all the answers, and I probably never will, but progress is incremental, and each year, I hope that I can add a tweak or a component that will move me in the right direction. Also, please don’t take any of these numbers personally. In short, if you feel that I have overestimated the risk in your country and given it an equity risk premium that you believe is undeservedly high, it is not because I do not like you and your country. It is entirely Moody’s fault for giving your country too low a rating, and you should take it up with them!
I am not a market prognosticator for a simple reason. I am just not good at it, and the first six months of 2023 illustrate why market timing is often the impossible dream, something that every investor aspires to be successful at, but very few succeed on a consistent basis. At the start of the year, the consensus of market experts was that this would be a difficult year for markets, given the macro worries about inflation and an impending recession, and adding in the fear of the Fed raising rates to this mix made bullishness a rare commodity on Wall Street. Markets, as is their wont, live to surprise, and the first six months of 2023 has wrong-footed the experts (again).
The Start of the Year Blues: Leading into 2023
As we enjoy the moment, with markets buoyant and economists assuring us that the worst is behind us, both in terms of inflation and the economy, it is worth recalling what the conventional wisdom was, coming into 2023. After a bruising year for every asset class, with the riskiest segments in each asset class being damaged the most, there were fears that inflation would not just stay high, but go higher, and that the economy would go into a tailspin. While this may seem perverse, the first step in understanding and assessing where we are in markets now is to go back and examine where things stood then.
In my second data update post from the start of this year, I looked at US equities in 2022, with the S&P 500 down almost 20% during the year and the NASDAQ, overweighted in technology, feeling even more pain, down about a third, during the year.
Looking across company groupings, returns on stocks in 2022 flipped the script on the market performance over much of the prior decade, with the winners from that decade (tech, young companies, growth companies) singled out for the worst punishment during the year.
While stocks had a bad year (the eighth worst in the last century), the bond market had an even worse one. In my third post at the start of 2023, I looked at US treasuries, the long-touted haven of safety for investors. In 2022, they were in the eye on the storm, with the ten-year US treasury bond depreciating in price by more than 19% during the year, the worst year for US treasury returns in a century.
The decline in bond prices was driven by surging interest rates, with short term treasuries rising far more than longer term treasuries, and the yield curve inverted towards the end of the year.
The rise in US treasury rates spilled over into the corporate bond market, causing corporate bond yields to rise. Exacerbating the pain, corporate default spreads rose during the course of 2022:
While default spreads rose across ratings classes, the rise was much more pronounced for the lowest ratings classes, part of a bigger story about risk capital that spilled across markets and asset classes. After a decade of easy access, translating into low risk premiums and default spreads, accompanied by a surge in IPOs and start-ups funded by venture capital, risk capital moved to the sidelines in 2022.
In sum, investors were shell shocked at the start of 2023, and there seemed to be little reason to expect the coming year to be any different. That pessimism was not restricted to market outlooks. Inflation dominated the headlines and there was widespread consensus among economists that a recession was imminent, with the only questions being about how severe it would be and when it would start.
The Market (and Economy) Surprises: The First Half of 2023
Halfway through 2023, I think it is safe to say that markets have surprised investors and economists again, this year. The combination of high inflation and a recession that was on the bingo cards of some economists at the start of 2023 did not manifest, with inflation declining sooner than most expected during the year:
It is true that the drop in inflation was anticipated by some economists, but most of them also expected that decline to come from a rapidly slowing economy, i.e., a recession and to be Fed-driven. That has not happened either, as employment numbers have stayed strong, housing prices have (at least up till now) absorbed the blows from higher mortgage rates and the economy has continued to grow.
It is true that economic activity has leveled off and housing prices have declined a little, relative to a year ago, but given the rise in rates in 2022, those changes are mild. If anything, the economy seems to have settled into a stable pattern, albeit at the high levels that it reached in the second half of 2021. I know that the game is not done, and the long-promised pain may still arrive in the second half of the year, but for the moment, at least, markets have found some respite.
During the course of 2023, the Fed was at the center of most economic storylines hero to some and villain to many others, with every utterance from Jerome Powell and other Fed officials parsed for signals about future actions. That said, it is worth noting that there is very little of consequence in the economy or the market, in 2023, that you can attribute to Fed activity. The Fed has raised the Fed Funds rate multiple times this year, but those rate increases have clearly done nothing to slow the economy down and inflation has stabilized, not because of the Fed but in spit of it. I know that there are many who still like to believe that the Fed sets interest rates, but here is what market interest rates (in the form of US treasury rates) have done during 2023:
If there is a Fed effect on interest rates, it is almost entirely on the very short end of the spectrum, and not on longer term rates; the ten-year and thirty-year treasury bond rates have declined during the year. That does not surprise me, since I have never bought into the “Fed did it” theme, and have written multiple posts about why it is inflation and economic growth that drive interest rates, not central banks. As inflation has dropped and the economy has kept its footing, the corporate bond market has benefited from default spreads declining, as fears subside:
As in 2022, the change in default spreads is greatest at the lowest ratings, with the key difference being that spreads are declining in 2023, rather than increasing, though the spreads still remain significantly higher than they were at the start of 2022.
Stock Markets Perk Up: The First Half of 2023
I noted that risk capital retreated from markets in 2022, with negative consequences for risky asset classes. To the extent that some of that risk capital is coming back into the markets, equity markets have benefited, with benefits skewing more towards the companies and markets that were punished the most in 2022. To understand the equity comeback in 2023, I start by looking at the increase in market capitalizations, in US $ terms, across the world in the first six months of the year, with the change in market capitalizations in 2022 to provide perspective:
In US dollar terms, global equities have reclaimed $8.6 trillion in market value in the first six months in the year, but the severity of last year's decline has still left them $14.4 trillion below their values from the start of 2022. Looking across regions, US equities have performed the best in the first six months of 2023, adding almost 14% ($5.6 trillion) to market capitalizations, regaining almost half of the value lost in last year's rout. In US dollar terms, China was the worst performing region of the world, with equity values down 1.01% in the first six months on 2023, adding to the 18.7% that was lost last year. The two best performing parts of the world in 2022, Africa and India, performed moderately well in the first half of 2023. In US dollar terms, Latin America was flat in the first half of 2023, though there were a couple of Latin American markets that delivered stellar returns in local currency terms, albeit with high inflation eating away at these returns. It is currency rate changes that explains that contrast between local currency and dollar returns, and in the graph below, I look at the US dollar's performance broadly (against other currencies) as well as against emerging market currencies , between 2020 and 2023;
After strengthening in 2022, the US dollar has weakened against most currencies in 2023, albeit only mildly.
US Equities in 2023: Into the Weeds!
The bulk of the surge in global equities in 2023 has come from US stocks, but there are many investors in US stocks who are looking at their portfolio performance this year, and wondering why they don't seem to be sharing in the upside. In this section, I will start by looking with an overall assessment of US equities (levels and equity risk premiums) before delving into the details of the winners and losers this year.
Stocks and the Equity Risk Premium
I start my assessment of US equities by looking at the performance of the S&P 500 and the NASDAQ during the first half of this year:
As you can see, why the S&P has had a strong first half of 2023, increasing 15.91%, the NASDAQ has delivered almost twice that return, with its tech focus. One reason for the rise in stock prices, at least in the aggregate, has been a dampening of worries of out-of-control inflation or a deep recession, and this drop in fear can be seen in the equity risk premium, the price of risk in the equity market. In the figure below, I have graphed my estimates of expected returns on stocks and implied equity risk premiums through 2022 and the first six months of 2023:
After a year for the record books, in 2022, when the expected return on stocks (the cost of equity) increased from 5.75% to 9.82%, the largest one-year increase in that number in history, we have had not just a more subdued year in 2023, but one where the expected return has come back down to 8.81%. In the process, the implied equity risk premium, which peaked at 5.94% on January 1, 2023, is back down to 5% at the start of July 2023. Even after that drop, equity risk premiums are still at roughly the average value since 2008, and significantly higher than the average since 1960. If the essence of a bubble is that equity risk premiums become "too low", the numbers, at least for the moment, don't seem to signaling a bubble (unlike years like 1999, when the equity risk premium dropped to 2%).
Sector and Industry
The divergence between the S&P 500 and the NASDAQ's performance this year provides clues as to which sectors have benefited the most this year, as risk has receded. In the table below, I break all US equities into sectors and report on performance, in 2022 and in the first half of 2023:
As you can see, four of the twelve sectors have had negative returns in 2023, with energy stocks down more than 17% this year. The biggest winner, and this should come as no surprise, has been technology, with a return of 43% in 2023, and almost entirely recovering its losses in 2022. Financials, handicapped by the bank runs at SVB and First Republic, have been flat for the year, as has been real estate. Communication services and consumer discretionary have had a strong first half of 2023, but remain more than 20% below their levels at the star of 2022.
Breaking sectors down into industry-level details, we can identify the biggest winners and losers, among industries. In the table below, I list the ten worst performing and best performing industry groups, based purely on market capitalization change in the first half of 2023:
The worst performing industry groups are in financial services and energy, with oilfield services companies being the worst impacted. The best performing industry group is auto & truck, but those results are skewed upwards, with one big winner (Tesla) accounting for a large portion of the increase in market capitalization in the sector. There are several technology groups that are on the winner list, not just in terms of percentage increases, but also in absolute value changes, with semiconductors, computers/peripherals and software all adding more than a trillion dollars in market capitalization apiece.
Market Capitalization and Profitability
The first six months of the year have also seen concentrated gains in a larger companies and this can be seen in the table below, where I break companies down based upon their market capitalizations at the start of 2023 into deciles, and then break the stocks down in each decile into money-making and money-losing companies, based upon net income in 2022:
Again, the numbers tell a story, with the money-making companies in the largest market cap decile accounting for almost all of the gain in market cap for all US equities; the market capitalization of these large money-making companies increased by $5.3 trillion in the first six months of 2023, 97.2% of the $5.45 trillion increase in value for all US equities.
Value and Growth
Over the last decade, I have written many posts about how old-time value investing, with its focus low PE and low price to book stocks, has lagged growth investing, with high growth stocks that trade at higher multiples of earnings and book value delivering much higher returns than old-time value stocks (low PE ratios, high dividend yields etc.). In 2022, old-time value investors felt vindicated, as the damage that year was inflicted on the highest growth companies, especially in technology. That celebration has not lasted long, though, since in 2023, we saw a return to a familiar pattern from the last decade, with the highest price to book stocks earning significantly higher returns than the stocks with the lowest price to book ratios:
As you can see from the chart, almost all of the value increase in US equities has come from the top two deciles of stocks, in terms of price to book ratios. Looking at value and growth go back and forth between the winning and losing columns in 2023, I believe that this is a pattern that will continue to play out for the rest of the decade, with no decisive winner.
An Assessment
I know that one of the critiques of this market rise is that it has been uneven, but almost all market recoveries are uneven, with some groupings of companies always doing better than others. That said, there are lessons to be learned from looking at the winners and the losers in the first half of 2023 market sweepstakes:
Big tech: There is no doubt that this market has been largely elevated not just by tech companies, but by a subset of large tech companies. Seven companies (Apple, Microsoft, NVIDIA, Amazon, Tesla, Meta and Alphabet) have seen their collective market capitalization increase by $4.14 trillion in the first half of 2023, accounting for almost 80% of the overall increase in equity values at all 6669 publicly traded US equities. If these stocks level off or drop, the market will have trouble finding substitutes to keep the market pushing higher, simply because of the size of the hole that will need to be filled.
With a profitability skew: While this does seem like a reversion to the tech boom that drove markets prior to 2022, the market seems to be more inclined to rewarding money-making tech companies, at the expense of money-losers. If risk capital is coming back in 2023, it is being more selective about where it is directing its money, and it is therefore not surprising that IPOs, venture capital and high yield bond issuances have remained mired in 2022 (low) levels.
And an economic twist: One reason that these big and money-making tech companies may be seeing the return of investor money is that they have navigated the inflation storm relatively unscathed and some have emerged more disciplined, from the experience. The two best cases in point are Meta and Google, both of which have not only reduced payrolls but also seem to have shifted their narrative from a relentless pursuit of growth to one of profitability.
It is true that as market rallies lengthen, they draw in more stocks into their orbit, and it is possible that the market rally will broaden over the course of the year. That said, this has been a decade of unpredictability, starting with the first quarter of 2020, where COVID ravaged stocks, and I don't think it makes much sense to take charts from 2008 or 2001 or earlier and extrapolating from those.
The Rest of the Year: What's coming?
The market mood is buoyant, as investors seem to be convinced that we have dodged the bullet, with inflation cooling and a soft landing for the economy. The lesson that I have learned not just from the first six months of 2023, but from market performance over the last three years, has been that macro forecasting is pointless, and that trying to time markets is foolhardy. If I were to make guesses about what the rest of the year will bring, here are my thoughts:
On inflation, the good news on inflation in the first half of the year should not obscure the reality that the inflation rate, at 3% in June, still remains higher than the Fed-targeted value (of 2%). That last stretch getting inflation down from 3% to below 2% will be trench warfare, and we will be exposed to macro shocks (from energy prices or regional unrest) that can create inflationary shocks.
On the economy, notwithstanding good employment numbers, there are signs that the economy is cooling and it is again entirely possible that this turns into a slow-motion recession, as real estate (especially commercial) succumbs to higher interest rates and consumers start retrenching.
On interest rates, I do think that hoping and praying that rates will go back to 2% or lower is a pipe dream, as long as inflation stays at 3% or higher. In short, with or without the Fed, long term treasury rates have found a steady state at 3.5% to 4%, and companies and investors will have to learn to live with those rates. I have never attached much significance to the yield curve inversion as a predictor of economic growth, but that inversion is unlikely to go away soon, as near term inflation remains higher than long term expectations.
On equities, the one certainty is that there will be uncertainties, and it is unlikely that the market will repeat its success in the second half of 2023. I did value the S&P 500 at the start of the year, and and argued that it was close to fairly valued then. Updating this valuation to reflect updated perspectives on both dimensions, as well as an index price that is about 16% higher, here is what I see:
Note that I have used the analyst projections of earnings for the index for 2023 to 2025, and adjusted the cash payout over time to reflect reinvestment needed to sustain growth in the long term (set to 3.88%, after 2027). After the run up in stock prices in the first six months, stocks look fairly valued, given estimated earnings and cash flows, and assuming that long term rates have found their steady state. (Unlike market strategies who provide target levels for the index, an intrinsic value delivers a value for the index today; to get an estimate of what translates into as a target level of the index, you can apply the cost of equity as the expected return factor to get index levels in future time periods.)
It goes without saying, but I will say it anyway, that the economy may still go into a recession, analysts may be over estimating earnings and inflation may make a come back (pushing up long term rates). If you have concerns on those fronts, your investing should reflect those worries, but your returns will be only as good as your macro forecasting abilities. Mine are not that good, and it is why I steer away from grandiose statements about equities being in a bubble or a bargain. While uncertainties abound, there is one thing I am certain about. I will be wrong on almost every single one of these forecasts, and there is little that I can or want to do about that. That is why I demand an equity risk premium in the first place, and all I can do is hope that it large enough to cover those uncertainties.
A Time for Humility
If the greatest sin in investing is arrogance, markets exist to bring us back to earth and teach us humility. The first half of 2023 was a reminder that no matter who you are as an analyst, and how well thought through your investment thesis is, the market has other plans. As you listen to market gurus spin tales about markets, sometimes based upon historical data and compelling charts, it is worth remembering that forecasting where the entire market is going is, by itself, an act of hubris. In the spirit of humility, I would suggest that if you were a winner in the first half of this year, recognize that much of that can be attributed to luck, and what the market gives, it can take away. By the same token, if you were a loser over the course of the last six months, regret should not lead you to try to load up on the winners over that period. That ship has sailed, and who knows? Your loser portfolio may be well positioned to take advantage of whatever is coming in the next six months.
I will start this post with a couple of confessions. The first is that my portfolio has held up well this year, in a market that has been top-heavy and tech-driven, and one big reason is that it contains both NVIDIA and Microsoft, two companies that have benefited from the AI story. The second is that much as I would like to claim credit for foresight and forward thinking, AI was not even a speck in my imagination when I bought these stocks (Microsoft in 2014 and NVIDIA in 2018). I just happened to be in the right place at the right time, a reminder again that being lucky often beats being smart, at least in markets. That said, NVIDIA’s soaring stock price has left me facing that question of whether to cash out, or let my money ride, and thus requires an assessment of how the promise of AI play’s out in its value. Along the way, I will take a look at the promise of AI, as well as the perils for investors, drawing on lessons from the past.
The Semiconductor Business
The semiconductor business, in its current form, had its growth spurt as a consequence of the PC revolution of the 1980s, as personal computers transitioned from tools and playthings for geeks to everyday work instruments for the rest of us. In the last four decades, computer chips have become part of almost everything we use, from appliances to automobiles, and the companies that manufacture these chips have seen their fortunes rise, and sometimes be put at risk, as technology shifts.
1. From High Growth to Maturity!
It was the personal computer business in the 1980s that gave the semiconductor business, as we know it, its boost, and as technology has increasingly entered every aspect of life, the semiconductor business has grown. To map the growth, I started by looking at the aggregated revenues of all global semiconductor companies in the chart below from 1987 to 2023 (through the first quarter):
Source: Semiconductor Industry Association
From close to nothing at the start of the 1980s, revenues at semiconductor companies surged in the 1980s and 1990s, first boosted by the PC business and then by the dot-com boom. From 2001 to 2020, revenue growth at semiconductor businesses has dropped to single digits, as higher demand for chips in new uses has been offset by loss of pricing power, and declining chip prices. While revenue growth has picked up again in the last three years, the business has matured.
2. Sustained Profitability, with Cycles!
The semiconductor business has generally been a profitable one for much of its existence, as can be seen in the aggregate margins of companies in the business below:
While gross and operating margins have always been healthy, the pick up in both metrics since 2010 is a testimonial to the higher profitability in some segments of the chip business, even as competition commoditized other segments. As can be seen in the periodic dips in profitability across time, there are cycles of profitability that have continued, even as the business has matured.
It is worth noting that these margins are understated, because of the accounting treatment of R&D as an operating expense, instead of as a capital expenditure. The R&D adjusted operating margin at semiconductor companies is higher by about 2-4%, in every time period, with the adjustment to operating taking the form of adding back the R&D expense from the year and subtracting out the amortization of R&D expenses over the prior five years (using straight line amortization).
3. Love-Hate Relationship with Markets!
As the semiconductor business has acquired heft, in terms of revenues and profitability, investors have priced those operating results into the market capitalization assigned to these companies. In the graph below, I report the collective enterprise value and market capitalization of global semiconductor companies, stated in US dollar terms:
As you can see, the semiconductor companies have enjoyed long periods of glory, interspersed with periods of pain in markets, starting with a decade of surging market capitalizations in the 1990s, followed by a decade in the wilderness, with stagnant market capitalization, between 2000 and 2010, before another decade of growth, with market capitalizations surged six-fold between 2011 and 2020. Note that for the most part, semiconductor companies carry light debt loads, leading to enterprise values that either trail in market capitalization in some years (because cash exceeds debt) or are very close to market capitalization in other years (because net debt is close to zero).
As market capitalizations have risen and fallen, the multiple of revenues that semiconductor companies has also fluctuated, reaching a high in the dot-come era, with semiconductor companies trading collectively at more than seven times revenues to a long stretch where they traded at between two and three times revenues, before spiking again between 2019 and 2021. If prices are a reflection of what the market thinks about the future, the pricing of semiconductor companies seems to indicate an acceptance on the part of investors that the business has matured.
4. Shifting Cast of Winners and Losers!
As the semiconductor business has matured, it has also changed in terms of both the biggest players in the business, as well as the largest customers for its products . In the table below, we show the evolution of the top ten semiconductor companies, in terms of revenues, from 1990 through 2023, at ten-year intervals:
The cast of players has changed over time, with only two companies from the 1990 list (Intel and Texas Instruments) making it to the 2023 list. Over the decades, the Japanese companies on the list have slipped down or disappeared, to be replaced by Korean and Taiwanese firms, with Taiwan Semiconductors being the biggest mover, moving to the top of the list in 2022. After a long stretch at the top, Intel has dropped back down the list and ranked third, in terms of revenues, in 2022. Note that NVIDIA, the subject of this post, was eighth on the list in 2023, and has remained at that ranking from 2010. That may seem at odds with its rising market capitalization but it is indicative of the company's strategy of going after niche markets with high profitability, rather than trying to grow for the sake of growth.
The customers for semiconductor chips have also changed over time, with the shift away from personal computers to smartphones, with demand emerging from automobile, crypto and gaming companies in the last decade. Over the last few years, data processing has also emerged as demand driver, and it is safe the say that more and more of the global economy is driven by computer chips:
Semiconductor Industry Association
The forecasts for the future (2030), were for faster growth in automobile and industry electronics, but the potential surge in demand from AI products was largely underplayed, showing how quickly market forecasts can be subsumed by changes on the ground.
NVIDIA: The Opportunist!
NVIDIA was founded in 1993 by Jensen Huang, but it remained a niche player until the early parts of this century. Much of its rise has come in the last decade, just as revenues for the overall semiconductor business were starting to level off, and in this section, we will look through the company's history, looking for clues to its success and current standing.
1. Opportunistic Growth, with Profitability
NVIDIA went public in January 22, 1999, with the dot-com boom well under way, and its stock price popped by 64% on the offering date. At the time of its public offering, the company was money-making, but with small revenues of $160 million, making it a bit player in the business. As you can see in the graph below, those revenues grew between 2000 and 2005, to reach $2.4 billion in 2005. In the following decade (2006-2015), the annual revenue growth rate dropped back to 7-8% a year, but that growth allowed the company to make the top ten list of semiconductor companies by 2010. Well-timed bets on gaming and crypto created a surge in the revenue growth rate to 27.19% between 2016-2020, and that growth has continued into the last two years:
There are two impressive components to NVIDIA's history. The first is that it has been able to maintain impressive growth, even as the industry saw a slowing of revenue growth (3.97% between 2011-2020). The second is that this high revenue growth has been accompanied not just with profits, but with above-average profitability, as NVIDIA's gross and operating margins have run ahead of industry averages. NVIDIA has clearly embraced a strategy of investing ahead of, and going after, growth markets for the chip business, and that strategy has paid off well. Thus, its current dominant positioning in the AI chip business can be viewed as more evidence of that strategy at play.
There is one final component to NVIDIA's business model that needs noting, both from a profitability and risk perspective. NVIDIA 's core business is built around research and chip design, not chip manufacturing, and it outsources almost all of its chip production to TSMC. Its margins then come from its capacity to mark up the prices of these chips and it is exposed to the risks that any future China-Taiwan tensions can disrupt its supply chain.
2. Large, albeit Productive Reinvestment
While NVIDIA's growth and profitability have been impressive, the value cycle is not complete until you bring in the investment that the company has had to make to deliver that growth. With a semiconductor company, that reinvestment includes not only investing in manufacturing capacity, but also in the R&D to create the next generation of chips, in terms of power and capability. As with the sector, I capitalized R&D at NVIDIA, using a 5-year life, and recalculated my operating income (since the reported version is built on the accounting mis-reading of R&D as an operating expense). That results in a corrected version of pre-tax operating margin for NVIDIA that was 37.83% and a pre-tax return on capital of 24.42% in 2021-2023:
I also computed a sales to capital ratio, measuring the dollars of sales for each dollar of capital invested. In 2022, that number, for NVIDIA, was 0.65, indicating that this is definitely not a capital-light business and that NVIDIA has invested heavily to get to where it is today, as a company.
3. With a Mega Market Payoff
NVIDIA's success on the operating front has impressed financial markets, and its rise in market capitalization from its IPO days to a trillion-dollar value can be seen below:
I know that there are many who are regretting their lack of foresight, in not owning NVIDIA through its entire run, but recognize that this was not a smooth ride to the top. In fact, the company had near-death experiences, at least in market value term, in 2002 and 2008, losing more than 80% of its market value. That said, I owe my lucky run with NVIDIA to one of those downturns in 2018, when the company lost more than 50% of its market value, and it is a lesson that I hope will come through this chart. Even the biggest winners in the market have had periods when investors have turned intensely negative on their prospects, making them attractive as investments for value-focused investors.
AI: From Promise to Profits
Since much of the run-up in NVIDIA in the last few months has come from talk about AI, it is worth taking a detour and examining why AI has become such a powerful market driver, and perhaps looking at the past for guidance on how it will play out for investors and businesses.
Revolutionary or Incremental Change?
I am old enough to be both a believer and a skeptic on revolutionary changes in markets, having seen major disruptors play out both in my personal life and my portfolio, starting with personal computers in the 1980s, the dot-com/online revolution in the 1990s, followed by smartphones in the first decade of this century and social media in the last decade. What set these changes apart was that they not only affected wide swathes of businesses, some positively and some adversely, but that they also changed the ways that we live, work and interact. In parallel, we have also seen changes that are more incremental, and while significant in their capacity to create new businesses and disruption, don't quite qualify as revolutionary. I won't claim to have any special skills in being able to distinguish between the two (revolutionary versus incremental), but I have to keep trying, since failing to do so will result in my losing perspective and making investing mistakes. Thus, I was unable to share the belief that some seemed to have about the "Cloud" and "Metaverse" businesses being revolutionary, since I saw them more as more incremental than revolutionary change.
So, where does AI fall on this spectrum from revolutionary to incremental to minimalist change? A year ago, I would have put it in the incremental column, but ChatGPT has changed my perspective. That was not because ChatGPT was at the cutting edge of AI technology, which it is not, but because it made AI relatable to everyone. As I watched my wife, who teaches fifth grade, grapple with students using ChatGPT to do homework assignments. and with my own students asking ChatGPT questions about valuation that they would have asked me directly, the potential for AI to upend life and work is visible, though it is difficult to separate hype from reality.
Business Effects
If AI is revolutionary change and will be a key market driver for this decade, what does this mean for investors? Looking back at the revolutionary changes from the last four decades (PCs, dot-com/internet, smartphones and social media), there are some lessons that may have application to the AI business.
A Net Positive for Markets? Does revolutionary change help the overall economy and/or equity markets? The results from the last four decades is mixed. The PC-driven tech revolution of the 1980s coincided with a decade of high stock market returns, as did the dot-com boom in the next decade, but the first decade of this century was one of the worst in market history as stock prices flatlined. Stocks did well again over the last decade, with technology as the big winner, and over the four decades of change (1980-2022), the annual return on stocks has been marginally higher than in the five decades prior.
Given equity market volatility, four decades is a short time period, and the most that we can discern from this data is that the technological changes have been a net positive, for markets, albeit with added volatility for investors.
With a few Big Winners and Lots of Wannabes and Losers: It is indisputable that each of the revolutionary changes of the last four decades has created winners within the space, but a few caveats have also emerged. The first is that these changes have given rise to businesses where there are a few big winners, with a few companies dominating the space, and we have seen this paradigm play out with software, online commerce, smartphones and social media. The second is that the early leaders in these businesses have often fallen to the wayside and not become the big winners. Finally, each of these businesses, successful though they have been in the aggregate, have seen more than their share of false starts and failures along the way. For investors, the lesson has to be that investing in revolutionary change, ahead of others in the market, does not translate into high returns, if you back the wrong players in the race, or more importantly, miss the big winners. It is true that at this very early stage of the AI game, the market has anointed NVIDIA and Microsoft as big winners, but it is entirely possible that a decade from now, we will be looking at different winners. At the stage of the hype cycle, it is also true that almost every company is trying to wear the AI mantle, just as every company in the 1990s aspired to have a dot-com presence and many companies claimed to have "user-intensive" platforms in the last one, As investors, separating the wheat from the chaff will only get more difficult in the coming months and years, and it is part of the learning process. To the argument that you could buy a portfolio of companies that will benefit from AI and make money from the few that succeed, past market experience suggests that this portfolio is more likely to be over than under priced.
With Disruption: The market is littered with the carcasses of what used to be successful businesses that have been disrupted by technological change. Investors in these disrupted companies not only lose money, as they get disrupted, but worse, invest even more in them, drawn by their "cheapness". This happened, just to provide two examples, with investors in the brick-and-mortar retail companies that were devastated by online retail, and with investors in the newspaper/traditional ad companies that were upended by online advertising. If AI succeeds in its promise, will there be businesses that are upended and disrupted? Of course, but we are in the hype phase, where much more will be promised than can be delivered, but the biggest targets will come into focus sooner rather than later.
The bottom line is that even if we all agree that AI will change the way businesses and individuals behave in future years, there is no low-risk path for investors to monetize this belief.
Value Effects
If history is any guide, we are in the hype phase of AI, where it is oversold as the solution to just about every problem known to man, and used to justify large price premiums for the companies in its orbit, without any attempt to quantify and back up these premiums. The primary argument that will be used by those selling these AI premiums is that there is too much uncertainty about how AI will affect numbers in the future, an argument that is at odds with paying numbers up front for those expectations. In short, if you are paying a high price for an AI effect in a company, it behooves you to put aside your aversion to making estimates, and use your judgment (and data) to arrive at the effect of AI on cashflows, growth and risk, and by extension, on value.
In making these estimates, it does make sense to break down AI companies based upon what part of the AI ecosystem they inhabit, and I would suggest the following breakdown:
Hardware and Infrastructure: Every major change over the last few decades has brought with it requirements in terms of hardware and infrastructure, and AI is no exception. As you will see in the next section, the AI effect on NVIDIA comes from the increased demand for AI-optimized computer chips, and as that market is expected to grow exponentially, the companies that can grab a large share of this market will benefit. There are undoubtedly other investments in infrastructure that will be needed to make the AI promise a reality, and the companies that are on a pathway to delivering this infrastructure will gain, as a consequence.
Software: AI hardware, by itself, has little value unless it is twinned with software that can take advantage of that computing power. This software can take multiple forms, from AI platforms, chatbots, deep learning algorithms (including image and voice recognition, as well as natural language processing) and machine learning, and while there is less form and more uncertainty to this part of the AI business, it potentially has much greater upside than hardware, precisely for the same reason.
Data: Since AI requires immense amounts of data, there will be businesses that will gain value from collecting and processing data specifically for AI applications. Big data, used more as a buzzword than a business proposition, over the last decade may finally find its place in the value chain, when twinned with AI, but that pathway will not be linear or predictable.
Applications: For companies that are more consumers of AI than its purveyors, the promise of AI is that it will change the way they do business, with positive and negative implications. The biggest pluses of AI, at least as presented by its promoters, is that it will allow companies to reduce costs (primarily by replacing manual labor with AI-driven applications) and make them more efficient, and by extension, more profitable. Even if I concede the first claim (though I think that the AI replacements will be neither as efficient nor as cost-saving as promised), I am even more wary of the second claim for a simple reason. If every company has AI, and AI reduces costs and increases efficiency as promised for all of them, it is far more likely that they will end up with lower prices for their products/services and not higher profits. At the risk of repeating one of my favorite sayings, "If everyone has it, no one does" and it is the basis for my argument that AI, if it succeeds, will make companies less profitable, in the aggregate. The other minus of AI is that if it delivers on even a portion of its promise of automating aspects of business, it will be damaging and perhaps even devastating for existing companies that derive their value currently from delivering these services for lucrative fees. In these businesses, AI will not just be a zero-sum game, but a negative-sum one.
On the specific questions of how AI will affect investing, in general, and active investing, in specific, I believe that if it is used as a tool, it can enrich valuation and investing, and I look forward to being able to develop valuation narratives and numbers, with its aid. For those who are active investors, individuals as well as institutions, I believe that AI will make a difficult game (delivering excess returns or alpha from investing) even more so. Any edge you have as an active investor will be more quickly replicated in an AI world, and to the extent that AI tools will be accessible and available to every investor, by itself, AI will not be a sustainable edge for any active investor.
Social Effects
Will AI make our lives easier or more difficult? More generally, will it make the world a better or worse place to inhabit? I know that there are some advocates of AI who paint a picture of goodness, where AI takes over the menial tasks that presumably cause us boredom and brings an unbiased eye to data analysis that lead to better decisions. I know that there are others who see AI as an instrument that big companies will use to control minds and acquire power. With the experience of the big changes that have engulfed us in the last few decades still fresh, I would argue that they are both right. AI will be a plus is some occupations and aspects of our lives, just as it will create unintended and adverse consequences in others.
There are some who believe that AI can be held in check and made to serve its more noble impulses, by restricting or regulating its development, but I am not as optimistic for many reasons. First, I believe that both regulators and legislators are woefully incapable of understanding the mechanics of AI, let alone pass sensible restrictions on its usage, and even if they do, their motives are not altruistic. Second, any regulation or law that is aimed at preventing AI's excesses will almost certainly set in motion unintended consequences, that at least in some cases will be worse than the problems that the regulation/law was supposed to hold in check. Third, having seen how badly regulators and legislators have handled the consequences of the social media explosion, I am skeptical that they will even know where to start with AI. While this is a pessimistic take, I believe that it a realistic one, and that just as with social media, it will be up to us, as consumers of AI products and services, to try to draw lines and separate good from bad. We may not succeed, but what choice do we have, but to try?
The AI Chip Story
The AI story has particular resonance with NVIDIA because unlike most other companies, where it is mostly hand-waving about potential, it has substance in place already and a market that is its target. In particular, NVIDIA has spent much of the last few years investing and developing products for a nascent AI market. This lead time has given NVIDIA not just market leadership, but revenues and profits already. Much of the excited reaction to NVIDIA's most recent earnings report came from the company reporting a surge in its data center revenues, with much of the increase coming from AI chips. While the company does not explicitly break out how much of the data center revenues are from AI chips, it is estimated that the total market for those chips in 2022 was about $15 billion, with NVIDIA holding a dominant market share of about 80%. If those estimates are right, the bulk of the data center revenues for NVIDIA in 2022, which amounted to $15 billion in all, comes from AI-optimized chips.
The ChatGPT jolt to market expectations has played out in increases in expected growth of the AI chip market over the next decade, with estimates for the overall AI chip market in 2030 ranging from $200 billion at the low end to close to $300 billion at the high end. While there is a huge amount of uncertainty about this estimate, there are two assertions that can be made about NVIDIA's presence in this business. The first is that this will be the growth engine for NVIDIA's revenues over the next decade, even as their gaming and other chip revenue growth levels off. The second is that NVIDIA has a lead over its competition, and while AMD, Intel and TSMC will all allocate resources to building their AI businesses, NVIDIA's dominance will not crack easily.
NVIDIA: Valuation and Decision Time
As you look at NVIDIA's growth and success in the last decade, and its recent ascent into the rarefied air of "trillion dollar market cap" companies, there are two impulses that come into play. One is to extrapolate the past and assume that assume that the company will continue to not just succeed in the future, but do so in a way that beats the market's expectations for it. The other is to argue that the outsized success of the past has raised investors expectations so much that it will be difficult for the company to meet them. In my story, I will draw on both impulses, and try to thread the needle on the company.
Story and Valuation
The driver of NVIDIA's success has been its high-performance GPU cards, but it is very likely that the businesses that bought these cards and drove NVIDIA's success in the last decade will be different from the businesses that will make it successful in the next one. For much of the last decade, it was gaming and crypto users that allowed the company to set itself apart from the competition, but the bad news is that both of these markets are maturing, with lower expected growth in the future. The good news, for NVIDIA, is that it has two other businesses that are ready to step in and contribute to growth. The first is AI, where NVIDIA commands a hefty market share of what is now a relatively small market, but one that is almost certain to grow ten-fold or greater over the decade. The other is in the automobiles business, where more powerful computing is seen as the ingredient needed to open up automated driving and other enhancements. NVIDIA is only a small player in this space, and while it does not enjoy the dominance that it does in AI, a growing market will allow NVIDIA to acquire a significant market share.
I will start with a familiar construct (at least to those who follow my valuations), and break down the inputs that drive value as a precursor to introducing my NVIDIA story:
Put simply, the value of a company is a function of four broad inputs - revenue growth, as a stand-in for its growth potential, a target operating margin as a proxy for profitability, a reinvestment scalar (I use sales to invested capital) as a measure of the efficiency with which it delivers growth and a cost of capital & failure rate to incorporate risk.
While all of NVIDIA's different businesses (AI, Auto, Gaming) share some common features in terms of gross and operating margins, and requiring R&D for innovation, the businesses are diverging in terms of revenue growth potential.
Revenue Growth: NVIDIA will remain a high growth company for two reasons. The first is that in spite of its scaling up due to growth over the last decade, at least in terms of revenues, it has a modest market share of the overall semiconductor market, with revenues that are less than half of the revenues posted by Intel or TSMC. The second, and more important reason, is that while its gaming revenue growth is starting to flag, it is well-positioned in AI and Auto, two markets poised for rapid growth. In my story, I will assume that these markets will deliver on their growth promise and that NVIDIA will maintain a dominant, albeit lower, market share of the AI chip business, while gaining a significant share (15%) of the Auto chip business:
Clearly, there is room for disagreement on both total market and market share for the AI and Auto businesses, and I will return to address the effects. I am still allowing the gaming and other business revenues to grow at 15% a year, a healthy number that reflects other businesses (like the omniverse) contributing to the top line.
Profitability: The semiconductor business has a cost structure that has relatively little flex to it, but I will assume in my NVIDIA story that the right margin to focus on is the R&D adjusted version, and that NVIDIA will bounce back quickly from its 2022 margin setback to deliver higher margins than its peer group. While my target R&D adjusted margin of 40% may look high, it is worth remembering that the company delivered 42.5% as margin in 2020 and 38.4% as margin in 2021. As noted earlier, NVIDIA's dependence on TSMC for the production of the chips it sells implies that any increases in margins have to come more from price increases than cost efficiencies.
Investment Efficiency: NVIDIA has invested heavily in the last decade, generating only 65 cents in revenues for every dollar of capital invested (including the investment in R&D), in 2022. That investment has clearly been productive, as the company has been able to find growth and generate excess returns. I believe that given the company's larger scale, with the payoff from past investments augmenting revenues, the company's sales to invested capital will approach the global industry median, which is $1.15 in revenues for every dollar of capital invested.
Risk: As we noted in the section on the semiconductor business, this remains, even for its most successful proponents, a cyclical business, and that cyclicality contributes to keeping the cost of capital higher than for the median company. I estimated NVIDIA's cost of capital based upon its geographic exposure and very low debt ratio to be 13.13%, but chose to use the industry average for US semiconductor companies, which was 12.21%, as the cost of capital in the initial growth period. Over time, I will assume that this cost of capital will drift down towards the overall market average cost of capital of 8.85%.
With this story in place, and the resulting input numbers, the value that I get for NVIDIA is shown below:
Based on story, the value per share that I arrive at for NVIDIA on June 10, 2023, is about $240, well below the stock price of $409 that the stock traded at on June 10, 2023. (The stock has risen since then to $434 a share on June 20, 2023.)
Simulation and Breakeven Analysis
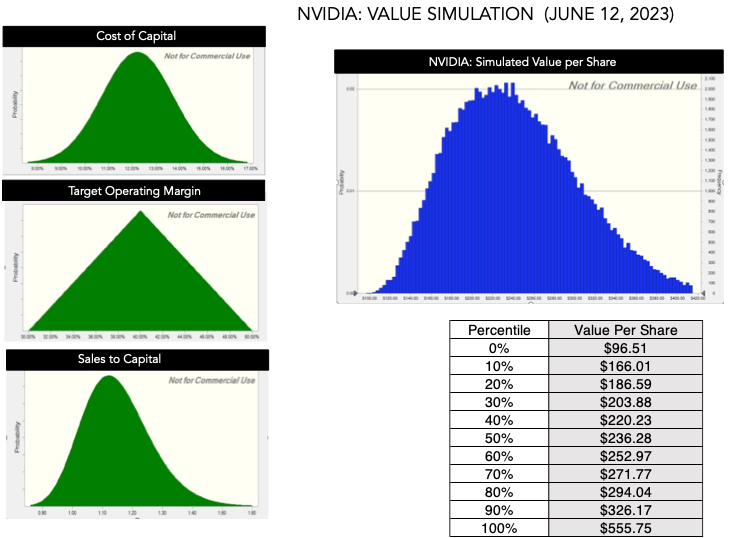
At the risk of stating the obvious, I am making assumptions about market growth and market share that you may or even should take issue with. In the interests of examining how value varies as a function of the assumptions, I fell back on an approach that I find helps me deal with estimation uncertainty, which is a simulation. I built the simulation around the key inputs, including:
Revenues: In my base case valuation, incorporating high growth in the AI and Auto Chip businesses, and giving NVIDIA a dominant share of the first and a significant share of the second resulted in revenues of $267 billion in 2033. However, this is built on assumptions about the future for both markets that can be wrong, in either direction, and that uncertainty is incorporated into the simulation as distributions for each of the three segments of NVIDIA's revenues:
As these distributions play out, there are simulations where NVIDIA's revenues exceed $600 billion and some where it is less than $100 billion, in 2033.
Operating Margin: In my base case story, I increase NVIDIA's R&D adjusted margin to 35% next year, and target an operating margin of 40% in 2027, that it maintains in perpetuity after that. While I provide my justifications for those assumptions, it is entirely possible that I am being too optimistic, in raising margins that are already above industry-average levels to even higher values, or that I am being pessimistic, and not factoring in NVIDIA's higher pricing power in the AI and Auto businesses. I capture that uncertainty in my (triangular) distribution for the target operating margin in 2027 (and beyond), where I set the upper end of the range at 50%, which would be a significant premium over NVIDIA's own past margins, and the lower end at 30%, which would put them closer to their peer group.
Reinvestment: The input that drives reinvestment is the sales to capital ratio, and while I set NVIDIA's sales to capital ratio at 1.15, the semiconductor industry average, it is possible that the company may continue to reinvest at closer to its historic average of 0.65 (leading to more reinvestment). Alternatively, it is also conceivable that the company's investments over the last decade, especially in its AI chips, will put it on a glide path to reinvesting a lot less in the next decade (a sales to capital ratio closer to 1.94, the 75th percentile of the semiconductor business.
Risk: Ruling out failure risk, and focusing on the cost of capital, I center my estimates on 12.21%, the industry average that I used in the base case, but allow for the possibility that a growing AI business may reduce the cyclicality of revenues, lowering the cost of capital towards the market-average of 8.85%) or conversely, increase uncertainty and uncertainty, raising the cost of capital towards 15%, the 90th percentile of global companies):
With these estimates in place, the simulated value per share is shown below:
To the question of whether NVIDIA could be worth $400 a share or more, the answer is yes, but the odds, at least based on my estimates, are low. In fact, the current stock price is pushing towards the 95th percentile of my value distribution.
An alternative look at what has to happen for NVIDIA's intrinsic value to exceed $400, I looked at the two key variables that determine its value: revenues in year 10 and operating margins:
This table reinforces the findings in the simulation, insofar as it shows that there are plausible paths that lead to the current price being a fair value or under value, but these paths require a daunting combination of extraordinary revenue growth and super-normal margins. In my view, a target margin of 50% is pushing the limits of possibility, in the semiconductor business, and if NVIDIA finds a way to deliver value that justifies current pricing, it has to be through explosive revenue growth. Put simply, you need another market or two, with potential similar to the AI market, where NVIDIA can wield a dominant market share to justify its pricing.
Judgment Day
As I noted at the start of this post, I have a selfish reason for valuing NVIDIA, which is that I own it shares and I am exposed to its price movements, and much more so now than I was when I bought the stock in 2018, as a result of its inflated pricing. I have also been open about the fact that my investment philosophy is built around value, buying when price is less than value and by the same token, selling when price is much higher than value.
NVIDIA as an Investment
I love NVIDIA as a company, and have nothing but praise for Jensen Huang's leadership of the company. Operating in a business where revenue growth was becoming scarce (single digit revenue growth) and segments of the product market are commoditized (lowering margins), NVIDIA found a pathway to not just deliver growth, but growth with superior profit margins and excess returns. While some may argue that NVIDIA was lucky to catch a growth spurt in the gaming and crypto businesses, a closer look at its successes suggests that it was not luck, but foresight, that put the company in a position to succeed. In fact, as the AI and Auto businesses look poised to grow, NVIDIA's positioning in both indicates that this is a company that is built to be opportunistic. My valuation story for NVIDIA reflects all of these positive features, and assumes that they will continue into the next decade, but that upbeat narrative still yields a value well below the current price.
I would be lying if I said that selling one of my biggest winners is easy, especially since there is a plausible pathway, albeit a low-probability one, that the company will be able to deliver solid returns, at current prices. I chose a path that splits the difference, selling half of my holdings and cashing in on my profits, and holding on to the other half, more for the optionality (that the company will find other new markets to enter in the next decade). The value purists can argue, with justification, that I am acting inconsistently, given my value philosophy, but I am pragmatist, not a purist, and this works for me. It does open up an interesting question of whether you should continue to hold a stock in your portfolio that you would not buy at today's stock prices, and it is one that I will return to in a future post.
NVIDIA as a Trade
I have written many posts about the divide between investing and trading, arguing that the two are philosophically different. In investing, you assess the value of a stock, compare that value to the price, act on that difference (buying when price is less than value and selling when it is greater) and hope to make money as the gap between value and price closes. In trading, you buy at a low price, hoping to sell at a higher price, but you are agnostic about what causes the price to move and whether that movement is rational or not.
Bringing this difference to play in NVIDIA, you can see why, no matter what you think about NVIDIA's value, you may continue to trade it. Thus, even if you believe that NVIDIA's value is well below its price, you may buy NVIDIA on the expectation that the stock will continue to rise, borne upwards by momentum or incremental information. Given the strength of momentum as a market-driver, you may very well generate high returns over the next weeks, months or even years, and you should not let "value scolds" get in the way of your enjoyment of your winnings. My only pushback would be against those who argue that momentum can carry a stock forward forever, since it is the gift that both gives and takes away. The strength of momentum in the rise in NVIDIA's stock price will be played out in the the opposite direction, when (not if) momentum shifts, and if you are trading NVIDIA, you should be working on indicators that give you early warning of those shifts, not worrying about value.
The Bottom Line
As we hear the relentless pitches for AI, and how it will change our live and affect our investments, there are lessons, to draw on, from the other big changes that we have seen over our lifetime. The first is that even if you buy into the argument that AI will change the ways that we work and play, it does not necessarily follow that investing in AI-related companies will yield returns. In other words, you can get the macro story right, but you need to also consider how that story plays out across companies to be able to generate returns. The second, is that refusing to make estimates or judgments about how AI will affect the fundamentals (cash flows, growth and risk) in a business, just because you face significant uncertainty, will not make that uncertainty go away. Instead, it will create a vacuum that will be filled by arbitrary AI premiums and make us more exposed to scams and wannabes. The third is that, as a society, it is unclear whether adding AI to the mix will make us better or worse off, since every big technological change seems to bring with it unintended consequences. To end, I was considering asking ChatGPT to write this post for me, using my own language and history, and I am open to the possibility that it could do a better job than I have. Stay tuned!


 The mechanism that allows for the discount rate adjustment to reflect currency is the risk free rate, with currencies with higher expected inflation carrying higher risk free rates. In a downloadable dataset linked at the end of this post, I estimate riskfree rates in global currencies, based upon the US T.Bond rate as the riskfree rate in US dollars) and differential inflation. To provide an example, using the IMF's estimate of expected inflation for 2023-28 of 3% for the US and 13.50% for Egypt, and building on the US treasury bond rate of 3.80%. the riskfree rate in Egyptian pounds is 14.38%.Riskfree Rate in EGP = (1+ US T.Bond Rate) (1 + Exp Infl in Egypt) (1+ Exp Infl in US) -1