When I started these updates on February 26, 2020, about two weeks after the markets went into free fall, my first six posts were titled "Viral Market Meltdowns", reflecting the sell off across the globe. About half way through this series, I changed the title, replacing the word "meltdown" with "update", as markets turned around. In fact, by August 14, the date of this update, US equities had recouped all of their crisis losses, and were trading higher than they were on February 14, the start of the crisis. In that six-month period, though, there has been a reallocation of value, from old to young, value to growth and manufacturing to technology companies, and I have tried to both chronicle and explain these shifts in earlier posts. In this one, I plan to focus on a subset of these companies, the FANG (Facebook, Amazon, Netflix and Google) stocks, younger companies that have soared in value over the last decade, and two other tech companies of longer standing, Apple and Microsoft. These FANGAM stocks, which have dominated the market for the last decade, have become even more dominant during the crisis, and explaining (or trying to explain) that phenomenon is key to understanding both the market comeback and to assessing whether it is sustainable.
Market Outlook
My crisis clock started on February 14, 2020, and it is now six months since its start, and as with my previous updates, I will begin with a quick overview of financial market action over this period. I start by looking at selected equity indices, spread geographically, and how they have performed over the period:
 |
| Download data |
On August 14, the S&P 500 was almost back to where it was on February 14, which was an all-time high, and the NASDAQ was 13.46% higher than its February-levels, hitting new highs. In local currency terms, the Latin American indices were still showing double-digit declines, as of August 14, but the Asian indices have recouped much of their early losses. As equities have gone on a roller-coaster ride, US treasuries have settled into a holding pattern, with rates across maturities at much lower levels than prior to it:
 |
| Download data |
 |
| Download data |
Corporate bond spreads, which surged in the first five weeks of the crisis, have dropped back almost to pre-crisis levels for the highest rated bonds. For the lowest rated bonds, spreads have followed the same pattern, but they remain at elevated levels, relative to pre-crisis values. The ebbs and flows in equity and bond markets have also played out in commodities, where I track oil and copper on a daily basis in the graph below:
 |
| Download data |
Copper, after dropping 15.36% between February 14 and March 20, has more than recovered its losses and was trading 10.57% higher on August 14, than on February 14. Oil had a much steeper fall in the early weeks, down more than 50% in the first five weeks of the crisis, and while it too has recovered, it was trading about 20% below where it was on February 14. Finally, I look at gold and bitcoin during the crisis period:
 |
| Download data |
Comparing Bitcoin to gold, the cumulative return over the six-month period is not dissimilar, with gold up about 23% from its February 14 level, while Bitcoin is up 14%, but the performance over the six month period is telling. Gold has held its value through the crisis, reinforcing its crisis investment status, but bitcoin has been on a wild ride, falling about 40% in the first five weeks, when stocks were down, and rallying almost 89% in the weeks since, as stocks have risen, behaving more like very risky equity than a crisis investment.
Equities Breakdown
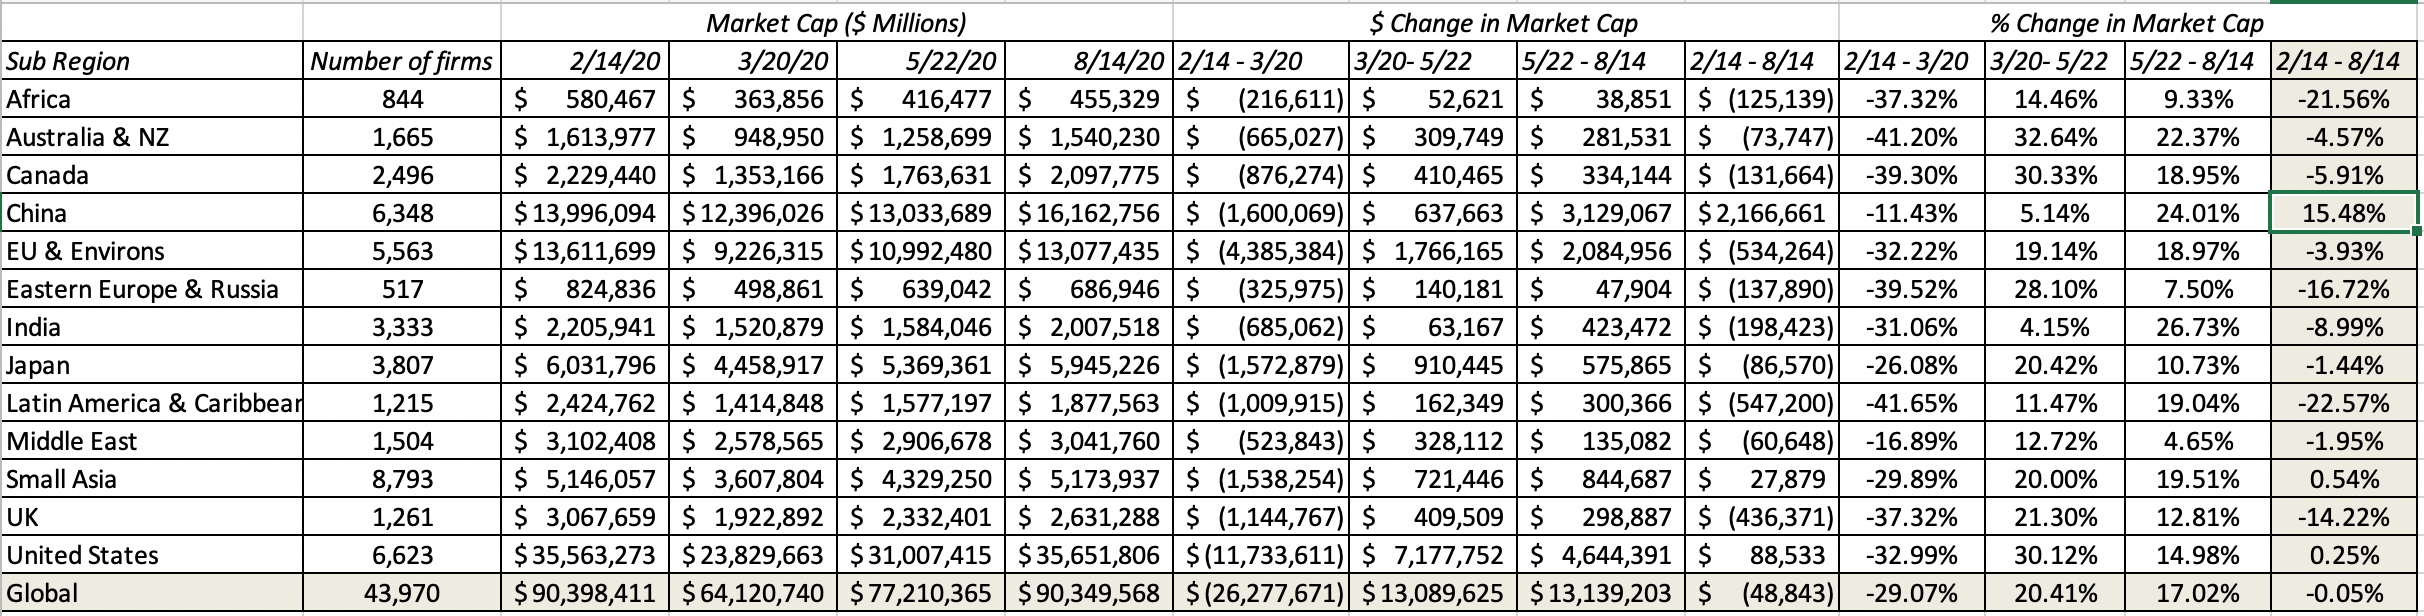
While looking at equity indices can provide a big-picture perspective on how stocks are doing, looking at individual companies can yield much richer insights. As in prior weeks, I updated my company-level data on market capitalizations to include the four weeks since my last update, and I report the changes in market capitalization, by region, in the table below:
 |
| Download data |
All of these returns are computed in US dollar terms, for comparability, and they are based upon the aggregate market capitalization of all companies traded in each of these markets. As you can see, a subset of emerging markets (Africa, Eastern Europe, Latin America), are showing the most damage, with weakening local currencies exacerbating market damage. Collectively, global equities on August 14 are back to where they were on February 14, reflecting the comeback story that the indices were telling. Breaking down global stocks by sector, here is what I see:
 |
| Download data |
Of the eleven sectors that S&P uses to classify stocks, six now have positive returns over the crisis period, and technology has now overtaken health care as the best performing sector. The worst performing sectors are energy, real estate and utilities, all businesses that are capital intensive and debt laden, and default worries about that debt burden may explain why financials remain the worst performing sector. Breaking sectors down into finer detail in industry groups, I list the ten worst performing and best performing industries, over the six-month period:
 |
| Download data |
The message in this table reinforces what you saw in the sector returns, with infrastructure, commodity and financial service industries making up the bulk of the loser list, and technology, health care and retail dominating the winner list.
The FANGAM Phenomenon
In my earlier posts, I argued that the market effects of this crisis have been disparate, with capital-intensive, debt-laden and rigid firms being worse affected than firms that are capital-light and flexible. You see this play out in the returns you see across sectors, industries and regions. In fact, with returns updated through August 14, 2020, technology companies are now showing healthy gains from where they were at the start of this crisis, up 11.82% since February 14, 2020. There is an inside story to this success, and it revolves around six companies - the original FANG stocks and Apple and Microsoft. They have been responsible not just for the bulk of the returns among technology companies, but have also provided the thrust for the overall market's recovery.
FANGAM - Tale of the Tape
To understand the FANGAM story, let's retrace our steps to when there were only four young companies in this group, Facebook, Amazon, Netflix and Google (FANG) and look at how two of their senior counterparts, Apple and Microsoft, entered this group. In the table below, I list out the founding date for each of these companies, together with the date of their public offerings, the market capitalization at the time of the offering and the years in which each company hit market cap milestones ($100 billion, $500 billion and $1 trillion):

Looking at the six companies, they vary in age, with Microsoft being the oldest and Facebook the youngest, but they have also had extraordinary revenue growth in the last two decades, albeit from different bases. Coming into 2020, Apple, Amazon and Microsoft had already hit trillion-dollar market caps, and they were joined by Alphabet in 2020, and Apple crossed the $2 trillion threshold just two days prior to this post. I find the construct of a corporate life cycle useful in explaining the evolution of companies over time, in both corporate finance and valuations.

For most companies, aging is accompanied by three phenomena. The first is that revenue growth decreases as companies scale up, with the speed of deceleration in growth a function of competition in the business. The second is that profit margins, which are negative or very low when companies are young, improve as companies grow, with the magnitude of improvement depending upon the economies of scale in the business, but plateau as new competitors emerge. The third is that even the very best companies reach mature growth, where they remain profitable, but struggle to grow and create value at the same time. The FANGAM stocks stand out from the rest of the market, since they have, at least so far, found the antidote to aging, continuing to grow even as they get larger, while sustaining or even improving profit margins. Breaking down how each of these companies deviate from the norm, here is what I conclude:
- Amazon, the Original: In an era, where every company claims to be the "next Amazon", it is worth remembering that the original company's rise to global dominance came with hiccups and interruptions. After its stint as the poster child for the dot com boom, Amazon's online retail business flirted with failure in 2001, but survived and prospered in the next decade. By the end of the decade, though, it seemed like Amazon's story had run its course, but just as investors were readying for the company becoming a mature retailer, the company reinvented itself as a disruption platform, ready to go after any business it chose to, with an army (Amazon Prime) backing it up.
- Apple and Microsoft, the Reincarnation Duo: By tech company standards, Apple and Microsoft are old companies that should be struggling to hold on to their customers and fighting off competition. Both companies though seem to have found a way to move the clock back, and retain their status as growth companies. Apple, given up for dead in the late 1990s, found its answer in streamed music, smartphones and tablets in the following decade. Office and Windows were the cash cows that kept Microsoft going for much of its corporate life, but after seeing growth flatline in the software business, the company found new growth in a subscription model (Office 365) and the cloud business.
- Alphabet and Facebook, the Advertising Juggernauts: Google and Facebook have had almost uninterrupted growth, since their founding, as they have not only taken advantage of the shift to online advertising, but also dominated that shift, while also delivering profit margins in the stratosphere. Along the way, they have accumulated huge user bases, giving them the power to influence not only where people shop, but also what they think, and perhaps even how they vote.
- Netflix, the Shape Shifter: Of the six stocks, the one that has had to make the most mid-course corrections, changing its business model to reflect a changing world, is Netflix. It started life as a video rental service, mailing DVDs to its customers, and undercutting Blockbuster, the dominant player in the business then. It pivoted quickly to become the leading streaming player, renting its content from movie and TV producers, and offering them to subscribers. As content producers squeezed the company, it shifted its business model again to make its own shows and movies, becoming the largest spender on content in the business. Along the way, it has gone global, and its business machine not only has a huge base of subscribers, but finds ways to keep adding to that base.
Every investing generation has its share of legendary companies, but I do not believe that there has been another grouping of companies that has dominated the market as completely as these six have done over the recent past.
A Decade of Domination
To understand how the FANGAM stocks made the last decade their own, you need to go back to the start of 2010, and see how the market viewed each one then:
- The Lagging Giant: At the start of 2010, Microsoft had a market capitalization in excess of $270 billion, and was second only to Exxon Mobil, with a market cap of $320 billion, among US companies, but that represented a come down from its status as the largest market cap company at the start of 2000, with a market cap exceeding $500 billion.
- The Rising Star: At the start of 2010, Apple's market cap was approaching $200 billion, making it the fifth largest US company in terms of market cap, but that was a quantum leap from its market cap of $16 billion, ten years earlier.
- The Field of Dreams Company: By early 2010, Amazon had cemented its status as online retailer, capable of growing its revenues at the expense of its brick and mortar competitors, but without a clear pathway to profitability. The market seemed to be willing to overlook this limitation, giving the company a market cap of more than $50 billion, a significant comeback from the dot-com bust days of 2001, when it was valued at less than $4 billion.
- The New Tech Prototype: In January 2010, Google was already the prototype for the new tech company model, having reached a hundred-billion dollar market cap threshold faster (a little more than a year after going public) than any other company in history, and with its market capitalization of more than $160 billion in early 2010, the company was already on the top ten list among US companies.
- On the cusp: In early 2010, it is unlikely that anyone would have put Netflix on the list of big-time winners, since its market capitalization was less than $4 billion and its business model of renting content and signing up subscribers was seen as successful, but not scalable.
- The glimmer in the market's eye: At the start of 2010, Facebook was still a private business, though venture capitalists were clearly excited about its prospects, pricing it at roughly $14 billion in January 2010, based primarily on its user numbers.
 |
| Download data |
It is true that US equities did well over the decade, but the FANGAM stocks rose much more, rising from 6.5% of the overall market capitalization of all US equities, in January 2010, to close to 15% in January 2020. To provide perspective on how much the FANGAM stocks contributed to the overall equity market's rise, I compute the change in market capitalization each year at the FANGAM stocks and all other US equities, each year from 2010 to 2019:
 |
| Download data |
The $4.35 trillion in market cap added by the FANGAM stocks accounted for 19% of the overall increase in equity value across all US equities (>7000 stocks).
The COVID Rally
At the start of 2020, there was no denying the dominance of the FANGAM stocks in US equity markets, but there was a debate about whether they were over priced, at least collectively. For many old-time value investors, the FANGAM stocks had became a symbol of growth and momentum run amok, though a legendary member of this group (Warren Buffet) had invested in one of the companies (Apple). Between January 1, 2020 and February 14, 2020, the FANGAM stocks continued to rise more than the rest of the market and they collectively accounted for 16.08% of the market cap of all US equities on February 14, up from the 14.94% at the start of the year. When the crisis hit, there were some value investors who felt that the market correction would be felt disproportionately by this group, given their run-up in the years before. In the graph below, I look at the market capitalization of the FANGAM stocks and the rest of US equities, on a week-to-week basis from February 14, 2020 to August 14, 2020:
 |
| Download data |
From Strength to Strength
We may lump the FANGAM stocks as a group, but these are different companies in different businesses. In fact, lumping them together as technology companies misses the fact that Netflix is closer to Disney in its business than it is to Microsoft's software offerings, and Google and Facebook are advertising companies built on very different technology platforms. There are three elements that they do share in common:
- Cash Machines: Each of these companies has a business or segment that is a cash machine, generating large profits and huge amounts of cash for the company. With Apple, it is the iPhone business that allows it to generate tens of billions in cash flows each year, and with Microsoft, it is a combination of its legacy products (Office & Windows) and cloud services that plays this role. With Facebook and Google, their core online advertising businesses not only generate sky high margins, but require very little capital investment to grow. Amazon, until a few years ago, had no segment of equivalent profitability, but AWS (Amazon’s cloud business) is now delivering those cash flows. Netflix remains the weakest of the six companies on this dimension, but even it can count on the subscription revenues from its "sticky" subscriber base for its cash needs.
- Platform of users/subscribers: The FANGAM stocks also share user bases that are immense, with Facebook leading that numbers game with close to 2.7 billion users, many of whom spend large portions of each day in its ecosystem. Microsoft, Google and Apple all also have more than a billion users apiece, with multiple ways to entangle them. Amazon and Netflix may not be able to match the other four companies on sheer numbers, but each has hundreds of millions of users.
- Proprietary and Actionable Data: I know that big data is the buzzword of business today, and in the hands of most companies, that big data is of little use, since it is neither exclusive to them, nor the basis for action. What sets the FANMAG companies apart is that they use big data to create value, partly because the data that they collect is proprietary (Facebook from your posts, Amazon/Alexa from your shopping/interactions, Netflix from your watching habits, Google from your search history and Apple from your device usage). Even Microsoft, a late entrant into big data, has stepped up its game. On top of the data is actionable, since these companies clearly use the data to advance their business models,
Value and Pricing
I know that this has been a long lead in, but interesting though it might be to explain why the FANMAG stocks are where they are, the question of the moment in investing is whether you should buy, sell or just watch these stocks. Having valued all these stocks in the past, and acted on those valuations, with mixed results, I will draw on my past history with each company, to craft my stories and valuations of the companies.
 |
| Download valuations: Facebook, Amazon, Netflix, Google, Apple and Microsoft Simulation results: Facebook, Amazon, Netflix, Google, Apple and Microsoft |
With each company, I report an estimated median (or most likely) value, as well as the range (1st decile, 1st Quartile, 3rd Quartile and ninth decile) of values that I estimated from running simulations. Given how much these stocks have gone up over the last six months, it should come as no surprise that I find only one (Facebook) to be under valued. Among the remaining, Apple looks the most overvalued (>30%), to me, followed by Amazon and Microsoft (10%-20%) and Netflix and Alphabet (<10%). I have also computed the internal rates of return for these stock, based upon the current market capitalization, and my estimates of expected cash flows. I would expect to earn an IRR of 7.16% on Facebook, for instance, if I bought at its current market capitalization, and it generates the cash flows I expect it to. That may not sound like much to you, but in a world of low interest rates and equity risk premiums, it is high enough for the stock to be undervalued. Even Apple, the most overvalued stock in this group can be expected to generate a 5.30% IRR, at its current market capitalization, lower than what I would need it to make, given its risk, but not bad given the alternatives. That said, I expect you to disagree with me, perhaps even strongly, on my stories and assumptions, which is one reason the spreadsheets are yours to download and change to reflect your views.
In Closing
In the interests of full disclosure, at the time that I started on this post, I owned three of these six stocks, Apple, Facebook and Microsoft, with each having spent significant time in my portfolio; my posts detailing their acquisitions are here, here and here. As you look back at the valuations that I used to justify those investments, they seem laughably low, and I will not claim any semblance of clairvoyance. In fact, I bought Microsoft in 2013, even though I perceived it to be an aging company with little left in the tank in 2013, Apple in 2016, notwithstanding my expectations of low growth in the future, and Facebook in 2018, in the aftermath of the Cambridge Analytica scandal, because I found the companies cheap, even with my stilted narratives.
I did sell my Apple holdings today (August 19, 2020) as the company crested the $2 trillion mark, will continue to hold Microsoft, even though I believe that it is moderately overvalued, and Facebook, hoping for more upside. In case you are tempted to follow my lead, let me hasten to add that I also sold my Tesla holdings in January 2020 at $640, and the stock is now trading at close to $2000. Google and Netflix will remain on my watch list, and I plan to add either stock, on weakness. I will not tempt fate, and sell short on Amazon, partly because I have seen what the market does to Amazon short sellers and partly because I struggle to think of a catalyst that will cause the price to adjust. If history is any guide, these companies, unstoppable though they seem now, will hand the baton, for carrying the market forward in this decade, to other companies.
YouTube Video
<
Data
- Market data (August 14, 2020)
- Regional breakdown - Market Changes and Pricing (August 14, 2020)
- Sector breakdown - Market Changes and Pricing (August 14 2020)
- Industry breakdown - Market Changes and Pricing (August 14, 2020)
FANMAG: Valuations and Simulation Results
- Facebook: Valuation and Simulation Results
- Amazon: Valuation and Simulation Results
- Netflix: Valuation and Simulation Results
- Google/Alphabet: Valuation and Simulation Results
- Apple: Valuation and Simulation Results
- Microsoft: Valuation and Simulation Results
- A Viral Market Meltdown: Fear or Fundamentals?
- A Viral Market Meltdown II: Pricing or Valuing? Investing or Trading?
- A Viral Market Meltdown III: Clues in the Market Debris
- A Viral Market Meltdown IV: Investing for a post-virus Economy
- A Viral Market Meltdown V: Back to Basics
- A Viral Market Meltdown VI: The Price of Risk
- A Viral Market Update VII: Market Multiples
- A Viral Market Update VIII: Value vs Growth, Active vs Passive, Small Cap vs Large!
- A Viral Market Update IX: A Do-it-Yourself S&P 500 Valuation
- A Viral Market Update X: A Corporate Life Cycle Perspective
- A Viral Market Update XI: The Flexibility Premium
- A Viral Market Update XII: The Resilience of Private Risk Capital
- A Viral Market Update XIII: The Strong (FANGAM) get Stronger!
No comments:
Post a Comment