Showing posts with label Inflation. Show all posts

Monday, September 26, 2022

Reaping the Whirlwind: A September 2022 Inflation Update!

In my early 2021 posts on inflation, I argued that while the higher inflation that we were just starting to see could be explained by COVID and supply chain issues, prudence on the part of policy makers required that it be taken as a long term threat and dealt with quickly. Not only did they not do so, but the fiscal and monetary actions they took in 2021 exacerbated inflationary pressures. By the start of 2022, the window for early action had closed and for much of this year, inflation has been the elephant in the room, driving markets and forcing central banks to be reactive, and its presence has already induced me to write three posts on its impact. In my first on May 6, 2022, I put the surge in inflation, in 2022, in historical context and argued that it is unexpected inflation that shakes up the economy and caused damage to financial assets, and that until we reached a steady state, where expectations and actual inflation converge, markets would continue to be unsettled. In a follow-up post on May 20, I looked at the disparate effects of inflation on individual companies, positing that safer companies with pricing power are more protected against inflation than riskier companies in competitive businesses. In a third post on July 1, 2022, I pointed to inflation as a key culprit in the retreat of risk capital, i.e., capital invested in the riskiest segments of every market, and presented evidence of the impact on risk premiums (bond default spreads and equity risk premiums) in markets. In terms of content, I am afraid this post will contain nothing new, but the fresh uncertainties about inflation, and its impact, that have opened up this summer require at least an updating of the numbers. 

Inflation: Actual and Expected

In September 2022, there is no denying that inflation is back, and with a vengeance, though we can still debate how quickly it will fade, and to what level. The happy talk of 2021, where many policy makers and investors were dismissive of its emergence, attributing it almost entirely to the COVID recover and supply chain problems, has largely faded and a grim acceptance has set in that we have an inflation problem, the solution to which may be perhaps as painful as the problem. One reason investors and businesses are struggling with this latest bout of inflation is that they have been spoiled by a decade of low and stable inflation, and as a consequence, have neither planned for high and unstable inflation, in their business models, nor developed analytical tools to deal with that inflation. To see the inflation break in 2022, relative to history, I report on four widely used measures of inflation in the US - the consumer price index (CPI ), with & without seasonal adjustments, the producer price index (PPI) and the GDP Price Deflator below:

Source: Federal Reserve, St. Louis (FRED)
On every measure, inflation exploded in the first half of 2022, with a leveling off, albeit at high rates in the summer. The table below the graph also backs up my point about the 2011-2020 time period being an outlier, in terms of inflation being low (with the average at 1.73%) and stable (with the standard deviation across the years of 0.81%). The graph above is one of actual inflation, but as I have emphasized all through this year, it is expected inflation that drives markets, and it is on measures that try to capture inflation expectations that you see the turn in 2022. While spending the bulk of 2021 in denial, investors seem to have woken up, and expected inflation numbers are reflecting that. In the charts below, I graph out the inflation that consumers are expecting in two different surveys, one from the University of Michigan and the other from the NY Fed that show the rise in expected inflation:
As you can see, in both surveys, the expected inflation number has risen, to 5.20% in the University of Michigan survey and to 5.7% in the NY Fed survey. This rise in expected inflation also shows up in a different survey of expectations, from the Fed (St. Louis), measuring the probabilities of expected inflation in consumer expenditures:

Fed Reserve, St. Louis
After a decade where most expected inflation to be less than 1.5%, with a small percentage even expecting deflation, more than 80% now expect inflation to be higher than 2.5%, in the future and none expect deflation. The problem with survey-based expectations is that they are volatile and often are responses to recent experiences with inflation. There is a market-based estimate of inflation that comes from the US treasury market, where a comparison of yields on a treasury bond with that on a inflation-protected treasury bond of equivalent maturity provides a measure of expected inflation. This measure is reported, for the 10-year US Treasuries, from 2003 through September 2022, in the graph below:

On September 23, 2022, the market-imputed inflation number stood at 2.37%, the difference between the 10-year T.Bond rate of 3.69% and the 10-year TIPs rate of 1.32% on that day. It is lower than the survey-based inflation expectations, but  it a long term expected inflation rate, and you can use the term structure of Treasury and TIPs rate to extract an expected inflation term structure:

Put simply, investors are expecting inflation to peak over the next year and subside in the long term, close to the levels that we saw in the last decade. That may be hopeful thinking, and the returns on stocks and bonds over the rest of the decade will be determined by the correctness of this assessment; if investors are under estimating expected inflation in the long term, as they did in the 1970s, we are in for an extended period of malaise in markets.

Inflation’s First Order Effects: Interest Rates and Exchange Rates

Since 2008, it has become fashionable to attribute all movements in interest rates to Fed action or inaction, and as a consequence, we have lost sight of the fundamentals that determine interest rates. The most critical fundamental, and the one that best explains big movements in rates, over time, is expected inflation. For the last decade, it was not quantitative easing or Fed alchemy that kept interest rates low, but low inflation, in conjunction with anemic real growth. 

As investor expectations of inflation have risen in 2022, treasury rates have risen inexorably, across the term structure:

In keeping with our earlier assessment of investors expecting higher inflation in the near term, than the long term, rates have risen across the term structure, but short term treasuries have risen more than long term treasuries. To get a measure of the damage done to bond prices as a consequence, note that the increase in the 10-year treasury rate from 1.51% to 3.69%, in 2022, has resulted in a return of -16.45% on a constant maturity bond.

As rates have risen at different rates in the short and the long term, the US treasury yield curve, which started the year with a steep upward slope has become distorted, and on September 23, 2022, the 2-year rate, at 4.20%, was higher than the 10-year rate, at 3.69%, with a relatively flat curve beyond 10 years:

Source: US Treasury
While I am remain a skeptic on inverted yield curves as cannot-fail predictors of recessions, the message in the distortions in the yield curve on September 23, 2022, is not a positive one about the future of the economy. 

The other first order effect from inflation, and the Fed's reaction to it, has also been in the currency market, where the US dollar has soared against almost every currency, with the Euro and the British pound trading at or close to historic lows. 

At one level, this is interest rate parity at play, as US interest rate rise faster than rates in other countries. At another, it is a flight to safety, as worries about the global economy and markets take hold. At every level, though, exchange rate movements that are this strong create chaos and disruption in the economies of both the strengthening and weakening currencies.

Second Order Effects: Risk Capital and Risk Premia

If the only consequence of higher expected inflation was higher interest rates, the damage from it would be contained and perhaps even neutralized by earnings and cash flows growing at higher rates, aided by inflation. However, higher inflation almost always seems to be accompanied with more uncertainty about inflation, and it is this second order impact that does real damage, in terms of how it impacts risk capital. In my July 2022 post, I defined risk capital broadly as capital invested in the riskiest segments of each asset class, and used the picture below to illustrate its reach:

Note the contrast between risk capital and safety capital, and in a healthy market, you need a balance between the two, with the excess of safety capital leading to stagnant economies and markets, and an excess of risk capital creating bubbles in markets and distortions in the economy. The last decade, for better or worse, has seen an explosion of risk capital, aided and abetted by central banks and policy makers. Inflation’s return to the center stage has, at least for the moment, broken the spell, and risk capital has withdrawn significantly from markets. 

  • Venture capital: The VC focus on start-ups and young companies makes it a focal point of any measure of risk capital, and it has ebbed and flowed over time, with sharp pullbacks in the aftermath of the dot-com bust in 2001 and the banking crisis in 2008. The graph below updates venture capital investments, by quarter, from the first quarter of 2020 to July/August 2022:
    Source: Crunchbase

    Note the drop off in venture capital in the first quarter of 2022, and the even steeper decline in the second quarter suggests that this may not be a temporary retreat.
  • Initial Public Offerings: The exit path for the most successful of the ventures backed by VCs is an initial public offering, and the number and dollar value of initial public offerings operates as a proxy for the availability of and access to risk capital. In the graph below, we look at the this statistic across time, updated again through 2022:
    Source: Jay Ritter for historical and Pitchbook for recent IPO data
    Here again, the drop off in initial public offerings, both in number and value in 2022 has been dramatic, and if history is any guide, there will not be a quick comeback.

  • High Yield Bonds: High yield debt has always been part of the landscape of corporate bond markets, but for much of the last century, it was composed of investment grade debt that had been downgraded, as a consequence of corporate distress. Since the 1980s, companies with low ratings have been able to make issuances of their debt, with the demand for this original issuance high yield debt coming from bond buyers willing to take on additional risk. In the graph below, I track the issuance of high yield bonds over time, with a focus on the most recent quarters:
    Source: SIFMA

    As with VC capital and IPOs, note the drop off in high yield debt issuances in 2022, both in dollar value terms, and as a percent of total bond issuance.

As risk capital has moved to the sidelines, the price of risk, i.e., the premium that investors demand for taking on risk has surged. You can see this in rising default spreads in corporate and sovereign bond markets, where spreads, which started 2022 at close to historic lows have risen, and more so for the lowest ratings. 

Source: FRED

In the equity market, the only immediate weapon that equity investors have for adjusting their price of risk assessment, i.e., the equity risk premium, is the stock price, pushing stock prices down, if they want higher equity risk premiums. It is for that reason that my assessments of equity risk premiums are model-agnostic and are based upon stock prices today and expected cash flows in the future being used to back out an expected return on stocks. Those assessments in the long term (1960-2021) and in the last two years (from January 2022 to September 23, 2022) are shown below:

There are two things that stand out about equity markets in 2022. The first is the surge in the equity risk premium from from 4.24% on January 1, 2022, to 6.05%, on September 23, 2022, an increase on par with what we have seen during market crises (2001, 2008 and 2020) in the past. The second is that as equity risk premiums have jumped, the treasury bond rate has more than doubled, from 1.51% on January 1, 2022, to 3.69% on September 23, 2022. In contrast to the afore-mentioned crises, where the treasury bond rate dropped, offsetting some of the impact of the rise in equity risk premiums, this inflation-induced market reaction has caused the expected return on stocks to rise from 5.75% on January 1, 2022, to 9.75%, on September 23, 2022; that increase of 4% dwarfs the increases in expected returns that we witnessed in the last quarter of 2008 or the first quarter of 2020.

Third Order Effects: The Economy and Psyches

The first and second order effects of inflation have been significant and damaging, but the question that remains unanswered is about the long term effects on the economy, and more importantly, on investor and consumer psyches. As you have probably noticed, perceptions of where the economy is headed have worsened, as we have gone through 2022, even in the face of relatively good news on unemployment. Much of the blame for the darkening forecasts has been directed toward Jerome Powell and the Federal Reserve, and while there is much that you can critique about how the Fed has played its cards during this crisis, it is inflation that is in the driver’s seat, not the Fed. Interest rates have risen this year because of inflation expectations rising, and it is these higher rates (and expected inflation) that are leading the Fed to act. In short, the Fed has two choices, neither of which is appealing. It can do nothing, which is the path that some of its critics would rather have it take, and interest rates will continue to rise, perhaps at an even faster rate, as inflation expectations surge. Alternatively, it can try to reclaim the narrative, by acting to slow the economy down,  perhaps even putting it into a recession, with length and severity still to be determined. Rock, meet hard place!

As investors, our assessments of how inflation and the economy will evolve in the coming years will determine how much we should pay for stocks and bonds today. Having chronicled how inflation has changed the level of interest rates and the price of risk, let us bring in the remaining questions on earnings, cash flows and growth that we need to address to evaluate whether the market has under or over reacted to inflation:

In the sections below, I will focus on how I see inflation playing out in  assessments of earning and growth, for the S&P 500 companies, as well as in their cash returns (dividends and buybacks).
  1. Earnings: At the start of 2022, optimism was pervasive among analysts that the economy would continue to show strength and that earnings at US companies, up almost 47% in 2021, would grow strongly in 2022 and 2023. That optimism about the economy has faded, but there has not been a concurrent drop in estimated earnings, as you can see in the table below:
    Source: Factset, Ed Yardeni
    The earnings estimate for 2023, for S&P 500 companies, stood at 243.46, down only 0.6% from what it was on January 1. There are some subtle signs that forecasts of a recession are finding their way into earnings estimates. First, as you can see in the table, analyst estimates for what companies would generate as earnings in 2023 rose every month from January to June, but have dropped, albeit only slightly, during the summer. Second, the percentage of companies that are offering negative guidance about future earnings stood at 54%% in September 2022, suggesting that they see stormy weather ahead. 
    Source: Factset

  2. Cash Flows: Investors in public equities have no direct claim on earnings, and are reliant on companies returning cash to them in dividends, and increasingly over the last few decades, in stock buybacks. The dividends paid change relatively little from period to period, making them sticky, but stock buybacks are more volatile, with sharp cutbacks during crises or when companies become more concerned about their economic futures. The table below graphs dividends and buybacks, by year, going back to 2001, and also the dividends and buybacks, by quarter, just for the last four years:

    Note the rising proportion of cash returned in buybacks, over the last 20 years, and the pullbacks in 2008/2009 and the first two quarters of 2020, in response to crises. That buyback number has largely recovered from its COVID swoon, and hit an all time high in 2021, with $734 billion in stock buybacks, across the S&P 500 companies. After rising again in the first quarter of 2022, we did see a pullback, albeit a small one, in the second quarter of 2022, with the possibility that there will be more coming in the third and fourth quarters of the year.
  3. Long term inflation and interest rates: Having spent all of 2022 trying to hit a moving target on expected inflation, and the resulting interest rate, the one guarantee for the future is that there is more change coming. To make a judgment of direction, we have no choice but to take a stand on where inflation will settle in after supply chains are fixed, COVID is in the past and perhaps after the economy has cooled down. If we will revert back to inflation of 1-2%, as the market seems to believe we will, we will face a very different end game than if we revert back to 1980s levels of 3-4%. 
With the caveat that I have absolutely no new insights or information into this process, I did make my estimates for the S&P 500, with the resulting valuation shown below:
Download spreadsheet

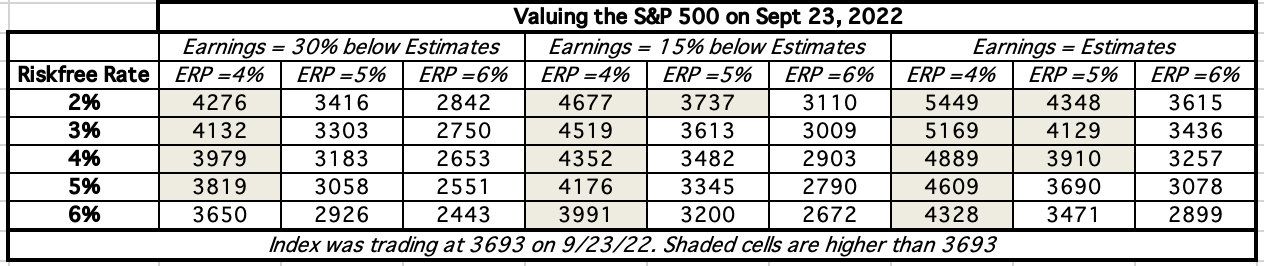
I think that the given market pricing today, and my expectations of expected earnings and cash flows, stocks are very mildly over valued on September 23, 2022. I trust my judgments enough that I will leave my existing equity holdings intact, but I am not quite ready to jump in and make bets on market direction now. Clearly, your assumptions for the future will be different from mine, and I have a Do-It-Yourself (DIY) valuation of the S&P 500 that you can use to make your own judgment. In the table below, I list out the valuations that I get for the index with various combinations of 10-year treasury bond rates, equity risk premiums and assumptions about earnings in the future, relative to analyst forecasts:
S&P 500 Intrinsic Value Scenarios
If you are bullish, the assumption that makes the biggest difference is where you see equity risk premiums converging, with premiums closer to 4% yielding undervaluation on the index, even with significant earnings shocks built in. At the other end of the spectrum, if the equity risk premium stays at 6% or higher, the only scenario where you arrive at a value close to the index is if the 10-year T.Bond rate drops to 2% and earnings estimates come in as expected, with significant corrections to come, in scenarios where rates stay higher and/or earnings come in below estimates. 
    Given a choice between allowing inflation to play itself out and initiating polices that trigger a recession, there are some who are pushing for the former, arguing that trading off the certain pain that comes with a recession for the uncertain benefits of lower inflation is not good policy. I sympathize, but the dangers of letting inflation play out is that if it does so in unpleasant ways, where it stays high and volatile, its effects are going to be far more long term and more damaging. High and volatile inflation corrodes economies and markets from the inside out, destroying faith in currencies and making  investors and businesses behave in dysfunctional ways. 

YouTube Video

Spreadsheets
Datasets


Friday, May 20, 2022

A Follow up on Inflation: The Disparate Effects on Company Values!

In my last post, I discussed how inflation's return has changed the calculus for investors, looking at how inflation affects returns on different asset classes, and tracing out the consequences for equity values, in the aggregate. In general, higher and more volatile inflation has negative effects on all financial assets, from stocks to corporate bonds to treasury bonds, and neutral to positive effects on gold, collectibles and real assets. That said, the impact of inflation on individual company values can vary widely, with a few companies benefiting, some affected only lightly, and other companies being affected more adversely, by higher than expected inflation. In an environment where finding inflation hedges has become the first priority for most investors, the search is on for companies that are less exposed to high and rising inflation. The conventional wisdom, based largely on investor experiences from the 1970s, is that commodity companies and firms with pricing power are the best ones to hold, if you fear inflation, but is that true, and even if it is true, why is it so?  To answer these questions, I will return to basics and try to trace  the effects of inflation on the drivers of value, with the intent of finding the characteristics of stocks with better inflation-hedging properties.

Inflation and Value

When in doubt about how any action or information plays out in value, I find it useful to go back to value basics, and trace out the effects of that action/information on value drivers. Following that rule book, I looked at the effects of inflation on the levers that determines value, in the graph below:


Put simply, the effects of inflation on firm value boil down to the impact inflation has on expected cash flows/growth and risk. At the risk of restating what is already  in the graph above,  the factors that will play out in determining the end impact on inflation on value are in the table below:


If you were seeking out a company that would operate as an inflation hedge, you would want it to have pricing power on the products and services that it sells, with low input costs, and operating in a business where investments are short term and reversible. On the risk front, you would like the company to have a large and stable earnings stream and a light debt load

Looking Back
There are lessons that can be learned by looking at the past, about how inflation affects different groupings of companies, though there is the danger of over extrapolation. In this section, I look first at how classes of stocks have done over the decades, and relating that performance to inflation (expected and unexpected). I then examine how equities have performed in the less than five months of 2022, where inflation has returned to the front pages.

Historical Data: 1930-2019
To see how this framework works in practice, let's start by looking at the performance of US stocks, across the decades, and look at the returns on stocks, broadly categorized based on market capitalization and price to book ratios. The former is short hand for the small cap premium and the latter is the proxy for the value factor in returns.
The distinction that I made between expected and unexpected inflation comes into play in this table. It is unexpected inflation that seems to have a large impact on the behavior of small cap stocks, outperforming in  decades where inflation was higher than expected (1940-49, 196069, 1970-79)  and underperforming in decades with lower than expected inflation (1990-99, 2010-19). The value effect, measured as the difference between low price to book and high price to book stocks was highest in the 1970s, when both actual and unexpected inflation were high, but remained resilient in the 1980s, when inflation stayed high, but came in under expectations. 

The 2022 Experience
    As the focus has shifted back to inflation in the last five months, it is worth looking at performance across US stocks, broken down by different categorizations, to see whether the patterns of the past are showing up in today's markets.. For starters, let's look at the how the damage done by inflation on stocks varies across sectors, looking at the 2022 broken down in three slices, the returns in the first quarter of 2022 (when Russia competed with inflation for market attention), the period from April 1 - May 19, 2022 (when inflation was the dominant story) and the entire year to date.


In 2022, the collective market capitalization of all US firms has dropped by 19.75%,  with the bulk of the drop occurring after April 1, 2022. During the period (April 1- May 19, 2022), the three worst performing sectors (highlighted) were technology, consumer discretionary and communication services, and the best performing sectors were energy (no surprise, given the rise in oil prices) and utilities, old standbys for investors during tumultuous periods.  

To check to see if the outperformance of small cap and low price to book ratios that we saw in the 1970s is being replicated in 2022, I broke companies down by decile (based on market cap and price to book at the start of 2022), and looked at changes in aggregate value in 2022:

As in the 1970s, the small cap premium seems to have returned with a vengeance, as small cap stocks have outperformed large caps in 2022, and the lowest price to book stocks have done less badly than high price to book stocks. To examine the interaction and stock price performance in 2022, I looked at the aggregate returns on firms classified into deciles based upon both equity risk (betas) and default risk (with bond ratings):
The link between equity risk and stock returns support the hypothesis that firms that are riskier are more affected by inflation, with one exception: the stocks with the lowest betas have also done badly in 2022. On bond ratings, there is no discernible link between ratings and returns, until you get to the lowest rated bonds (CCC & below). In a final assessment, I break down companies based upon operating cash flows (EBITDA as a percent of enterprise value) and dividend yield (dividends as a percent of market capitalization).
Companies that generate more cash flows from their operations and return more of that cash flow in dividends to stockholders have clearly held their value better than companies with low or negative cash flows that pay no dividends, in 2022.  Looking at these results, value investors will undoubtedly find vindication for their beliefs that this is a correction long over due, i.e., a return to normalcy where safe stocks in boring sectors that pay high dividends deliver excess returns. I do think that given how consistently growth stocks have been beating value stocks for the last decade, a correction was in order, but I believe it is way too early to proclaim the return of old fashioned value investing. 

Bottom Line
This has been a painful year for investors in US equities, but the pain has not been evenly spread across investors. Portfolios that are over weighted in risky, money losing companies have been hurt more than portfolios that are more weighted towards companies with less debt and more positive cash flows. Even within some of the worst performing sectors, such as technology, breaking companies down, based upon earnings and cash flows, there is a clear advantage to holding money making, older tech companies than money losing, young tech companies:
The question of whether these trends will continue to apply for the rest of the year cannot be answered without taking a stand on inflation, and the effects that fighting it will create for the economy. 
  • If you believe that there is more surprises to come on the inflation front, and that a recession is not only imminent, but likely to be steep, the returns in the first five months of 2022 will be a precursor to more of the same, for the rest of the year. 
  • If you believe that markets have mostly or fully adjusted to higher inflation, betting on a continuation of the small cap and value outperformance to continue is dangerous. 
  • To the extent that there may be other countries where inflation is not the clear and present danger that it is in the United States, investing in equities in those countries will offer better risk and return tradeoffs.
As I noted in my last post, once the inflation genie is out of the bottle, it tends to drive every other topic out of market conversations, and become the driving force for everything from asset allocation to stock selection. 

YouTube Video


Inflation Posts (in 2022)

Friday, May 6, 2022

In Search of a Steady State: Inflation, Interest Rates and Value

The nature of markets is that they are never quite settled, as investors recalibrate expectations constantly and reset prices. In most time periods, those recalibrations and resets tend to be small and in both directions, resulting in the ups and downs that pass for normal volatility. Clearly, we are not in one of those time periods, as markets approach bipolar territory, with big moves up and down. The good news is that the culprit behind the volatility  is easy to identify, and it is inflation, but the bad news is that inflation remains the most unpredictable of all macroeconomic factors to factor into stock prices and value. In this post, I will look at where we stand on inflation expectations, and the different paths we can end up on, ranging from potentially catastrophic to mostly benign.

Inflation: The Full Story

    I wrote my first post on this blog in 2008, and inflation merited barely a mention until 2020, though it is an integral component of investing and valuation. Since 2020, though, inflation has become a key story line in almost every post that I write about the overall market, and I have had multiple posts just on the topic. To see why inflation has become so newsworthy, take a look at the chart below, where I graph inflation from 1950 to 2022, in the United States:

Download data

While I report multiple measures of inflation, from the consumer price index (adjusted and unadjusted) to the producer price index, to the price deflator used in the GDP, they all tell the same story. We have had a long stretch of low and stable inflation, and that is especially true since the 2008 crisis. In fact, the average inflation rate in the 2011-20 decade was the lowest of the seven decades that I cover in this chart. Just as important, though, is the fact that variation in inflation, from year to year, was lower in 2011-2020 in every other decade, other than 1991-2000. It reinforces a point I made in my inflation post last year, where I argued that to understand inflation's impact on asset values, you have to break it down into its expected and unexpected components, with the former showing up in the expected returns you demand on investments, and the latter playing out as a risk factor.


Investors who are old enough to remember the 1970s point to it as a decade of high inflation, but that is only with the benefit of hindsight. At the start of that decade, investors had no reason to believe that they were heading into a decade of higher inflation, and initial signs of price increases were attributed to temporary factors (with OPEC being a convenient target). In fact, expected inflation lagged actual inflation through much of the decade, and the damage done to financial asset returns that decade came as much from actual inflation being higher than expected inflation, period after period, as from higher inflation.

It is precisely because we have been spoiled by a decade of low and stable inflation that the inflation numbers in 2021 and 2022 came as such a surprise to economists, investors and even the Fed. Early on, the inflation surge was explained away by the reopening of the economy, after the COVID shutdown, and then by stressed supply chains, and expectations about future inflation stayed low. However, as reported inflation has remained stubbornly high, and neither COVID nor supply chains provided sufficient rationale, market expectations of inflation have started to go up. I capture this shift using two measures of expected inflation, the first coming from the University of Michigan's surveys of consumer expectations of inflation for the future and the latter from the US Treasury market, as the difference between the ten-year treasury bond and the ten-year inflation-protected treasury bond (TIPs) rates:


Consumer expectations of inflation reached 5.40% in March 2022, hitting levels not seen since the early 1980s. While the market-implied expected inflation rate has also climbed to a ten-year high of 2.85%, it is clearly lower than the consumer survey expectation. There are three possible explanations for the divergence:

  1. Short term versus Long term: The consumer survey extracts an expectation of inflation in the near term, whereas the treasury markets are providing a longer term perspective, since I am using ten-year rates to derive the market-implied inflation.
  2. Consumers are over adjusting: The big inflation surges have happened in gasoline, food and housing, all items that consumers use on a continuous basis, and it is possible that they are over reacting and adjusting expected inflation up too much, as a consequence.
  3. Markets are under adjusting: Alternatively, it is possible that it is consumers who are being realistic, and it is that the bond markets which are under adjusting to higher inflation, partly because many investors have operated only in a low and steady inflation environment, and partly because some of these investors have a belief that the Fed has super powers when it comes to setting interest rates and determining inflation.
I have always argued that the notion of the Fed as this all-powerful entity that sets rates, determines economic growth and keeps inflation in check is a myth, and a very dangerous one at that, since it gives license to policy makers and investors to behave rashly, expecting a safety net to protect them from their mistakes. 

Economic Consequences

    As inflation, actual and expected, has made a return, it is not surprising that the ripple effects are being felt across the economy, with the ripples sometimes resembling tidal waves. The most direct effects have been on interest rates, where we have seen rates rise quickly, and to levels not seen in years. In the chart below, I look at how the treasury curve has shifted in the recent periods:


To provide a sense of how much rates have changed just in 2022, compare the yield curve on January 1, 2022 to the one on May 5, 2022. On January 1, 2022, the yields on the very short end of the maturity spectrum (1-6 month treasuries) were close to zero, the ten-year treasury bond rate was 1.51% and the long end of the yield curve had an upward slope. On May 5, 2022, the treasury yields for the short end had risen, with the 1-month rate reach 0.50%, the ten-year treasury bond rate had breached 3% and the term structure had leveled out for the long end of the spectrum (with the 2-year yield moving towards the 10-year yield, which in turn was close to the 20-year and 30-year yields). Of course, the "Fed did it" crowd will argue that this is all Jerome Powell's doing, an indication of how little they understand about both what rates the Fed does control (the Fed Funds rate is at the very shortest end of the spectrum, and it is not a trading rate) and how willing they are to ignore the data. If you were to graph out when the Fed woke up from its inflation-denial and when treasury rates started rising, it seems clear that it was the treasury market that is causing the Fed to act, rather than the other way around.
    As treasury rates have risen, markets also seem to have been more wary about risk, and how it is being priced. In the chart below, I start with the default spreads in the corporate bond market and you can see the increase in spreads that have occurred just over the course of 2022:

Default spreads have risen across every ratings class, but more so for lowly-rated bonds than for bonds with higher ratings. Here again, there are some who would attribute this to the Russia-Ukraine conflict, but that would miss the fact that bulk of the surge in spreads happened before February 23, 2022, when the conflict started. In the equity market, I capture the price of risk with a forward-looking estimate of expected returns on stocks, computed from the level of stock prices and expected future cash flows, and I graph both the expected return and the implied equity risk premium (from netting out the risk free rate) in the graph below:

Implied ERP spreadsheet

In equity markets, the shift in expected returns has been significant, perhaps even dramatic, as the expected return on stocks, which started 2022 at 5.75%, has moved above 8% for the first time since May 2019, with some of that shift coming from a higher treasury bond rate (1.51% to 2.89%) and some of it coming from a higher equity risk premium (4.24% to 5.14%).

    As the inflation bogeyman returns, the worries of what may need to happen to the economy to bring inflation back under control have also mounted. Almost every economic forecasting service has increased its assessed probability for a recession, with variations on depth and length. In a note published in mid-April, Larry Summers and Alex Domash go as far as to put the likelihood of a recession at 100%, based upon a joint indicator, i.e., that a combination of inflation > 5% and unemployment<4% has always led to a recession within 12 to 24 months, using quarterly data from the 1950s to today. While I remain a skeptic about historic rules of thumb (downward sloping yield curve, for example) to make predictive statements about future economic growth, I think that we can state categorically that there is a greater chance of an economic slowdown now than just a few weeks ago.

Investment Consequences

    As the storm clouds of higher inflation and interest rates, in conjunction with slower or even negative economic growth, gather, it should come as no surprise that equity markets are struggling to find their footing. At the close of trading on May 5, 2022, the S&P 500 stood at 4147, down 13.3% from the start of the year value, accompanied by increased volatility. To the question of whether to sell, hold on or buy in the face of weakness, the answer will depend on your macro assessments of the following:

  1. Steady State Interest Rate: As noted in the last section, the ten-year bond rate has doubled this year, an uncommonly large move for US treasuries, and there are three possibilities for the future. The first is that the bulk of the move in rates is behind us, and that treasury rates now reflect updated expectations of inflation. The second is that, like the 1970s, we will play catch up with inflation, and that rates will continue to move up, until expectations on inflation become more realistic. The third is that inflation is either transient, and will revert back to the lows we saw last decade, or that the economy will go into a recession and act as a natural break on inflation and interest rates. Note that in all three cases, it is not the Fed that is driving rates, but what is happening to inflation.
  2. Equity Risk Premium Path: The equity risk premium of 5.24%, estimated at the start of May 2022, is at the high end of historical equity risk premiums, but we have seen higher premiums, either in crises (end of 2008, first quarter of 2020) or when inflation has been high (the late 1970s). I think that what happens to equity risk premiums for the rest of the year will largely depend on inflation numbers, with high and volatile inflation continuing to push up the premium, and steadying and dropping inflation having the opposite effect.
  3. Earnings Estimates: The strength of the economy has been a big contributor to boosting actual and expected earnings on companies in the last two years, and these higher earnings have translated into more cash returned in dividends and buybacks. The earnings estimates for the S&P 500 companies from analysts, at the start of May 2022, reflect that strength and there seems to have been no adjustment downwards for a recession possibility. That may either reflect the fact that equity analysts are not among those who expect a recession (or expect only a very mild one, with little impact on earnings) or the possibility that there may be a lag in the process between the economy weakening and analysts adjusting expected earnings.
To see how these three forces play out, consider what I would term the status quo scenario, where you assume that today's treasury bond rate (3%) is the steady state, that earnings estimates will largely be delivered and that the equity risk premium will stabilize around current levels:

Download spreadsheet
The intrinsic value that you get for the index (4181) is almost spot on to the actual value, and that should not come as a surprise, since it reflects the consensus view on rates, earnings and risk premiums. However, there are wide divergences from the consensus on all three inputs and in the table below, I estimate the index values under these divergent viewpoints:


As you can see, the range of values is immense and they include scenarios ranging from the upbeat to the catastrophic. At one end of the spectrum, in the most benign scenario, which I will title Much Ado about Nothing, inflation turns out to be transient, fears of economic collapse are overstated and the equity risk premium reverts back towards historic norms, and the market looks under valued, perhaps even significantly so. At the other end, in perhaps the most malignant scenario, titled The Seventies Show, inflation continues to rise, even as the economy goes into recession and risk premiums spike, leading to a further correction of close to 50% in the market. In the middle, the Volcker rerun, Jerome Powell discovers his inner central banking self, cracks down on inflation and wins, but does so by pushing the company into a deep recession, making himself extremely unpopular with politicians up for election and the unemployed. There is a fourth possibility, where you Live and let live (with inflation), where we (as investors and consumers) accept a higher inflation world, with its costs and consequences, as the price to pay to keep the economy going. 
   One of the costs that come with the last scenario is that inflation eats away at trust in not just currencies, but in all financial assets, and that investors will turn away from stocks and bonds. In the 1970s, the asset classes that benefited the most from this flight were gold and real estate, and the question is which asset classes will best play this role now, if inflation is here to stay. I do think that securitizing real estate has made it behave more like financial assets, and removed some of its power to hedge against inflation, but there may be segments (such as rental properties, where rent can be raised to match inflation) that retain their inflation fighting magic. Gold's history as a collectible gives it staying power, but the truth is that it is not big enough or productive enough as an investment class for us to all hold it. That, of course, brings us to cryptos, NFTs and other, more recent, entrants into the investment choice list. In theory, you could make the argument that these new investment choices will operate like gold, but you have two serious barriers to overcome. The first is that they have not been around for long, and that history is full of collectibles, from tulip bulbs to Beanie Babies to Pokemon cards,  that people paid high prices for, but failed to hold their value. The second is that in the limited history that we have for cryptos and NFTs, they have behaved less like collectibles (holding or increasing in value, as stocks and bonds collapse) and more like very risky equities, going up when stocks go up, and dropping when stocks go down. In fact, higher and sustained inflation may be the acid test of whether there is any substance to the bitcoin as millennial gold story, and the results will make or break those holding cryptos for the financial apocalypse that they see coming.

In Conclusion
The inflation genie is out of the bottle, and if history is any guide, getting it back in is going to take time and create significant pain. It is the lesson that the US learned in the 1970s, and that other countries have learned or chosen to not learn from their own encounters with inflation. It is the reason that when inflation made itself visible in the early part of 2021, I argued that the Fed should take it seriously, and respond quickly, even if there existed the possibility that it was transient. Needless to say, the Fed and the administration chose a different path, one that can be described as whistling past the graveyard, not just ignoring the danger with happy talk, but also actively taking decisions that only exacerbated the danger. Needless to say, they now find themselves between a rock (more inflation) and a hard place (a recession), and while you may be tempted to say "I told you so", the truth is that we will all feel the pain. 

YouTube Video

Spreadsheets

Data

Thursday, January 27, 2022

Data Update 3 for 2022: Inflation and its Ripple Effects!

    Inflation numbers have been coming in high now, for more than a year, but for much of the early part of 2021, bankers, investors and politicians seemed to be either in denial or casually dismissive of its potential for damage. Initially, the high inflation numbers were attributed to the speed with the economy was recovering from COVID, and once that excuse fell flat, it was the supply chain that was held responsible. By the end of 2021, it was clear that this bout of inflation was not as transient a phenomenon as some had made it out to be, and the big question leading in 2022, for investors and markets, is how inflation will play out during the year, and beyond, and the consequences for stocks, bonds and currencies.

Inflation: Measurement and Determinants

    As the inflation debate was heating up in the middle of last year, I wrote a comprehensive post on how inflation is measured, what causes it and how it affects returns on different asset classes. Rather than repeat much of that post, let me summarize my key points.

  • Measuring inflation is not as simple as it looks, and measures of inflation can vary depending on the basket of good/services used, the perspective adopted (consumer, producer, GDP deflator) and the sampling used to collect prices. That said, the three primary inflation indices in the US, the CPI, the PPI and the GDP deflator all told the same story in 2021:
    Download historical inflation numbers

    The inflation rate during the course of the year reached levels not seen in close to 40 years, with every price index registering a surge.
  • While news stories focus on reported (and past inflation, it is expected inflation that should drive investment, and measures of these expectations can come from surveys of consumers (University of Michigan) or from the market, as the difference between the treasury bond rate and the inflation-protected treasury bond, of equivalent maturity:
    Download data

    Using the ten-year bond, it is clear that while inflation expectations have inched up in the bond market, but that rise is far more muted than in the actual inflation indices, and consumer expectations of inflation now significantly exceed the bond-market imputed estimate for expected inflation.
  • While the implied inflation in bond rates is low, investors seem to be anticipating higher inflation. Using a measure that the Federal Reserve has developed, I report the percent of investors expecting inflation to be greater than 2.5%, representing one end of the inflation expectation spectrum, and those expecting deflation, representing the other, in the graph below:
    Download data
    As you can see the 93.96% of investors were expecting inflation to be greater than 2.5%, by the end of December 2021, up from 6.74% in December 2020, suggesting a sea change in the market. Conversely, the percent of investors expecting deflation has dropped to a vanishing low number, suggesting that Cathie Wood has little company, in her contention that deflation is the real danger to markets and economies.
The undeniable fact is that inflation came back in 2021, but the question of why it happened, and whether it will stay high, is  hotly debated. To those who believe that it is a spike that will dissipate over time, it is another casualty of COVID, as a combination of virus-driven supply chain issues and government spending to offset shutdowns has driven prices up. In this mostly benign story, inflation will go back down, once these pressure ease, though it is unclear to what level. To others, and especially those old enough to remember the 1970s, it does seem like a return to more unsettled times, with potentially dangerous consequences for the economy and markets.

Interest Rates and Inflation

    Inflation and interest rates are intertwined, and when their paths deviate, as they sometimes do, there is always a reckoning. While we have increasingly given central banks primacy in discussions of interest rates, it remains my view that markets set rates, and while central banks can nudge market expectations, they cannot alter them. Put simply, no central bank, no matter how powerful, can force market interest rates down, if inflation expectations stay low, or up, if investor are anticipating high inflation. 

US Treasuries: A Mostly Uneventful Year

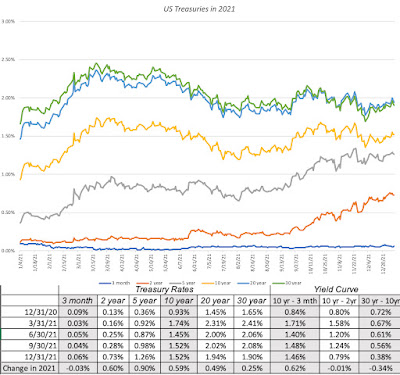
    After a turbulent year in 2020, when COVID shut the global economy down, and interest rates plunged and stayed down for the rest of the year, 2021 was a more settled year, with long term rates rising gradually over the course of the year, but short terms rates staying put:

Treasury Rates Data

While treasury bills continued to yield rates close to zero, rates increased for longer term treasuries, with 2-10 years rates rising much more than rates on the longest term treasuries (20-year to 30-year). For those who track the slope of the yield curve, and I am not one of those who believes that it has much predictive power, it was a confusing year. The treasury curve became steeper, but only at the shortest end of the spectrum, with the slope rising for the 2-year, relative to the 3-month, but not at all, when comparing the 10-year to the 2-year rate. Beyond the 10-year maturity, the slope of the yield curve actually flattened out, with the difference between the 30-year rate and the 10-year rate declining by 0.34%.

Corporate Bonds: No Shortage of Risk Capital

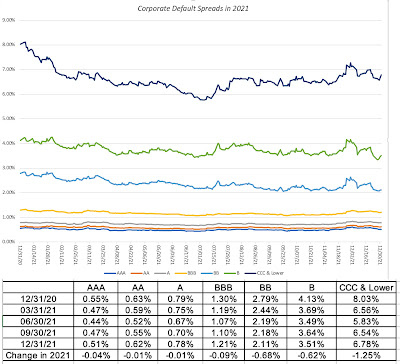
    In my last post, I chronicled the movement in the equity risk premium, i.e. the price of risk in the equity market, during 2021, but the bond market has its own, and more measurable, price of risk in the form of corporate default spreads. Using bond ratings classes to categorize companies, based upon credit risk, I looked at the movement of default spreads during 2021:

Download data

Corporate default spreads decrease across ratings classes, but the decline is much larger for lower rated bonds, with the default spread on high yield bonds registering a drop of 1.25%. Note that the decrease in default spreads, at least for the lower ratings, mirrors the drop in the implied equity risk premium during the course of 2021. Read together, it suggests that private risk capital continued to not just stay in the game, but increased its stake during the course of the year, extending a decade-long run.

Expected Inflation, Interest Rates and Bond Returns

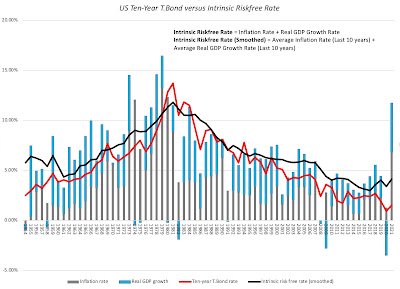
    While day to day movements in interest rates are driven by multiple forces, including the latest smoke signals coming from central banks and investor sentiment, the longer term and drivers of interest rates are fundamental. In particular, if you start by breaking down a long term riskfree rate (like the 10-year treasury bond) into an expected inflation and an expected real interest rate components, you can also reconstruct an intrinsic risk free rate by assuming that the real growth in the economy is a stand-in for the real interest rate and that most investors form expectations of future inflation by looking at the inflation in the most recent year(s):

Download data

In this picture, the actual ten-year treasury bond rate is superimposed against a rough measure of the intrinsic risk free rate (obtained by adding together the actual inflation rate and real growth rate each year) and a smoothed out version (where I used the average inflation rate and real growth rate over the previous ten years). Not only has the intrinsic risk free rate moved in sync with the ten-year bond rate for most of the last seven decades, but you can also see that the main reason why rates have been low for the last decade is not the Fed, with all of its quantitative easing machinations, but a combination of low growth and low inflation. Coming into 2022, though, the intrinsic risk free rate is clearly running ahed of the ten-year treasury bond rate, and if history is any guide, that gap will close either with a rise in the treasury bond rate or a decline in the risk free rate (coming from a recession or a rapid drop off in inflation). 

Unexpected Inflation and Asset Returns

    Note that it is expected inflation that drives interest rates, and that the actual inflation rate can come in above or below expectations. In my post on inflation last year, I drew a contrast between expected and unexpected inflation, arguing that financial assets are affected differently by each component. If expected inflation is high, but it is predictable, investors and businesses have the opportunity to incorporate that inflation into their decision making, with investors demanding higher interest rates on bond and expected returns on stocks, and businesses raising prices on their products/services to cover expected inflation. Unexpected inflation is what catches us off guard, with unexpectedly high inflation leading to a reassessment of pricing (for all financial assets) and an uneven impact across businesses, leaving those with pricing power in a better position than those without that power. 

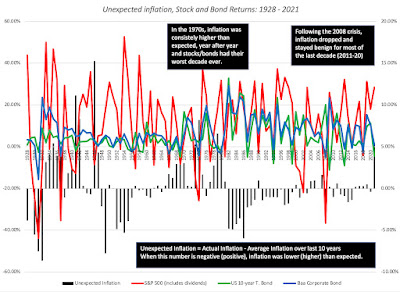
    To assess how inflation has affected asset returns over time, I broke down the actual inflation rates since 1954 into expected and unexpected components each year, using a brute force assumption that the average inflation rate over the last ten years is the expected inflation rate. (In the last two decades, we have had access to more sophisticated measures of expected inflation, including the difference between the nominal treasury bond and TIPs rates, but not in earlier years). In the graph below, I look at annual returns on stocks, treasury bonds and corporate bonds, with the unexpected inflation numbers also shown:


There are a few aspects of this graph that stand out. With my crude measure of inflation expectations, it looks like it takes time for inflation expectations to shift, during periods of higher or lower inflation, as can be seen in the extended stretches of higher than expected inflation, in the 1970s, and lower than expected inflation in the 1980s. 

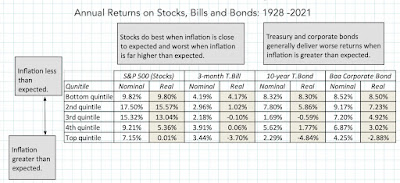
    While it is not immediately visible in the graph, returns on stocks and bonds are affected by unexpected inflation, and to illustrate by how much, I broke the 94 years of data into five quartiles, based upon the level of unexpected inflation, with the lowest (highest) quintile representing the years when inflation came in most below (above) expectations, and estimated the annual returns (nominal and real) for stocks, treasuries and corporate bonds in the table below:

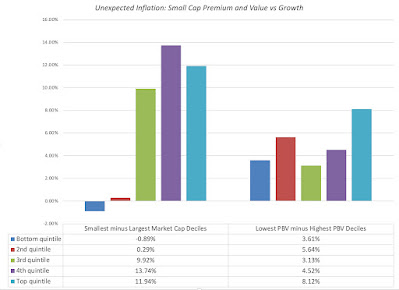
With treasuries and corporates, the returns generally get worse, as inflation comes in above expectations, with real returns showing the damage from unexpected inflation. With equities, the sweet spot in terms of returns is when inflation is at or below expectations, and the worst scenarios are when inflation comes in well above expectations.  I also looked at how inflation plays out on equity sub-groupings, on two dimensions, the first being market capitalization and the second being price to book, with the former becoming a stand-in for the vaunted small cap premium and the latter for the value versus growth question.

Over much of the last century, small cap stocks have done better than large cap stocks, when inflation has come in well above expectations, perhaps providing some insight into why the vaunted small cap premium seems have to disappeared over the last two decades of muted inflation. Similarly, the value effect, computed as the premium (or discounted) return earned by low price to book stocks over high price to book, becomes more pronounced during periods when inflation is greater than expected and much less so, during periods when inflation is lower than anticipated.
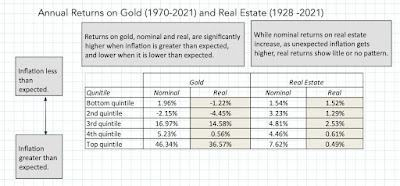
    Using the same approach with gold and real estate, with the caveat that historical data on the former is more limited, I get the following results:
While gold and real estate both do better than financial assets, when inflation is greater than expected, there is also a clear difference between the two investment classes. Real estate operates more as a neutral hedge, delivering returns that are, for the most part, unscathed by unexpectedly high inflation, but gold is a bet on inflation, delivering the highest returns, when inflation is much greater than expected, and negative returns, when it is lower than expected. Much as I would like to extend this analysis to newer investment classes, there is not enough historical data on crypto currencies or NFTs to allow for the analysis. As I noted in my inflation post in 2021, though, the early evidence is not promising for these new investment categories, at least as inflation and crisis hedges, since they have behaved more like risky equities, at least on a day-to-day basis and during the 2020 crisis, than like gold.

Inflation and Currencies
    Much of this post has been about inflation in the US, and by extension, in US dollar terms, it is worth emphasizing that inflation is a currency-specific phenomenon. While inflation in the US dollar, by dint of its status as the currency in which commodities are priced, can sometimes spill over into other currencies, it remains true that you can have high inflation in one currency, while there is low inflation in other currencies. Inflation differences across currencies play out in two domains, with the first being interest rates in different currencies and the other being exchange rate.
    
Interest Rates across Currencies
    I start every one of my discussions of discount rates with a truism, by stating that the riskfree rate that you start with should reflect the currency in which you have decided to do your valuation. That then becomes the springboard for estimating risk free rates in different currencies, following one of two paths. In the first, you start with government bond rates in the local currency, in different currencies, and adjust those rates for default risk in the local currency government bond. (Government bonds in local currencies do default, and account for a significant proportion of sovereign defaults in the last 50 years). My estimates for the start of 2022 for the currencies where local-currency government bonds are available is below:
Download data

Riskfree rates are highest in currencies, like the Zambian Kwacha or Turkish Lira, where inflation is highest, lower in low-inflation currencies and even negative in currencies, where deflation may be the long term prediction. I am using the default spreads based upon the local currency sovereign ratings for the countries in question, with the government bond rate being the risk free rate only for currencies where the issuing government in triple-A rated. If you dislike this assumption, or do not believe that the government bond rate is a market-set number in a particular market, there is a second approach, where you start with the risk free rate in US dollar or Euros, and adjust it for differential inflation, i.e., the difference in expected inflation between the US and the country in question:
Thus, if the US treasury bond rate is 1.5%, and expected inflation rates in the US and Indonesia are 1% and 4% respectively, the approximate riskfree rate in Indonesian Rupiah will be 4.5% (=1.5% + (4%-1%)) and the more precise riskfree rate in Rupiah will be 4.52% (=1.015*(1.04/1.01)-1). While the expected inflation rate in dollars may be an easy get, it is more difficult to get expected inflation rates in other currencies, but the IMF has estimates for the next five years at this link.

Exchange Rates
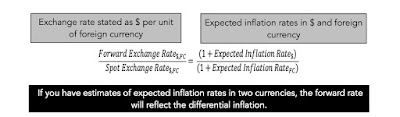
    Just as interest rates in currencies are determined, in large part, by inflation differentials, exchange rates over time are also driven by those same inflation differentials. Drawing on one of the oldest relationships in exchange rates, purchasing power parity, you can extract the forward exchange rate in a currency:

Thus, currencies with higher inflation can be expected currency devaluation over time, relative to currencies with lower inflation. As with interest rates, in the short term, there are forces, ranging from central banking intervention to momentum and speculation, that can cause rates to deviate from the inflation script, but in the long term, it is almost impossible to break the cycle.
    Connecting this linkage to the discussion of US inflation in the prior sections, here are the takeaways. If you believe that inflation will stay high, not just in the US, but across the globe, the exchange rate effects will be muted. If, on the other hand, you believe that the inflation shock will vary across countries, your actions will be more nuanced. For the countries where you believe that local inflation will decrease, relative to the US,  the US dollar will weaken against their currencies, augmenting returns you will earn in their markets (stock or bond). For countries, where you see local inflation surging more than you expect to see in the US, the US dollar will strengthen against their currencies, reducing the returns you make in their markets. As with the discussion of asset returns, it is not expected inflation that is the source of exchange rate risk, since you can incorporate those expectations into exchange rates, but unexpected inflation, which, when extreme, can cause significant revaluations of currencies. 

Conclusion
    As with any historical data assessment, I could give you the standard boilerplate disclaimer that past performance is not always a good predictor of the future, but to the extent that the past provides signals, your expectations of how inflation will play out in the coming year will play a key role in your asset allocation and stock selection decisions. If you believe that last year's surge in inflation is a precursor to a long time period when inflation is likely to stay high, and come in above expectations, you should be shifting your holdings away from financial to real assets, and within your equity holdings, towards small cap stocks,  stocks trading at lower pricing multiples (PE, Price to Book) and companies with more pricing power. If, on the other hand, you believe that inflation worries are overdone, and that there will be a reversion back to the low inflation that we have seen in the last decade, staying invested in stocks, and especially in larger cap and high growth stocks, even if richly priced, makes sense.

YouTube Video

Data Links
Blog Post Links