Debt's place in business
To understand debt's role in a business, I will start with a big picture perspective, where you break a business down into assets-in-place, i.e., the value of investments it has already made and growth assets, the value of investments you expect it to make in the future. To fund the business, you can either use borrowed money (debt) or owner's funds (equity), and while both are sources of capital, they represent different claims on the business. Debt provides contractual claims, in the form on interest payments and principal repayments, whereas equity is a residual claim, i.e., you receive whatever cash flows, if any, that are left over after other claim holders have been paid:

Good Reasons for Borrowing
What are the pluses and minuses of borrowing, if you take a clear-eyed look at it just as a capital source? First, borrowing money cannot alter the operating risk in a business, which comes from the assets that it holds, either in-place or as growth investments, but it will affect the risk to equity investors in that business, by making their residual claim (earnings) more volatile, In addition, the contractual claim that comes with debt can create truncation risk, because failing to make interest or principal payments can result in bankruptcy, and effective loss of equity. Second, borrowing money at a lower rate, by itself, cannot alter your overall cost of funding, since that cost is determined by the risk of your assets. Hence, the benefits of borrowing at a lower rate will always be offset by a higher cost for equity investors, leaving the cost of funding unchanged, unless a finger is put on the scale, giving one source special benefits. In much of the world, governments have written tax codes that do exactly this, by making interest payments on debt tax-deductible, while requiring that cash flows to equity be made out of after-tax cash flows. That tax benefit of debt will increase with the marginal tax rate, making it much more beneficial to borrow in countries with high tax rates (Germany, Japan, US) over those with lower tax rates (Ireland, much of Eastern Europe). The chart below lists the tax benefits as the primary benefit of borrowing and the expected bankruptcy cost as the primary downside of debt:

Bad Reasons for Borrowing

On the other side of the ledger, there are some companies that refuse to borrow money for bad reasons as well. The first is that borrowing money will lower net income, as interest expenses get deducted from operating income, but that lower net income will be accompanied by less equity invested in the firm, often leading to higher earnings per share, albeit with higher volatility. The second is that borrowing money will increase perceived default risk, and if the company is rated, lower ratings, and that too is true, but borrowing money at a BBB rating, with the tax benefit incorporated, might still yield a lower cost of funding that staying at a AA rating, with no debt in use.
The "Right" Financing Mix
Is there an optimal mix of debt and equity for a business? The answer is yes, though the payoff, in terms of value, from moving to that optimal may be so small that it is sometimes better to hold back from borrowing. In this section, I will lay out a mechanism for evaluating the effects of borrowing on the cost of funding a business, i.e., the cost of capital, and talk about why firms may under or overshoot this optimal.
An Optimizing Tool
In my second and third data posts for this year, I chronicled the effects of rising interest rates and risk premiums on costs of equity and capital. In computing the latter, I used the current debt ratios for firms, but made no attempt to evaluate whether these mixes were "right" or not. That said, the cost of capital can be used as an optimizing tool in assessing the right mix of debt and equity, with the optimal mix being the one that yields the lowest cost of capital. That computation, though, is a dynamic one, since both the cost of equity and the cost of debt will change as a business changes its debt ratio:

In effect, you are trading off the benefits of replacing more expensive equity with lower-rate debt against the resulting higher costs of equity and debt, when you borrow more. As you can see, the net effect of raising the debt ratio on the cost of capital will depend on where a firm stands, relative to its optimal, with under levered firms seeing costs of capital decrease, as debt ratio increases, and over levered firms seeing the opposite effect.
As to the variables that determine what that optimal debt ratio is for a firm, and why the optimal debt ratio can range from 0% for some firms to close to 90% for others, they are simple and intuitive:
- Marginal tax rate: If the primary benefit of borrowing is a tax benefit, the higher the marginal tax rate, the higher its optimal debt ratio. In fact, at a zero percent tax rate, the optimal debt ratio, if you define it as the mix that minimizes cost of capital is zero. The picture below captures differences in corporate marginal tax rates, entering 2023, across the world:

Download marginal tax rates, by country
As you can see from the heat map and table, most countries have converged around a tax rate of 25%, with a few outliers in Eastern Europe and parts of Middle East having marginal tax rates of 15% or lower, and a few outliers, including Australia, India and parts of Africa with marginal tax rates that exceed 30%. Of these countries, Australia does offer protection from double taxation for equity investors, effectively endowing equity with some tax benefits as well, and reducing the marginal tax benefits from adding debt. - Cash generating capacity: Debt payments are serviced with operating cash flows, and the more operating cash flows that firms generate, as a percent of their market value, the more that they can afford to borrow. One simplistic proxy for this cash generating capacity is EBITDA as a percent of enterprise value (EV), with higher (lower) values indicating greater (lesser) cash flow generating capacity. In fact, that may explain why firms that trade at low EV to EBITDA multiples are more likely to become targets in leveraged buyouts (LBOs) or leveraged recapitalizations..
- Business risk: Not surprisingly, for any given level of cash flows and marginal tax rate, riskier firms will be capable of carrying less debt than safer firms. That risk can come from many sources, some related to the firm (young, evolving business model, highly discretionary products/services), some to the sector (cyclical, commodity) and some to the overall economy (unstable). The company-specific factors show up in the risk parameters that you use for the firm (beta, rating) and the macro and market-wide factors show up in the macro inputs (riskfree rates, equity risk premiums)

If you are interested in checking how this optimization works, download this spreadsheet, and try changing the inputs to see the effect on the optimal. I looked Adani Enterprises, the holding company for the Adani Group and estimated the cost of capital and estimated value at different debt ratios:

In my assessment, Adani Enterprise carries too much debt, with actual debt of 413,443 million more than double its optimal debt of 185,309 million, and reducing its debt load will not just lower its risk of failure, but also lower its cost of capital. This company is part of a family group, where higher debt at one of the Adani companies may be offset by less debt at another. To deal with this cross subsidization, I aggregated numbers across all seven publicly traded Adani companies and estimated the optimal debt mix, relative to the combined enterprise values:

The Adani Group collectively carries about three times as much debt as it should, confirming that the group is over levered as well, but note that this is bad business practice, not a con. In fact, as you can see from the cost of capital graph, there is little, if any, benefit in terms of value added to Adani from using debt, and significant downside risk, unless the debt is being subsidized by someone (government, sloppy bankers, green bondholders).
If you have taken a corporate finance class sometime in your past life are probably wondering how this approach reconciles with the Miller-Modigliani theorem, a key component of most corporate finance classes, which posits that there is no optimal debt ratio, and that the debt mix does not affect the value of a business. That theorem deserves the credit that it gets for setting up the framework that we use to assess debt today, but it also makes two key assumptions, with the first being that there are no taxes and the second being that there is no default. Removing debt's biggest benefit and cost from the equation effectively negates its effect on value. Changing your debt ratio, in the Miller-Modigliani world, will leave your cost of capital unchanged. In the real world, though, where both taxes and default exist, there is a "right" mix (albeit an approximate one) of debt and equity, and companies can borrow too much or too little.
Effect on value
If you can see the mechanics of how changing debt ratio changes the cost of capital, but are unclear on how lowering the cost of capital changes the value of a business, the link is a simple one. The intrinsic value of a business is the present value of its expected free cash flows to the firm, computed after taxes but before debt payments, discounted back at its cost of capital:
As you borrow more, your free cash flows to the firm should remain unaffected, in most cases, since they are pre-debt cash flows, and a lower cost of capital will translate into a higher value, with one caveat. As you borrow more and the risk of failure/bankruptcy increases, there is the possibility that customers may stop buying your products, suppliers may demand cash and your employees may start abandoning ship, creating a death spiral, where operating income and cash flows are affected, in what is termed "indirect bankruptcy costs". In that case, the optimal debt ratio for a company is the one that maximizes value, not necessarily the one at which the cost of capital is minimized.
Do companies optimize financing mix?
Do companies consider the trade off between tax benefits and bankruptcy costs when borrowing money? Furthermore, do they optimize they debt ratios to deliver the lowest hurdle rates. The answer may be yes for a few firms, but for many, debt policy is driven by factors that have little to do with value and more with softer factors:
- Inertia: In my view, at most companies the key determinant of debt policy, as it is of most other aspects of corporate finance, is inertia. In other words, companies continue the debt policies that they have used in the past, on the mistaken view that if it worked then, it should work now, ignoring changes in the business and in the macro economy. That, for instance, is the only way to explain why older telecom companies, which developed a practice of borrowing large amounts during their time as monopoly phone businesses, continue that practice, even as their business have evolved into intensely competitive, technology businesses.
- Me-to-ism: The second and almost as powerful a force in determining debt policy is peer group behavior. Staying with the telecom firm theme, newer telecom companies entering the space feel the urge to borrow in large quantities, because other telecom companies borrow. It is for this reason that debt policy is far more likely to vary across industry groups than it is to vary within an industry group.
- Because lenders are willing to lend me money: There is a final perspective on debt that can lead companies to borrow money, even if that borrowing is inimical to their own well being, and it is that if lenders offer them the money, you cannot turn them away. In fact, it is the excuse that real estate developers use after every boom and bust cycle to explain away why they chose to borrow as much as they did. The "lenders made me do it" excuse for borrowing money is about as bad as the "the buffet lunch made me overeat" excuse used by dieters, and it just as futile, because ultimately, the damage is self inflicted.
- Control: In my post on the Adani Group, I noted that in their zeal for control, insiders, founders and families sometimes make dysfunctional choices, and one of those is on borrowing. A growing firm needs capital to fund its growth, and that capital has to come from equity issuances or new borrowing. When control becoming the dominant prerogative for those running the firm, they may choose to borrow money, even if it pushes up the cost of funding and increases truncation risk, rather than issue shares to the the public (and risk dilution their control of the firm).
Measuring Debt Loads
With the long lead in on the trade off that animates the borrowing decision, let us talk about how to measure the debt load at a company. While the answer may seem obvious to you, it is not to me, and I will start by looking at debt scaled to capital, a measure of debt's place in the financing mix, and then look at debt scaled to cash flows or earnings, often a better measure of potential default risk.
Debt to Capital Ratios
In the financial balance sheet that I used at the start of this post, I noted that there are two ways of raising capital to fund a business, debt, with its contractual claims on cash flows, or equity, with its residual claims. Following up, it does make sense to look at the proportions of each that a firm uses in funding and that can be measured by looking at debt, as a percent of capital in the firm. That said, there are (at least) four variants that you will see in practice, depending on the composition of total debt, and whether capital is obtained from an accounting balance sheet (book value) or a financial balance sheet (market value):- Gross versus Net Debt: The gross debt is the total debt owed by a firm, long and short term, whereas the net debt is estimated by netting out cash and marketable securities from the total debt. While there is nothing inherently that makes one measure superior to the other, it is important to remember that gross debt can never be less than zero, but net debt can, for firms that have cash balances that exceed their debt.
- Book versus Market: The book debt ratio is built around using the accounting measure of equity, usually shareholder's equity, as the value of equity. The market debt ratio, in contrast, uses the market's estimate of the value of equity, i.e., its market capitalization, as the value of equity. While accountants, CFOs and bankers are fond of the book value measure, almost everything in corporate finance revolves around market value weights, including the debt to equity ratios we use to adjust betas and costs of equity and the debt to capital ratios used in computing the cost of capital.
There are sub-variants, within these four variants, with debates about whether to use only long-term debt or all debt and about whether lease debt should be treated as debt. My advice is that you consider all interest-bearing debt is debt, and that picking and choosing what to include is an exercise in futility.
I computed gross and net debt ratios for all publicly traded, non-financial service firms, at the start of 2023, relative to both book and market value, with the distribution of debt ratios at the start of 2023 below:
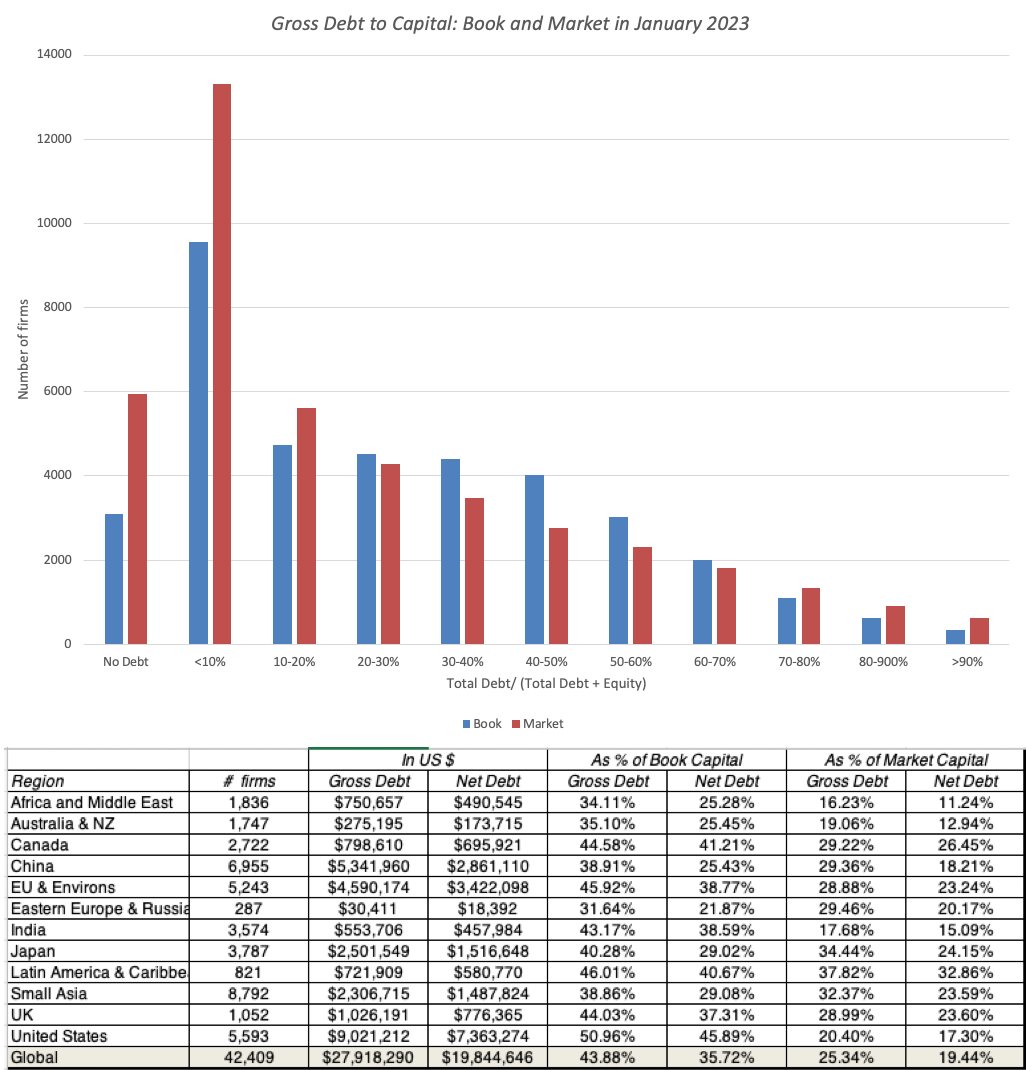
If you have been fed a steady diet of stories of rising indebtedness and profligate companies, you will be surprised by the results. The median debt ratio, defined both in book and market terms, for a global firm at the start of 2023 was between 10% and 20% of overall capital. It is true that there are differences across regions, as you can see in the table below, which computes the debt ratios based upon aggregated debt and equity across all firms and is thus closer to a weighted average. On a book debt ratio basis, the United States, as a region, has the highest debt ratio in the world, but on a market debt ratio basis, Latin America and Canada have the highest debt loads.
The problem with using debt to capital ratios to make judgments on whether firms are carrying too much, or too little, debt is that, at the risk of stating the obvious, you cannot make interest payments or repay debt using capital, book or market. Put simply, you can have a firm with a high debt to capital ratio with low default risk, just as you can have a firm with low debt to capital with high default risk. It is one reason that a banking focus on total assets and market value, when lending to a firm, can lead to dysfunctional lending and troubled banks. To the retort from some bankers that you can liquidate the assets and recover your loans, I have two responses. First, assuming that book value is equal to liquidation value may let bankers sleep better at night, but it can be delusional in industries where they're no ready buyers for those assets. Second, even if liquidation is an option, a banker who relies on liquidating assets to collect on loans has already lost at the lending game, where the objective is to collect interest and principal on loans, while minimizing defaults and liquidations.
Debt to EBITDA, Interest Coverage Ratios
If debt to capital is not a good measure for judging over or under leverage, what is? The answer lies in looking at a company's earnings and cash flow capacity, relative to its debt obligations. The interest coverage ratio is the first of two ratios that I will use to measure this capacity:
Interest Coverage Ratio = Earnings before interest and taxes/ Interest expenses
Debt to EBITDA = Total Debt/ EBITDA
The logic behind this measure is simple. The denominator is a measure of operating cash flows, prior to a whole host of cash outflows, but a firm that borrows too much relative to EBITDA is stretching its capacity to repay that debt.
I compute both ratios (interest coverage and Debt to EBITDA) for all publicly traded firms and the results are graphed below, with the important caveat that they move in opposing directions, when measuring safety, with safer firms having higher interest coverage rations and lower Debt to EBITDA multiples;

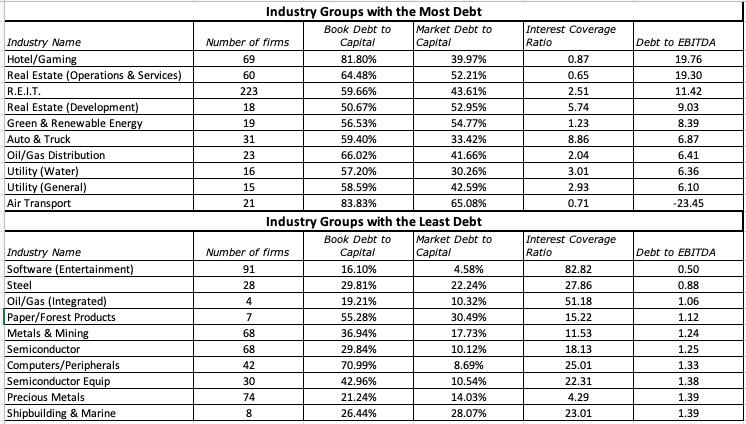
To get a closer look at difference across companies, I looked at the 94 industry groups that I break down companies into, and look at the most highly levered (with total debt to EBITDA as my primary sorting proxy, but reporting my other debt load measures) and least highly levered industry groups, looking at just US publicly traded companies:
 |
| Download all industry group data |
The Default Question
The biggest downside of debt is that it increases exposure to default risk, and as the last part of this analysis, I will look at default rates over time, culminating in 2022, and then look ahead to the challenges that companies will face in 2023 and beyond.
Business Default: The what and the why
- Company-specific troubles: A deterioration in a company’s operating business, either because of competitive pressures or the company’s own mistakes, can cause operating cash flows to drop, putting a once-healthy company at risk of default. In some cases, the shock to the company’s earnings and cash flows can come from the loss of a lawsuit (giving rise to large new commitments), a regulatory fine or other unexpected cash outflow.
- Sector-wide issues: If disruption is the word that has excited venture capitalists and investors across the world for much of this century, it comes with a dark side, which is that the disrupted businesses can find themselves with imploding business models (shrinking revenues and operating margins under stress). As a consequence, over time, these disrupted firms find themselves more and more exposed to default risk; Bed, Bath and Beyond has less debt outstanding now than they did a decade ago, but have gone from credit worthy to bankrupt over that period.
- Macroeconomic shocks/changes: Some businesses, especially in commodity and cyclical industry groups, have always been and will continue to be exposed to cycles that can cause operating earnings, even for the best run and most mature companies, to swing wildly from period to period. Oil companies, for instance, went from being money-losers (on an operating income basis) in 2020, when oil prices plunged, to among the biggest money-makers in the business world in 2022. Speaking of 2020, we all remember the COVID-driven shutting down of the global economy in the first half of the year and the havoc it wreaked on borrowers and lenders, as a consequence.
- Debt payment surges: There is a final reason for default, which a surge in debt payments arising from rising interest rates and the refinancing of existing debt at those higher rates. Put simply, a company with a billion dollars in debt outstanding, at a 2% interest rate, will see its interest payments double, if rates double to 4%, and the debt is refinanced. Historically, this has been more an issue in emerging markets, where businesses borrow short term and rates are volatile, than in developed markets, where a combination of longer-term debt and more stable interest rates has insulated businesses from the worst of this phenomenon. But as I noted in my data post on interest rates, the last year (2022) has been a most unusual one, in terms of interest rate moves, in developed markets.
Defaults – Historical
 |
| Sources: Loan Delinquencies from Federal Reserve Site (FRED) and Corporate Defaults from S&P |
Ratings Actions and The Year Ahead
 |
| S&P Default and Distress, Feb 2023 |
Note again that the downgrades in 2022 are nowhere near the downgrades that you saw in 2008, during the banking crisis, and one reason was that rising interest payments notwithstanding, the economy stayed robust during the year.

Not surprisingly, a combination of high inflation and a steep recession will create the most defaults, as the vice of lower earnings and higher interest rates will ensnare more firms. At the other end of the spectrum, a swift drop off in inflation with no recession will create the most benign environment for lenders, allowing default to remain low.
A Wrap
In both our personal and business lives, there are good reasons for borrowing money and bad ones. After all, the politicians who lecture businesses about borrowing too much are also the ones who write the tax code that tilts the playing field towards debt, and by bailing out businesses or individuals that get into trouble by borrowing too much, they reduce its dangers. That said, there is little evidence to back up the proposition that a decade of low interest rates has led companies collectively to borrow too much, but there are some that certainly have tested the limits of their borrowing capacity. For those firms, the coming year will be a test, as that debt gets rolled over or refinanced, and there are pathways back to financial sanity that they can take.
YouTube Video
Datasets
- Debt ratios, by industry groupings (US, Global)
- Delinquency rates on bank loans, by Quarter (US): 1985- 2022
No comments:
Post a Comment