In my last post, I looked at banking as a business, and used a simple banking framework to advance the notion that the key ingredient tying together the banks that have failed so far in 2023 is an absence of stickiness in deposits, created partially by depositor and deposit characteristics (older are stickier than younger) and partly by growth in deposits (high growth increases stickiness). I also used the banking framework to argue that good banks have stickier deposits, with a higher precent of these deposits being non-interest bearing, that they invest in loans and investment securities on which they earn interest rates that cover and exceed the default risk in these investments. While differentiating between good and bad banks can be straightforward, it does not follow that buying good banks and selling bad banks is a good investment strategy, since its success depends entirely on what the market is incorporating into stock prices. An investor who buys a good bank at too high a price, given its goodness, will underperform one who buys a bad bank at too low a price, given its badness. In this post, I will begin by looking at how to value banks and follow up with an examination of investor views of banking have changed, by looking at pricing, before examining divergences in how banks are priced in the market today.
The Intrinsic Value of Bank Equity
I am a dabbler in all things valuation-related, and I find the process fascinating, as stories about businesses get translated into valuation inputs, and finally into value. I enjoy challenging valuations, but banks remain, at least for me, the last frontier in valuation, simply because so much of what we do in conventional valuation does not work with banks, and a crisis or panic can upend even the most carefully done bank valuation.
All Equity, All the time!
With most non-financial service businesses, you face a choice in how you approach valuation. You can value the enterprise or the entire business, focusing on valuing the operations or assets of the business, and consider capital as inclusive of both debt and equity. Alternatively, you can value just the equity in the business, focusing on cash flows left over after debt payments and discounting back at a rate of return that reflects the risk that equity investors face:
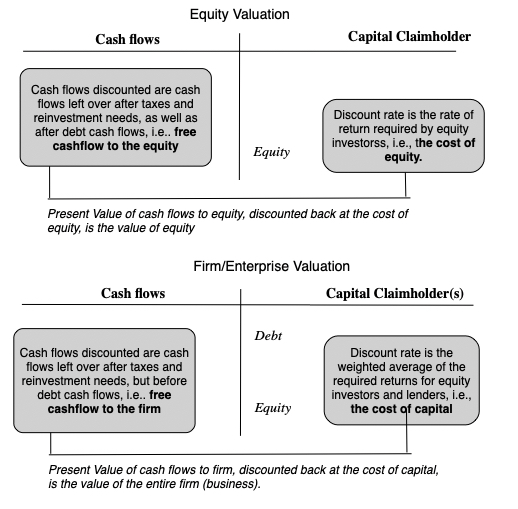
With banks, this choice does not exist, since debt to a bank can be expansively defined to include deposits as well, making it effectively raw material for the bank's operations, where the objective is borrow money (from depositors and lenders) at a low rate and lend it out or invest it at a higher rate. Consequently, you can only value the equity in a bank, and by extension, the only pricing multiples you can use to price banks are equity multiples (PE, Price to Book etc.). The notion of computing a cost of capital for a bank is fanciful and fruitless, and any attempt to compute an enterprise value for a bank is destined to end in failure.
Equity Valuation 101 and Dividend Discount Model
Staying on equity valuation, the intrinsic value of equity can be written as a function of the cash flows left for equity investors, after reinvestment and taxes, and after all other claim holders have been paid, and the cost of equity:

Over the decades, analysts trying to put this model into practice with banks have run into trouble estimating cash flows for banks, using the traditional structure, since items like capital expenditures and working capital are impossible to measure at banks. It should come as no surprise that, at least with banks, analysts fell back on the only observable cash flows to equity, i.e., dividends;

It is this line of reasoning, i.e., that it is difficult, if not impossible, to estimate banking free cashflows to equity, that I used prior to 2008, when I argued for the use of the dividend discount model to value banks In using the dividend discount model, I was making two implicit assumptions. The first was that banks were run by sensible people, who paid out what they could afford to in dividends, neither holding back on paying dividends nor paying too much in dividends. The other was that the bank regulatory framework operated effectively, preventing banks from overreaching on risk or being under capitalized.
A Bank FCFE Model
The events of 2008 dispelled me of both delusions that allowed for the use of the dividend discount model, as it became clear that the managers of banks were anything but sensible and the regulatory framework had large holes in it that were exploited. In the years after, I have replaced dividends with a variant on free cash flow to equity, defined through the lens of a banking business, discounted back at a cost of equity reflecting banking risks (duration mismatches, low regulatory capital and riskiness of loan/investment portfolios).

Note the differences between the bank FCFE and bank dividend discount models.
- The first is that unlike dividends, which are floored at zero, the free cash flow to equity for a growing or severely undercapitalized bank can be negative, reflecting the need to raise fresh equity to survive.
- The other is that by tying cashflows to capitalization, it allows us to bring in that same factor into risk and costs of equity, with under capitalized banks have higher costs of equity.
- As a final component of bank equity value, and 2023 has brought this home to us is the reality that even a healthy, profitable bank can see its value melt away in days, if its depositors decide, for good, bad or no reasons at all, to withdraw their deposits and put the bank into the death spiral from which recovery can be close to impossible. Since this risk is existential, it is almost impossible to build into a discounted cash flow model, which is for a going-concern, and has to be incorporated as a risk of failure.
Valuing Citi
Intrinsic valuation models connect only when applied to real companies, and in the table below, I used the Bank FCFE model described above in my valuation of Citi (a choice that may strike you as odd, but which you will understand if you read the rest of my post). To set the table, in the battle of big banks for investor acclaim, Citi has clearly lost the battle not only against JP Morgan Chase, but against most of the other big US banks. It has delivered low growth and subpar profitability, but it has built up buffers in its capital ratios and still has a banking model that delivers a lucrative interest rate spread.
In my valuation, I will assume that Citi will continue on its cautious, low-growth path, growing its risk-adjusted assets at 3% a year in perpetuity, a little lower than its 3.74% growth rate over the last 5 years. Over time, I expect some improvement in the return on equity, which was 8.78% in 2022, to its five-year average of 9.50%, which is still lower than the cost of equity of 11.67% that I am using for large commercial banks (see picture below for how I am computing an implied cost of equity for the 25 largest banks). Finally, I will assume that the bank will continue to marginally improve its Tier 1 capital ratio, currently at 14.80% to reach a target of 15.00%, in five years:
 |
| Download spreadsheet to value Citi (or any bank) |
Note that the combination of low growth and a healthy, current regulatory capital ratio keep the needs for reinvesting in regulatory capital low, allowing for large potential dividends. Those high cash flows, even though they are delivered by a bank that earns and expects to continue to earn an ROE less than its cost of equity translate into a value of equity for Citi of about $69, making it about 32% under valued auto the stock price of $46.32, at close of trading on May 5, 2023. Obviously, you will have very different views about Citi than I do, and you are welcome to download the spreadsheet and input your numbers not just for Citi, but for any bank.
The Pricing of Bank Equity
You have heard me say this before, but I don't think there is any harm in repeating this. Value and price are words that are often used interchangeably, but they come from different processes and can yield different numbers for the same asset or company.

Since pricing requires comparison across companies, often with different units (numbers of shares outstanding), we generally convert market values into pricing multiples, to allow for this comparison. As we noted in the last section, the pricing multiples that we use to compare banks have to be equity multiples, with price earnings rations and price to book ratios being the most common choices.
Price to Book Ratio: Choice and Drivers
There is no sector where price to book ratios get used more than in banking and financial services, for two reasons. The first is that the book value of equity for a bank, by becoming the basis for regulatory capital, has operating consequences, since actions or events that lower than book value of equity (an unexpected loss, a regulatory fine, a trading shortfall) can cause a bank to become undercapitalized and go out of business. The other is that marking to market is more common in banks than at other sectors, the hold-to-maturity loophole notwithstanding, and that should make book value of equity a more meaningful figure than book value of equity at a software or a consumer product company.
To use the price to book ratio to price banks, I begin by identifying its drivers, and that is simple to do, if you start with an intrinsic equity valuation model. In fact, using the simplest equity valuation model that I can think of, which is a stable growth dividend discount model, we get:
Dividing both sides by book value of equity, and setting growth rate = (1- Payout ratio) ROE, we can simplify this equation:

This equation, in its simple, stable growth form, suggests that whether a bank trades at below or above its book value of equity will be driven by whether investors expect banks to earn more than their cost of equity (price to book>1), roughly the cost of equity (price to book = 1) or less than the cost of equity (price to book <1).
Price to Book for Banks: Over time
To get a measure of how banks are being priced today, it is worth getting perspective as to how investor views on bank profitability and risk have changed over time. To gain this perspective, I looked at the aggregated price to book ratio of all US banks, obtained by first aggregating the market capitalizations of all banks and dividing by the aggregated book equity from 2004 to 2022, at the end of each year, and in May 2023:

- Higher Risk: One explanation is that investors perceive banks to be riskier than they were prior to 2008, and at first sight, that seems puzzling since banks have become better capitalized over the last decade, as the regulatory authorities have reacted to the 2008 crisis by tightening safety capital requirements:
 As you can see the Tier 1 capital at US banks collectively has risen to 13-14% from 10-11% in the years leading into the 2008 crisis and after. It is true, though, that equity as a percent of total assets dipped especially in 2020 and 2021, before bouncing back, but even that statistic has shown little change over the decade.
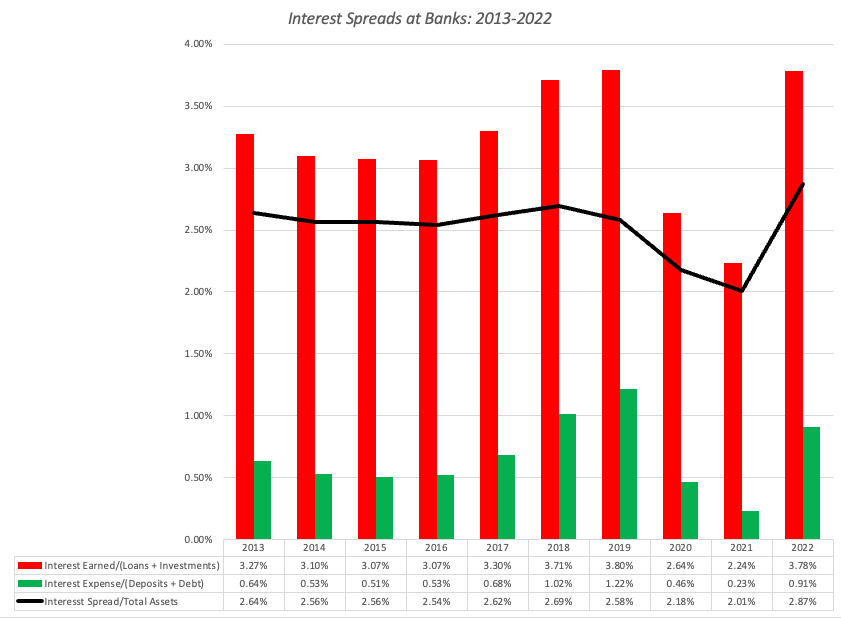
 - Lower Profitability: Another is that investors don't trust net income reported by banks as final numbers, given the propensity of some banks to surprise them with after-the fact and unexpected losses (from trading mistakes and asset write-downs) or believe that banks are becoming less profitable over time. To see if this is the case, I looked at the interest income and expenses over time at banks:
 Like the book equity, the spread dropped in 2020 and 2021, with 2022 showing a recovery. However, as interest rates have risen, it is likely that rates on deposits will rise faster than rates earned on loans and investments in the near term, perhaps a source of concern for investors.
 - Business Economics; If banks are not more risky, at least collectively, and interest spreads have held their own, the only remaining explanation is that investors believe that the banking business is much less likely to be value-adding now than two decades ago. Almost every aspect of banking is under stress, with deposits becoming less sticky, increased competition for the loan business from fintech and other disruptors and increased risks of contagion and crisis, and while banks remain profitable on the surface, investors have good reason to wonder whether the good times will last.

The Pricing of Banks - Across Banks
Even though I would not make a collective bet on banks collectively, I do believe that, as in any crisis, individual banks are getting mis-placed. Thus, as investors panic and sell regional banks, it is likely that good regional banks and lumped in bad ones, in the sell off, and if that money is being redirected to the bigger banks, some of those banks may not merit the price increases. Staying with price to book as my pricing metric for banks, I looked at the distribution of price to book ratios across banks, both at the end of 2022, and in May 2023, as the banking crisis has unfolded:

Since the key driver of price to book ratio is the return on equity, I looked at the distribution of returns on equity at US banks in 2021 and 2022:

Unlike companies in other sectors, where there are wide variations across companies, the returns on equity at banks is tightly clustered, with 50% of banks having 9.38% (9.24%) and 14.80% (13.75%) in 2021 (2022). However, there are clearly banks that generate higher returns on equity than other banks, and that should play a role in explaining differences in price to book ratios. To check how closely price to book ratios at banks hew to the returns on equities generated by banks, I did a scatter plot of price to book against ROE, both at the end of 2022 and again in May 2023:


I have highlighted the combination that characterizes the most under valued banks (low price to book, high ROE and a high Tier 1 capital ratio) as well as the combination for the most over valued banks (high price to book, low ROE and low Tier 1 capital
The Biggest Banks- Trawling for Bargains!
One of the exercises that I find useful, when pricing, is to look for the perfect underpriced stock, one that looks cheap with no good reason for why it is so cheap. Applying that practice to banks, here is what you would want to see in your underpriced bank:

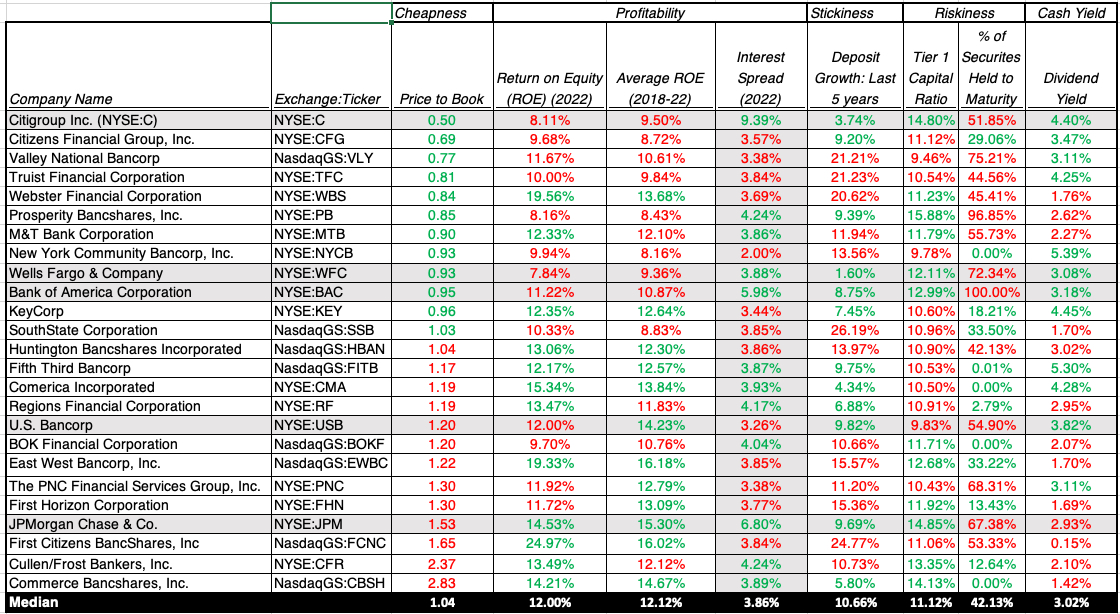 |
| Source: S&P Capital IQ |
Posts on the Banking Crisis 2023
- Breach of Trust: Decoding the Banking Crisis (of 2023)
- Good (Bad) Banks and Good (Bad) Investments: At the right price...
Bank Valuation Spreadsheet
No comments:
Post a Comment