Showing posts with label Dividends and cash balances. Show all posts

Friday, July 18, 2025

To Bitcoin or not to Bitcoin? A Corporate Cash Question!

    In this post, I will bring together two disparate and very different topics that I have written about in the past. The first is the role that cash holdings play in a business, an extension of the dividend policy question, with an examination of why businesses often should not pay out what they have available to shareholders. In my classes and writing on corporate finance, I look at the motives for businesses retaining cash, as well as how much cash is too much cash. The second is bitcoin, which can be viewed as either a currency or a collectible, and in a series of posts, I argued that bitcoin can only be priced, not valued, making debates about whether to buy or not to buy entirely a function of perception. In fact, I have steered away from saying much about bitcoin in recent years, though I did mention it in my post on alternative investments as a collectible (like gold) that can be added to the choice mix. While there may be little that seemingly connects the two topics (cash and bitcoin), I was drawn to write this post because of a debate that seems to be heating up on whether companies should put some or a large portion of their cash balances into bitcoin, with the success of MicroStrategy, a high-profile beneficiary of this action, driving some of this push. I believe that it is a terrible idea for most companies, and before Bitcoin believers get riled up, my reasoning has absolutely nothing to do with what I think of bitcoin as an investment and more to do with how little I trust corporate managers to time trades right. That said, I do see a small subset of companies, where the holding bitcoin strategy makes sense, as long as there are guardrails on disclosure and governance.

Cash in a Going Concern

    In a world where businesses can raise capital (equity or debt) at fair prices and in a timely manner, there is little need to hold cash, but that is not the world we live in. For a variety of reasons, some internal and some external, companies are often unable or unwilling to raise capital from markets, and with that constraint in place, it is logical to hold cash to meet unforeseen needs. In this section, I will start by laying out the role that cash holdings play in any business, and examine how much cash is held by companies, broken down by groupings (regional, size, industry). 

A Financial Balance Sheet

    To understand the place of cash in a business, I will start with a  financial balance sheet, a structure for breaking down a business, public or private:

On the asset side of the balance sheet, you start with the operating business or businesses that a company is in, with a bifurcation of value into value from investments already made (assets-in-place) and value from investments that the company expects to make in the future (growth assets). The second asset grouping, non-operating assets, includes a range of investments that a company may make, sometimes to augment its core businesses (strategic investments), and sometimes as side investments, and thus include minority holdings in other companies (cross holdings) and even investments in financial assets. Sometimes, as is the case with family group companies, these cross holdings may be a reflection of the company's history as part of the group, with investments in other group companies for either capital or corporate control reasons. The third grouping is for cash and marketable securities, and this is meant specifically for investments that share two common characteristics - they are riskless or close to riskless insofar as holding their value over time and they are liquid in the sense that they can be converted to cash quickly and with no penalty. For most companies, this has meant investing cash in short-term bonds or bills, issued by either governments (assuming that they have little default risk) or by large, safe companies (in the form of commercial paper issued by highly rated firms). 

    Note that there are two sources of capital for any business, debt or equity, and in assessing how levered a firm is, investors look at the proportion of the capital that comes from each:

  • Debt to Equity = Debt/ Equity
  • Debt to Capital = Debt/ (Debt + Equity)

In fact, there are many analysts and investors who estimate these debt ratios, using net debt, where they net the cash holdings of a company against the debt, with the rationale, merited or not, that cash can be used to pay down debt.

  • Net Debt to Equity = (Debt-Cash)/ Equity
  • Debt to Capital = (Debt-Cash)/ (Debt + Equity)
All of these ratios can be computed using accounting book value numbers for debt and equity or with market value numbers for both. 

The Motives for holding Cash

    In my introductory finance classes, there was little discussion of cash holdings in companies, outside of the sessions on working capital. In those sessions, cash was introduced as a lubricant for businesses, necessary for day-to-day operations. Thus, a retail store that had scores of cash customers, it was argued, needed to hold more cash, often in the form of currency, to meet its transactional needs, than a company with corporate suppliers and business customers, with predictable patterns in operations. In fact, there were rules of thumb that were developed on how much cash a company needed to have for its operations. As the world shifts away from cash to digital and online payments, this need for cash has decreased, but clearly not disappeared. The one carve out is the financial services sector, where the nature of the business (banking, trading, brokerage) requires companies in the sector to hold cash and marketable securities as part of their operating businesses.

    If the only reason for holding cash was to cover operating needs, there would be no way to justify the tens of billions of dollars that many companies hold; Apple alone has often had cash balances that exceeded $200 billion, and the other tech giants are not far behind. For some companies, at least, the rationale for holding far more cash than justified by their operating needs is that it can operate as a shock absorber, something that they can fall back on during periods of crisis or to cover unexpected expenses. That is the reason that cyclical and commodity firms have often offered for holding large cash balances (as a percent of their overall firm value), since a recession or a commodity price downturn can quickly turn profits to losses.

   Using the corporate life cycle structure can also provide insight into how the motives for holding cash can change as a company ages.  

For start-ups, that are either pre-revenue or have very low revenues, cash is needed to keep the business operating, since employees have to be paid and expenses covered. Young firms that are money-losing and with large negative cash flows, hold cash to cover future cash flow needs and to fend off the risk of failure. In effect, these firms are using cash as life preservers, where they can make it through periods where external capital (venture capital, in particular) dries up, without having to sell their growth potential at bargain basement prices. As firms start to make money, and enter high growth, cash has use as a business scalar, for firms that want to scale up quickly. In mature growth, cash acquires optionality, useful in allowing the business to find new markets for its products or product extensions.  Mature firms sometimes hold cash as youth serum, hoping that  it can be used to make once-in-a-lifetime investments that may take them back to their growth days, and for declining firms, cash becomes a liquidation manager, allowing for the orderly repayment of debt and sale of assets.

    There is a final rationale for holding cash that is rooted in corporate governance and the control and power that comes from holding cash. I have long argued that absent pressure from shareholders, managers at most publicly traded firms would choose to return very little of the cash that they generate, since that cash balance not only makes them more sought after (by bankers and consultants who are endlessly inventive about uses that the cash can be put to) but also gives them the power to build corporate empires and create personal legacies.

Corporate Cash Holdings

    Given the multitude of reasons for holding cash, it should come as no surprise that publicly traded companies around the world have significant cash balances. Leading into July 2025, for instance, global non-financial-service firms held almost $11.4 trillion in cash and marketable securities; financial service firms held even more in cash and marketable securities, but those holdings, as we noted earlier, can represent their business needs. Using our earlier breakdown of the asset side of the balance sheet into cash, non-operating and operating assets, this is what non-financial service firms in the aggregate looked like in book value terms (global and just US firms):


Note that cash is about 11% of the book value of total assets, in the aggregate, for global firms, and about 9% of the book value of total assets, for US firms. Global firms do hold a higher percentage of their value in non-operating assets, but US firms are more active on the acquisition front, explaining why goodwill (which is triggered almost entirely by acquisitions) is greater at US firms.

    The typical publicly traded firm holds a large cash balance, but there are significant differences in cash holdings, by sector. In the table below, I look at cash as a percent of total assets, a book value measure, as well as cash as a percent of firm value, computed by aggregating market values:


As you can see, technology firms, which presumably face more uncertainty about their future hold far more cash as a percent of book value, but the value that the market attaches to their growth brings down cash as a percent of firm value. Utilities, regulated and often stable businesses, tend to hold the least cash, 
both in book and market terms. 

    Breaking down the sample by region, I look at cash holdings, as a percent of total assets and firms, across the globe:


The differences across the globe can be explained by a mix of market access, with countries in parts of the world where it can be difficult to access capital (Latin America, Eastern Europe, Africa) holding more cash. In addition, and corporate governance, with cash holdings being greater in parts of the world (China, Russia) where shareholders have less power over managers. 

    Given the earlier discussion of how the motives for holding cash can vary across the life cycle, I broke the sample down by age decile, with age measured from the year of founding, and looked at cash holdings, by decile:


The results are mixed, with cash holdings as a percent of total assets being higher for the younger half of the sample (the top five deciles) than for the older half, but the is no discernible pattern, when cash is measured as a percent of firm value (market). Put simple, companies across the life cycle hold cash, though with different motives, with the youngest firms holding on to cash as lifesavers (and for survival) and the older firms keeping cash in the hopes that they can use it to rediscover their youth.

The Magic of Bitcoin

    I have been teaching and working with investments now for four decades, and there has been no investment that has received as much attention from both investors and the financial press, relative to its actual value, as has bitcoin. Some of the draw has come from its connections to the digital age, but much of it has come from its rapid rise in price that has made many rich, with intermittent collapses that have made just as many poor. I am a novice when it comes to crypto, and while I have been open about the fact that it is not my investment preference, I understand its draw, especially for younger investors.

The Short, Eventful History of Bitcoin

    The origin story for Bitcoin matters since it helps us understand both its appeal and its structure. It was born in November 2008, two months into one of the worst financial crises of the last century, with banks and governments viewed as largely responsible for the mess. Not surprisingly, Bitcoin was built on the presumption that you cannot trust these institutions, and its biggest innovation was the blockchain, designed as a way of crowd-checking transactions and preserving transaction integrity. I have long described Bitcoin as a currency designed by the paranoid for the paranoid, and I have never meant that as a critique, since in the  untrustworthy world that we live in, paranoia is a justifiable posture.

    From its humble beginnings, where only a few (mostly tech geeks) were aware of its existence, Bitcoin has accumulated evangelists, who argue that it is the currency of the future, and speculators who have used its wild price swings to make and lose tens of millions of dollars. In the chart below, I look at the price of bitcoin over the last decade, as its price has increased from less than $400 in September 2014 to more than $110,000 in June 2025:

Along the way, Bitcoin has also found some acceptance as a currency, first for illegal activities (drugs on the Silk Road) and then as the currency for countries with failed fiat currencies (like El Salvador), but even Bitcoin advocates will agree that its use in transactions (as the medium of exchange) has not kept pace with its growth as a speculative trade. 

Pricing Bitcoin

    In a post in 2017,  I divided investments into four groups - assets that generate cash flows (stocks, bonds, private businesses), commodities that can be used to produce other goods  (oil, iron ore etc), currencies that act as mediums of exchange and stores of value and collectibles that are priced based on demand and supply:


You may disagree with my categorization, and there are shades of gray, where an investment can be in more than one grouping. Gold, for instance, is both a collectible of long standing and a commodity that has specific uses, but the former dominates the latter, when it comes to pricing. In the same vein, crypto has a diverse array of players, with a few meeting the asset test and some (like ethereum) having commodity features. The contrast between the different investment classes also allows for a contrast between investing, where you buy (sell) an investment if it is under (over) valued, and trading, where you buy (sell) an investment if you expect its price to go up (down). The former is a choice, though not a requirement, with an asset (stocks, bonds or private businesses), though there may be others who still trade that asset. With currencies and collectibles, you can only trade, making judgments on price direction, which, in turn, requires assessments of mood and momentum, rather than fundamentals. 
    With bitcoin, this classification allows us to cut through the many distractions that pop up during discussions of its pricing level, since it can be framed either as a currency or a collectible, and thus only priced, not valued. Seventeen years into its existence, Bitcoin has struggled on the currency front, and while there are pockets where it has gained acceptance, its design makes it inefficient and its volatility has impeded its adoption as a medium of exchange. As a collectible, Bitcoin starts with the advantage of scarcity, restricted as it is to 21 million units, but it has not quite measured up, at least so far, when it comes to holding its value (or increasing it) when financial assets are in meltdown mode. In every crisis since 2008, Bitcoin has behaved more like risky stock, falling far more than the average stock, when stocks are down, and rising more, when they recover. I noted this in my posts looking at the performance of investments in both the first quarter of 2020, when COVID laid waste to markets, and in 2022, when inflation ravaged stock and bond markets. That said, it is still early in its life, and it is entirely possible that it may change its behavior as it matures and draws in a wider investor base. The bottom line is that discussions of whether Bitcoin is cheap or expensive are often pointless and sometimes frustrating, since it depends almost entirely on your perspective on how the demand for Bitcoin will shift over time. If you believe that its appeal will fade, and that it will be displaced by other collectibles, perhaps even in the crypto space, you will be in the short selling camp. If you are convinced that its appeal will not just endure but also reach fresh segments of the market, you are on solid ground in assuming that its price will continue to rise. It behooves both groups to admit that neither has a monopoly on the truth, and this is a disagreement about trading and not an argument about fundamentals.

The MicroStrategy Story

    It is undeniable that one company, MicroStrategy, has done more to advance the corporate holding of Bitcoin than any other, and that has come from four factors;

  1. A stock market winner: The company's stock price has surged over the last decade, making it one of the best performing stocks on the US exchanges:
     It is worth noting that almost all of the outperformance has occurred in this decade, with the winnings concentrated into the last two years. 
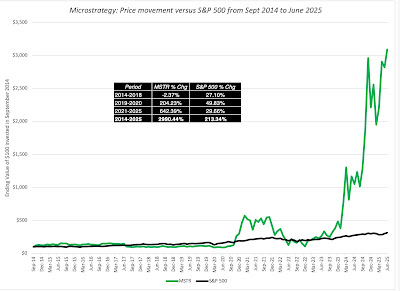
  2. With the rise (increasingly) tied to Bitcoin: Almost all of MicroStrategy’s outperformance has come from its holdings of bitcoin, and not come from improvements in business operations. That comes through in the graph below, where I look at the prices of MicroStrategy and Bitcoin since 2014:

     
     Note that MicroStrategy’s stock price has gone from being slightly negatively correlated with Bitcoin’s price between 2014-2018 to tracking Bitcoin in more recent years.
  3. And disconnected from operationsIn 2014, MicroStrategy was viewed and priced as a software/services tech company, albeit a small one with promise. In the last decade, its operating numbers have stagnated, with both revenues and gross profits declining, but during the same period, its enterprise value has soared from $1 billion in 2014 to more than more than $100 billion in July 2025:

    It is clear now that anyone investing in MicroStrategy at its current market cap (>$100 billion) is making a bitcoin play.
  4. With a high-profile "bitcoin evangelist" as CEO:  MicroStrategy’s CEO, Michael Saylor, has been a vocal and highly visible promoter of bitcoin, and has converted many of his shareholders into fellow-evangelists and convinced at least some of them that he is prescient in detecting price movements. In recent years, he has been public in his plans to issue increasing amounts of stock and using the proceeds to buy more bitcoin.
In sum, MicroStrategy is now less a software company and more a Bitcoin SPAC or closed-end fund, where investors are trusting Saylor to make the right trading judgments on when to buy (and sell) bitcoin, and hoping to benefit from the profits. 

The “Put your cash in bitcoin” movement

     For investors in other publicly traded companies that have struggled delivering value in their operating businesses, MicroStrategy’s success with its bitcoin holdings seems to indicate a lost opportunity, and one that can be remedied by jumping on the bandwagon now. In recent months, even high profile companies, like Microsoft, have seen shareholder proposals pushing them to abandon their conventional practice of holding cash in liquid and close-to-riskless investments and buying Bitcoin instead. Microsoft’s shareholders soundly rejected the proposal, and I will start by arguing that they were right, and that for most companies, investing cash in bitcoin does not make sense, but in the second part, I will carve out the exceptions to this rule.

The General Principle: No to Bitcoin

    As a general rule, I think it is not only a bad idea for most companies to invest their cash in bitcoin, but I would go further and also argue that they should banned from doing so. Let me hasten to add that I would make this assertion even if I was bullish on Bitcoin, and my argument would apply just as strongly to companies considering moving their cash into gold, Picassos or sports franchises, for five reasons:

  1. Bitcoin does not meet the cash motives: Earlier in this post, I noted the reasons why a company  holds cash, and, in particular, as a shock absorber, steadying a firm through bad times. Replacing low-volatility cash with high-volatility bitcoin would undercut this objective, analogous to replacing your shock absorbers with pogo sticks. In fact, given the history of moving with stock prices, the value of bitcoin on a company's balance sheet will dip at exactly the times where you would need it most for stability. The argument that bitcoin would have made a lot higher returns for companies than holding cash is a non-starter, since companies should hold cash for safety.
  2. Bitcoin can step on your operating business narrative: I have long argued that successful businesses are built around narratives that incorporate their competitive advantages. When companies that are in good businesses put their cash in bitcoin, they risk muddying the waters on two fronts. First, it creates confusion about why a company with a solid business narrative from which it can derive value would seek to make money on a side game. Second, the ebbs and flows of bitcoin can affect financial statements, making it more difficult to connect operating results to story lines. 
  3. Managers as traders? When companies are given the license to move their cash into bitcoin or other non-operating investments, you are trusting managers to get the timing right, in terms of when to buy and sell these investments. That trust is misplaced, since top managers (CEOs and CFOs) are for the most part terrible traders, often buying at the market highs and selling at lows.
  4. Leave it to shareholders: Even if you are unconvinced by the first three reasons, and you are a bitcoin advocate or enthusiast, you will be better served pushing companies that you are a shareholder in, to return their cash to you, to invest in bitcoin, gold or any other investment at your chosen time. Put simply, if you believe that Bitcoin is the place to put your money, why would you trust corporate managers to do it for you?
  5. License for abuse: I am a skeptic when it comes to corporate governance, believing that managerial interests are often at odds with what's good for shareholders. Giving managers the permission to trade crypto tokens, bitcoin or other collectibles can open the door for self dealing and worse. 
While I am a fan of letting shareholders determine the limits on what managers can or cannot do, I believe that the SEC (and other stock market regulators around the world) may need to become more explicit in their rules on what companies can (and cannot) do with cash.

The Carveouts

    I do believe that there are cases when you, as a shareholder, may be at peace with the company not only investing cash in bitcoin, but doing so actively and aggressively. Here are four of my carveouts to the general rule on bitcoin:

  1. The Bitcoin Savant: In my earlier description of MicroStrategy, I argued that shareholders in MicroStrategy have not only gained immensely from its bitcoin holdings, but also trust Michael Saylor to trade bitcoin for them. In short, the perception, rightly or wrongly, is that Saylor is a bitcoin savant, understanding the mood and momentum swings better than the rest of us. Generalizing, if a company has a leader (usually a CEO or CFO) who is viewed as someone who is good at gauging bitcoin price direction, it is possible that shareholders in the company may be willing to grant him or her the license to trade bitcoin on their behalf.  This is, of course, not unique to bitcoin, and you can argue that investors in Berkshire Hathaway have paid a premium for its stock, and allowed it leeway to hold and deploy immense amounts of cash because they trusted Warren Buffett to make the right investment judgments. 
  2. The Bitcoin Business: For some companies, holding bitcoin may be part and parcel of their business operations, less a substitute for cash and more akin to inventory. PayPal and Coinbase, both of which hold large amounts of bitcoin, would fall into this carveout, since both companies have business that requires that holding.
  3. The Bitcoin Escape Artist: As some of you may be aware, I noted that Mercado Libre, a Latin American online retail firm, is on my buy list, and it is a company with a fairly substantial bitcoin holding. While part of that holding may relate to the operating needs of their fintech business, it is worth noting that Mercado Libre is an Argentine company, and the Argentine peso has been a perilous currency to hold on to, making bitcoin a viable option for cash holdings. Generalizing, companies in countries with failed currencies may conclude that holding their cash in bitcoin is less risky than holding it in the fiat currencies of the locations they operate in.
  4. The Bitcoin Meme: There is a final grouping of companies that I would put in the meme stock category, with AMC and Gamestop heading that list. These companies have operating business models that have broken down or have declining value, but they have become, by design or through accident, trading plays, where the price bears no resemblance to operating fundamentals and is instead driven by mood and momentum. If that is the case, it may make sense for these companies to throw in the towel on operating businesses entirely and instead make themselves even more into trading vehicles by moving into bitcoin, with the increased volatility adding to their "meme" allure.

Even with these exceptions, though, I think that you need guardrails before signing off on opening the door to letting companies hold bitcoin.

  1. Shareholder buy-in: If you are a publicly traded company considering investing some or much of the company's cash in bitcoin, it behooves you to get shareholder approval for that move, since it is shareholder cash that is being deployed. 
  2. Transparency about Bitcoin transactions/holdings: Once a company invests in bitcoin, it is imperative that there be full and clear disclosure not only on those holdings but also on trading (buying and selling) that occurs. After all, if it is a company's claim that it can time its bitcoin trades better than the average investor, it should reveal the prices at which it bought and sold its bitcoin. 
  3. Clear mark-to-market rules: If a company invests its cash in bitcoin, I will assume that the value of that bitcoin will be volatile, and accounting rules have to clearly specify how that bitcoin gets marked to market, and where the profits and losses from that marking to market will show up in the financial statements. 
As bitcoin prices rise to all time highs, there is the danger that regulators and rule-writers will be lax in their rule-writing, opening the door to corporate scandals in the future.

Cui Bono?

    Bitcoin advocates have been aggressively pushing both institutional investors and companies to include Bitcoin in their investment choices, and it is true that at least first sight, they will benefit from that inclusion. Expanding the demand for bitcoin, an investment with a fixed supply, will drive the price upwards, and existing bitcoin holders will benefit. In fact, much of the rise of bitcoin since the Trump election in November 2024 can be attributed to the perception that this administration will ease the way for companies and investors to join in the crypto bonanza.

    For bitcoin holders, increasing institutional and corporate buy-in to bitcoin may seem like an unmixed blessing, but there will be costs that, in the long run, may lead at least some of them to regret this push:

  1. Different investor base: Drawing in institutional investors and companies into the bitcoin market will not only change its characteristics, but put traders who may know how to play the market now at a disadvantage, as it shifts dynamics.
  2. Here today, gone tomorrow? Bitcoin may be in vogue now, but what will the consequences be if it halves in price over the next six months? Institutions and companies are notoriously ”sheep like” in their behavior, and what is in vogue today may be abandoned tomorrow. If you believe that bitcoin is volatile now, adding these investors to the mix will put that volatility on steroids.
  3. Change asset characteristics: Every investment class that has been securitized and brought into institutional investing has started behaving like a financial asset, moving more with stocks and bonds than it has historically. This happened with real estate in the 1980s and 1990s, with mortgage backed securities and other tradable versions of real estate, making it far more correlated with stock and bonds, and less of a stand alone asset. 
If the end game for bitcoin is to make it millennial gold, an alternative or worthy add-on to financial assets, the better course would be steer away from establishment buy-in and build it up with an alternative investor base, driven by different forces and motives than stock and bond markets. 

YouTube Video

Wednesday, March 5, 2025

Data Update 9 for 2025: Dividends and Buybacks - Inertia and Me-tooism!

In my ninth (and last) data post for 2025, I look at cash returned by businesses across the world, looking at both the magnitude and the form of that return. I start with a framework for thinking about how much cash a business can return to its owners, and then argue that, in the real world, this decision is skewed by inertia and me-tooism. I also look at a clear and discernible shift away from dividends to stock buybacks, especially in the US, and examine both good and bad reasons for this shift. After reporting on the total cash returned during the year, by public companies, in the form of dividends and buybacks, I scale the cash returned to earnings (payout ratios) and to market cap (yield) and present the cross sectional distribution of both statistics across global companies.

The Cash Return Decision
    The decision of whether to return cash, and how much to return, should, at least in principle, be the simplest of the three corporate finance decisions, since it does not involve the estimation uncertainties that go with investment decisions and the angst of trading of tax benefits against default risk implicit in financing decisions. In practice, though, there is probably more dysfunctionality in the cash return decision, than the other two, partly driven by deeply held, and often misguided views, of what returning cash to shareholders does or does not do to a business, and partly by the psychology that returning cash to shareholders is an admission that a company's growth days are numbered. In this section, I will start with a utopian vision, where I examine how cash return decisions should play out in a business and follow up with the reality, where bad dividend/cash return decisions can drive a business over a cliff. 

The Utopian Version
    If, as I asserted in an earlier post, equity investors have a claim the cash flows left over after all needs (from taxes to debt payments to reinvestment needs) are met, dividends should represent the end effect of all of those choices. In fact, in the utopian world where dividends are residual cash flows, here is the sequence you should expect to see at businesses:

In a residual dividend version of the world, companies will start with their cash flows from operations, supplement them with the debt that they think is right for them, invest that cash in good projects and the cash that is left over after all these needs have been met is available for cash return. Some of that cash will be held back in the company as a cash balance, but the balance can be returned either as dividends or in buybacks. If companies following this sequence to determine, here are the implications:
  • The cash returned should not only vary from year to year, with more (less) cash available for return in good (bad) years), but also across firms, as firms that struggle on profitability or have large reinvestment needs might find that not only do they not have any cash to return, but that they might have to raise fresh capital from equity investors to keep going. 
  • It also follows that the investment, financing, and dividend decisions, at most firms, are interconnected, since for any given set of investments, borrowing more money will free up more cash flows to return to shareholders, and for any given financing, investing more back into the business will leave less in returnable cash flows. 
    Seen through this structure, you can compute potential dividends simply by looking for each of the cash flow elements along the way, starting with an add back of depreciation and non-cash charges to net income, and then netting out investment needs (capital expenditures, working capital, acquisitions) as well as cash flow from debt (new debt) and to debt (principal repayments). 

While this measure of potential dividend has a fanciful name (free cash flow to equity), it is not only just a measure of cash left in the till at the end of the year, after all cash needs have been met, but one that is easy to compute, since every items on the list above should be in the statement of cash flows.
    As with almost every other aspect of corporate finance, a company's capacity to return cash, i.e., pay potential dividends will vary as it moves through the corporate life cycle, and the graph below traces the path:

There are no surprises here, but it does illustrate how a business transitions from being a young company with negative free cash flows to equity (and thus dependent on equity issuances) to stay alive to one that has the capacity to start returning cash as it moves through the growth cycle before becoming a cash cow in maturity.

The Dysfunctional Version
    In practice, though, there is no other aspect of corporate finance that is more dysfunctional than the cash return or dividend decision, partly because the latter (dividends) has acquired characteristics that get in the way of adopting a rational policy. In the early years of equity markets, in the late 1800s,  companies wooed investors who were used to investing in bonds with fixed coupons, by promising them predictable dividends as an alternative to the coupons. That practice has become embedded into companies, and dividends continue to be sticky, as can be seen by the number of companies that do not change dividends each year in the graph below:

While this graph is only of US companies, companies around the world have adopted variants of this sticky dividend policy, with the stickiness in absolute dividends (per share) in much of the world, and in payout ratios in Latin America. Put simply, at most companies, dividends this year will be equal to dividends last year, and if there is a change, it is more likely to be an increase than a decrease.
    This stickiness in dividends has created several consequences for firms. First, firms are cautious in initiating dividends, doing so only when they feel secure in their capacity to keep generate earnings. Second, since the punishment for deviating from stickiness is far worse, when you cut dividends, far more firms increase dividends than decrease them. Finally, there are companies that start paying sizable dividends, find their businesses deteriorate under them and cannot bring themselves to cut dividends. For these firms, dividends become the driving force, determining financing and investment decisions, rather than being determined by them.
This is, of course, dangerous to firm health, but given a choice between the pain of announcing a dividend suspension (or cut) and being punished by the market and covering up operating problems by continuing to pay dividends, many managers choose the latter, laying th e pathway to dividend madness.

Dividends versus Buybacks

     As for the choice of how to return that cash, i.e., whether to pay dividends or buy back stock, the basics are simple. Both actions (dividends and buybacks) have exactly the same effect on a company’s business picture, reducing the cash held by the business and the equity (book and market) in the business. It is true that the investors who receive these cash flows may face different tax consequences and that while neither action can create value, buybacks have the potential to transfer wealth from one group of shareholders (either the ones that sell back or the ones who hold on) to the other, if the buyback price is set too low or too high.    

    It is undeniable that companies, especially in the United States, have shifted away from a policy of returning cash almost entirely in dividends until the early 1980s to one where the bulk of the cash is returned in buybacks. In the chart below, I show this shift by looking at the aggregated dividends and buybacks across S&P 500 companies from the mid-1980s to 2024:


While there are a number of reasons that you can point to for this shift, including tax benefits to investors, the rise of management options and shifting tastes among institutional investors, the primary reason, in my view, is that sticky dividends have outlived their usefulness, in a business age, where fewer and fewer companies feel secure about their earning power. Buybacks, in effect, are flexible dividends, since companies, when faced with headwinds, quickly reduce or cancel buybacks, while continuing to pay dividends: In the table below, I look at the differences between dividends and buybacks:

If earnings variability and unpredictability explains the shifting away from dividends, it stands to reason that this will not just be a US phenomenon, and that you will see buybacks increase across the world. In the next section, we will see if this is happening.

    There are so many misconceptions about buybacks that I did write a piece that looks in detail at those reasons. I do want to reemphasize one of the delusions that both buyback supporters and opponents use, i.e., that buybacks create or destroy value. Thus, buyback supporters argue that a company that is buying back its own shares at a price lower than its underlying value, is effectively taking an investment with a positive net present value, and is thus creating value. That is not true, since that action just transfers value from shareholders who sell back (at the too low a price) to the shareholders who hold on to their shares. Similarly, buyback opponents note that many companies buy back their shares, when their stock prices hit new highs, and thus risk paying too high a price, relative to value, thus destroying value. This too is false, since paying too much for shares also is a wealth transfer, this time from those who remain shareholders in the firm to those who sell back their shares. 

Cash Return in 2024

    Given the push and pull between dividends as a residual cash flow, and the dysfunctional factors that cause companies to deviate from this end game, it is worth examining how much companies did return to their shareholders in 2024, across sectors and regions, to see which forces wins out.

Cash Return in 2024

    Let's start with the headline numbers. In 2024, companies across the globe returned $4.09 trillion in cash to their shareholders, with $2.56 trillion in dividends and $1.53 trillion taking the form of stock buybacks. If you are wondering how the market can withstand this much cash being withdrawn, it is worth emphasizing an obvious, but oft overlooked fact, which is that the bulk of this cash found its way back into the market, albeit into other companies. In fact, a healthy market is built on cash being returned by some businesses (older, lower growth) and being plowed back into growth businesses that need that capital.

    That lead in should be considered when you look at cash returned by companies, broken down by sector, in the table below, with the numbers reported both in US dollars and scaled to the earnings at these companies:

To make the assessment, I first classified firms into money making and money losing, and aggregated the dividends and buybacks for each group, within each sector.  Not surprisingly, the bulk of the cash bering returned is from money making firms, but the percentages of firms that are money making does vary widely across sectors. Utilities and financials have the highest percentage of money makers on the list, and financial service firms were the largest dividend payers, paying $620.3 billion in dividends in 2024, followed by energy ($346.2 billion) and industrial ($305.3 billion). Scaled to net income, dividend payout ratios were highest in the energy sector and technology companies had the lowest payout ratios. Technology companies, with $280.4 billion, led the sectors in buybacks, and almost 58% of the cash returned at money making companies in the sector took that form. 

   Breaking down global companies by region gives us a measure of variation on cash return across the world, both in magnitude and in the type of cash return:


It should come as no surprise that the United States accounted for a large segment (more than $1.5 trillion) of cash returned by all companies, driven partly by a mature economy and partly by a more activist investor base, and that a preponderance of this cash (almost 60%) takes the form of buybacks. Indian companies return the lowest percentage (31.1%) of their earnings as cash to shareholders, with the benign explanation being that they are reinvesting for growth and the not-so-benign reason being poor corporate governance. After all, in publicly traded companies, managers have the discretion to decide how much cash to return to shareholders, and in the absence of shareholder pressure, they, not surprisingly, hold on to cash, even if they do not have no need for it. It is also interesting that buybacks seems to be making inroads in other paths of the world, with even Chinese companies joining the party.

FCFE and Cash Return

    While it is conventional practice to scale dividends to net income, to arrive at payout ratios, we did note, in the earlier section, that you can compute potential dividends from financial statements, Here again, I will start with the headline numbers again. In 2024, companies around the world collectively generated $1.66 trillion in free cash flows to equity:

As you can see in the figure, companies started with net income of $6,324 billion, reinvested $4,582 billion in capital expenditures and debt repayments exceeded debt issuances by $90 billion to arrive at the free cash flow to equity of $1.66 trillion. That said, companies managed to pay out $2,555 billion in dividends and bought back $1,525 billion in stock, a total cash return of almost $4.1 trillion.

    As the aggregate numbers indicate, there are many companies with cash return that does not sync with potential dividends or earnings. In the picture below, we highlight four groups of companies, with the first two focused on dividends, relative to earnings, and the other two structured around cash returned relative to free cash flows to equity, where we look at mismatches.


Let's start with the net income/dividend match up. Across every region of the world, 17.5% of money losing companies continue to pay dividends, just as 31% of money-making companies choose not to pay dividends. Using the free cash flows to equity to divide companies, 38% of companies with positive FCFE choose not to return any cash to their shareholder while 48% of firms with negative FCFE continue to pay dividends. While all of these firms claim to have good reasons for their choices, and I have listed some of them, dividend dysfunction is alive and well in the data.

    I argued earlier in this post that cash return policy varies as companies go through the life cycle, and to see if that holds, we broke down global companies into deciles, based upon corporate age, from youngest to oldest, and looked at the prevalence of dividends and buybacks in each group:

As you can see, a far higher percent of the youngest companies are money-losing and have negative FCFE, and it is thus not surprising that they have the lowest percentage of firms that pay dividends or buy back stock. As companies age, the likelihood of positive earnings and cash flows increases, as does the likelihood of dividend payments and stock buybacks.

Conclusion
    While dividends are often described as residual cash flows, they have evolved over time to take on a more weighty meaning, and many companies have adopted dividend policies that are at odds with their capacity to return cash. There are two forces that feed this dividend dysfunction. The first is inertia, where once a company initiates a dividend policy, it is reluctant to back away from it, even though circumstances change. The second is me-tooism, where companies adopt cash return policies to match  their peer groups, paying dividends because other companies are also paying dividends, or buying back stock for the same reasons. These factors explain so much of what we see in companies and markets, but they are particularly effective in explaining the current cash return policies of companies.

YouTube


Data Links
  1. Dividend fundamentals, by industry (US, Global, Emerging Markets, Europe, Japan, India, China)
  2. Cash return and FCFE, by industry (USGlobalEmerging MarketsEuropeJapanIndiaChina)

Friday, February 8, 2019

January 2019 Data Update 8: Dividends and Buybacks - Fact and Fiction

In my series of data posts, I had always planned to get to dividends and buybacks, the two mechanisms that companies have for returning cash to stockholders, at this point, but an op ed on buybacks by Senators Schumer and Sanders this week, in the New York Times, will undoubtedly make this post seem reactive. The senators argue that the hundreds of billions of dollars that US companies have expended buying back their own shares could have been put to better use, if it had been reinvested back in their businesses or used to increase wages for their employees, and offer a preview of legislation that they plan to introduce to counter the menace. Like the senators, I am concerned about the declining manufacturing base and income inequality in the US, but I believe that their legislative proposal is built on premises that are at war with the data, and has the potential for making things worse, not better.


The Buyback Effect: Benign Phenomenon, Managerial Short-termism or Corporate Malignancy?
'The very mention of buybacks often creates heated debate, because people seem to have very different views on its causes and consequences. All too often, at the end of debate, each side walks away with its views of buybacks intact, completely unpersuaded by the arguments of the other. The reason, I believe is that our views on buybacks are a function of how we think companies act, what the motives of managers are and what it is that investors price into stocks.

a. Buybacks are benign
If companies are run sensibly, the cash that they return to shareholders should reflect a residual cash flow, making the cash return decision, in terms of sequence, the final step in the process. 

If companies follow this process, buybacks are just another way of returning cash to stockholders, benign in their impact, because they are not coming at the expense of good investments, at least with good defined as investments that generate more than their hurdle rates. In fact, putting restrictions on how much cash companies can return, can harm not only stockholders (by depriving them of their claim on residual  cash flows) but also the economy, because capital will now be tied up in businesses that don't need them, rather than find its way to good ones.

b. Buybacks are short term
The benign view of stock buybacks is built on the presumption that managers make decisions at publicly traded companies with an eye on maximizing value, and since value is a function of expected cash flows over the life of the company, that they have a long term perspective. That view is at odds with evidence that managers often put short term gains ahead of long term value, and if investors are also short term, in pricing stocks, you can get a different picture of what drives buybacks and the consequences:

In effect, managers buy back stock, often with borrowed money, because it reduces share count and increases earnings per shares, and markets reward the company with a higher stock price, because investors don't consider the impact of lost growth and/or the risk of more debt. The argument that buybacks are driven by short term interests is strengthened if management compensation takes the form of equity in the company (options or restricted stock), because managers will be personally rewarded then for buybacks that, while damaging to the company's value (which reflects the long term), push up stock prices in the short term. With this view of the world, buybacks can create damage, especially at companies with good long term projects, run by managers who feel the need to meet short term earnings per share targets.

c. Buybacks are malignant
There is a third view of buybacks, where buybacks are not just motivated by the desire to push up earnings per share and stock prices, but become the central purpose of the firm. With this view, companies try to do whatever they can to generate more cash for buybacks, including crimping on worker wages, turning away good investments and borrowing more, even if that borrowing can put their survival at risk.

This picture captures almost all of the arguments that detractors of buybacks have used, including the ones that Senators Schumer and Sanders present in their article. If buybacks are the drivers of all other corporate actions, instead of being a residual cash flow, the “buyback binge” can be held responsible for a trifecta of America's most pressing economic problems: stagnant wages for workers, the drop in capital expenditures at US companies and the rise in debt on balance sheets. If this buyback shift is being driven by activist shareholders and a subset of "short term" institutional investors, as many argue that it is, you have a populist dream cast of good (workers, small stockholders, consumers) and evil (activists, wealthy shareholders and bankers). If you buy into this description of corporate and investor behavior, and it is not an implausible picture, it stands to reason that restricting or even stopping companies from buying back stock should alleviate and even solve the resulting problems. 

Picking a perspective
The reason debates about buybacks very quickly bog down is because proponents not only come in very different perspectives of corporate behavior, but they use anecdotal evidence, where they point to a specific company that behaves in a way that backs their perspective, and say "I told you so". The truth is that the real world is a messy place, with some companies buying back stocks for the right reasons (i.e., because they have no good investments and their stockholders prefer cash returns in this form), some companies buying back stock for short term price gains (to take advantage of markets which are myopic) and some companies focusing on buying back stock at the expense of their employees, lenders and own long term interests. 


Moneyball with Buybacks

The question of which side of this debate you will come down on, will depend on which of the perspectives outlined above comes closest to describing how companies and markets actually behave. Since that is an empirical question, not a political, idealogical or a theoretical one, I think it makes sense to look at the numbers on dividends and buybacks, not just in the US, but across the world, and I will do so with a series of data-driven statements.


1. More companies are buying back stock, and more cash is being returned in buybacks

Are US companies returning more and more cash in the form of buybacks? Yes, they are, and it represents a trend that saw its beginnings, not ten years ago, but in the 1980s. In the graph below, I look at the aggregate dividends and buybacks from firms in the S&P 500 since 1986, and also report on the percentage of cash returned that takes the form of buybacks, each year:

Starting at a base in the early 1980s, where buybacks were uncommon and dividends represented almost all cash return, you can see buybacks climb through the 1980s and 1990s, both in dollar value terms and as a percentage of overall cash return. That trend has only accelerated in this century, with the 2008 crisis putting a brief crimp on it. In 2018, more than 60% of the cash returned by S&P 500 companies was in the form of buybacks, amounting to almost $700 billion.

2. Cash Returns are rising as a percent of earnings, and it looks like companies are reinvesting less back into their own businesses
If you look at the graph above, you can see that the rise in buybacks has been accompanied by a stagnation in dividends, with growth rates in dividends substantially falling short of growth in buybacks. This shift has had consequences for two widely used measures of cash return, dividend yield, which looks at dividends as a percent of market capitalization or stock prices and the dividend payout ratio, a measure of the proportion of earnings as dividends. The declining role of dividends, as a form of cash return, has meant that a more relevant measure of cash return has to incorporate stock buybacks, resulting in a broader definition of cash yield and cash payout ratio measures:
  • Cash Yield = (Dividends + Buybacks) / Market Capitalization
  • Cash Payout Ratio = (Dividends + Buybacks)/ Net Income
The push back that you will get from dividend devotees that while dividends go to all shareholders, buybacks put cash only in the pockets of those stockholder who sell back, but that argument ignores the reality that the it is still shareholders who are getting the cash from buybacks. (As a thought experiment, imaging that you own all of the shares in a company and consider whether you notice a difference between dividends and buybacks, other than for tax purposes.) Calculating both dividend and cash measures of yield and payout over time, we observe the following for the companies in the S&P 500:
S&P 500: Dividends, Buybacks, Mkt Cap and Net Income
This table reinforces the message from the previous graph, which is that both dividends and buybacks have to be considered in any assessment of cash return. That is why I think that the handwringing over how low dividend yields have become over the last two decades misses the point. The cash yield for US companies, which includes both dividends and buybacks, is much more indicative of what companies are returning to shareholders and that  number has remained relatively stable over time. Using the same logic that I used to argue that cash yields were better indicators of cash returned to shareholders than dividend yields, I computed cash payout ratios, by adding buybacks to dividends, before dividing by net income in the table in the last section, and it does show a disquieting pattern. In fundamental analysis, analysts give weight to the payout ratio and its twin measure, the retention ratio (1- payout ratio) as a measure of how much a company is reinvesting into its own business, in order to grow.  The cash returned to shareholders exceeded net income in 2015 and 2016, and remains high, at 92.12% of net income, and that statistic seems to support the proposition that US companies are reinvesting less.

3. The drop in reinvestment may be real, but it could also be a reflection of accounting inconsistencies and failure to see the full picture on cash return
It is true that companies are returning more of their net income, as measured by accountants, to stockholders in dividends and buybacks, with the latter accounting for the lion's share of the return. Before we conclude that this is proof that companies are reinvesting less, there are two flaws in the numbers that need fixing:
  1. Stock Issuances: If we count stock buybacks as returning cash to shareholders, we should also be counting stock issuances as cash being invested by these same shareholders. Thus, the more relevant measure of cash return would net out stock issuances from stock buybacks, before adding dividends. While this is a lesser issue with the S&P 500 companies, which tend to be larger and more mature companies, less dependent of stock issuances, it can be a larger one for the entire market, where initial public offerings can augment seasoned equity issues, especially for smaller, higher growth companies.
  2. Accounting Inconsistencies: Over the last few decades, the percentage of S&P 500 companies that are in technology and health care has risen, and that rise has laid bare an accounting inconsistency on capital expenditures. If a key characteristic of capital expenditures is that money spent on them provide benefits for many years, accounting does a reasonable job in categorizing capital expenditures in manufacturing firms, where it takes the form of plant and equipment, but it does a woeful job of doing the same at firms that derive the bulk of their value from intangible assets. In particular, it treats R&D, the primary capital expenditure for technology and health care firms, brand name advertising, a key investment for the long term for consumer product companies, and customer acquisition costs, central for growth in subscriber/user driven companies as operating expenses, depressing earnings and rendering book value meaningless. In effect, companies on the S&P 500 are having their earnings measured using different rules, with the earnings for GM and 3M reflecting the correct recognition that money spent on investments designed to create benefits over many years should not be expensed, but the earnings for Microsoft and Apple being calculated after netting those same types of investments. As with the treatment of leases, I refuse to wait for accountants to come to their senses on this question, and I have been capitalizing R&D for all companies and adjusting their earnings accordingly. 
In the table below, I bring in stock issues and R&D into the picture, looking across all US stocks, not just the S&P 500:
All US publicly traded companies; S&P Capital IQ
While the trend towards buybacks is still visible, bringing in new stock issuances tempers some of the most extreme findings. In 2018, for instance, the net cash return (with issuances netted out from dividends and buybacks) represented about 46% of adjusted net profit (with R&D added back), well below the gross cash return.  In fact, there is no discernible decline in reinvestment over time, barring 2008 and 2009, the years around the last crisis. Capital expenditures have grown slowly, but an increasing percentage of reinvestment, especially in the last 5 years, has taken the form of R&D and acquisitions. 


4. Buybacks cut across sectors, size classes and growth categories, but the biggest cash returners are larger, more mature companies.

Before we decide that buybacks are ravaging the economy and should be restricted or even banned, it is also worth taking a look at what types of companies are buying back the most stock.  Staying with US stocks, I looked at buybacks and dividends of companies, broken  down by industry grouping. The full table is at the end of this post, but based upon the dollar value of buybacks, the ten industries that bought back the least stock and the ten that bought back the most are highlighted below:
Dividends and Buybacks: By Industry for US
It should come as no surprise that the industries where you see buybacks used the least tend to be industries which have a history of large dividend payments, with utilities, metals and mining and real estate making the list. Looking at the industries that are the biggest buyers of their own stock, the list is dominated by companies that derive their value from intangible assets, with technology and pharmaceuticals accounting for seven of the ten top spots. While that may surprise some, since these are viewed as high growth businesses, some of the biggest players in both technology and pharmaceuticals are now middle aged or older, using my corporate life cycle structure.

Given that there are often wide differences in size and growth, within each industry grouping, I also broke companies down by market cap size, to see if smaller companies behave differently than larger ones, when it comes to buybacks:
Market capitalization, as of 12/31/18
It is not surprising that the largest companies account for the bulk of buybacks, but you can also see that they return far more in buybacks, as a percent of their market capitalizations, then smaller firms do. 

Finally, I categorized companies based upon expected growth in the future, to see if companies that expect high growth behave differently from ones that expect low growth.
Expected revenue growth in the next two years
While companies in every growth class have jumped on the buyback bandwagon, the biggest buybacks in absolute and relative terms are for companies that have the lowest expected growth in revenues, returning 4-5% of their market capitalization in buybacks each year. Companies in the highest growth class, in contrast, return only 0.95% of their buybacks. That said, there are companies in higher growth classes that are buying back stock, when they should not be, perhaps for short term pricing reasons, but they represent only a small portion of the market, accounting collectively for only 10.56% of overall market capitalization.

I may be guilty of letting my priors guide my reading of these tables, but as I see it, the buyback boom in the United States is being driven by large non-manufacturing firms, with low growth prospects. If you restrict buybacks, expecting that this to unleash a new era of manufacturing growth and factory jobs, I am afraid that you will be disappointed. The workers at the firms that buy back the most stock, tend to be already among the better paid in the economy, and tying buybacks to higher wages for these workers will not help those who are at the bottom of the pay scale.

5. Investing back into businesses is not always better than returning cash to shareholders, when it comes to jobs, economic growth and prosperity.
Implicit in the Schumer-Sanders proposal to restrict buy backs is the belief that while shareholders may benefit from buybacks, the economy overall will be more prosperous, and workers will be better served, if the cash that is returned to shareholders is invested back in the businesses instead. Incidentally, this seems to be a shared delusion for both ends of the political spectrum, since one of the biggest sales pitches for the tax reform act, passed in 2017, was that the cash trapped overseas by bad US tax law, would, once released, be invested into new factories and manufacturing capacity in the US. I believe that both sides are operating from a false premise, since investing money back into bad businesses can make both economies and workers worse off. In a prior post, I defined a bad business as one where it is difficult to generate a return that is higher than the risk adjusted rate that you need to make to break even on your investment. 
Data Update 6 on excess returns
Using the return on capital, a flawed but still useful measure, as a measure of return and the cost of capital, with all of the caveats about measurement error, I found that approximately 60% of companies, both globally and in the US, earn less than their cost of capital. Forcing these companies to reinvest their earnings, rather than letting them pay it out, will only put more more money into bad businesses and create what I call "walking dead" companies, tying up capital that could be used more productively, if it were paid out to shareholders, who then can find better businesses to invest in. 

6. Some companies may be funding buybacks with debt, but the bulk of buybacks are still funded with equity cash flows
The narrative about stock buybacks that its detractors tell is that US companies have borrowed money and used that debt to fund buybacks, creating, at least in the narrative, sky-high debt ratios and  rising default risk. While there is certainly anecdotal evidence that you can offer for this proposition, there is evidence that we have looked at already that should lead you to question this narrative. Looking across sectors, we noted that the technology and pharmaceutical companies are on the list of biggest buyers of their own stock, and neither group is in the top ten or even twenty, when it comes to debt ratios.

Taking the naysayers at their word, I broke US companies down, based upon their debt loads, using Debt/EBITDA as the measure, from lowest to highest, to see if there is a relationship between buybacks and debt loads:
Debt to EBITDA at the end of 2018
The bulk of the buybacks are coming from firms with low to moderate debt ratios, falling in the second and third quintiles of debt ratios.  It is true that the firms with the highest debt load, buy back the most stock, at least as a percent of their market capitalization. As with the growth data, you can view this as evidence of either short-term thinking or worse, but note that the second and third quintiles together account for 61% of overall market capitalization, suggesting that if buybacks are skewing debt upwards at some firms, it is more at the margins than at the center of the market. 

7. Buybacks are now a global phenomenon
It is true that stock buybacks, at least in the form that you see them today, as cash return to stockholders, had their origins in the United States in the 1980s and it is also true that for a long time after that, much of the rest of the world either stayed with dividends and many countries had severe constraints on the use of buybacks. In the last decade, though, the dam seems to have broken and stock buybacks can now be seen in every part of the world, as can be seen in the table below:

US companies still lead the world in buybacks, but Canadian companies are playing catch up and you are seeing buybacks pick up in Europe. Asia, Eastern Europe and Latin America remain holdouts, though it is unclear how much of the reluctance to buy back stock is due to poor corporate governance. 


The Follow Up

I agree that wage stagnation and an unwillingness to invest into the industrial base are significant problems for US companies, but I think that buybacks are more a symptom of global economic changes, than a cause. In particular, globalization has made it more difficult for companies to generate sustained returns on investments,  and has made earnings more volatile for all businesses.  The lower returns on investments has led to more cash being returned, and the fear of earnings volatility has tilted companies away from dividends, which are viewed as more difficult to back out of, to buybacks. In conjunction, a shift from an Industrial Age economy to the economies of today has meant that our biggest businesses are less capital intensive and more dependent on investments in intangible assets, a trend that accounting has not been able to keep up with.  You can ban or restrict buybacks, but that will not make investment projects more lucrative and earnings more predictable, and it certainly is not going to create a new industrial age.

If you came into this article with a strong bias against buybacks it is unlikely that I will be able to convince you that buybacks are benign, and it is very likely that you will be in favor, like Senators Schumer and Sanders, on restricting not just buybacks, but cash returns (including dividends), in general. Playing devil’s advocate, let’s assume that you succeed and play out what the effects of these restrictions will be on how much companies invest collectively and employee wages.
  • On the investment front, it is true that companies that used to buy back large numbers of their own shares will now have more cash to invest, but in what? It could be in more internal investments or projects, but given that many of these companies were buying back stock because they could not find good projects in the first place, it would have to be in projects that don’t earn a high enough returns to cover their hurdle rates. Perhaps, it will be in acquisitions, and while that will make M&A deal makers happy, the corporate track record is woeful. In either case, you will have more reinvestment in the wrong segments of the economy, at the expense of investments in the segments that need them more.
  • On the wage front, the consequences will be even messier. It is possible that tying buybacks to employee wages, as Senators Schumer and Sanders propose, will cause some companies to raise wages for existing employees, but with what consequences? Since they will now be paying much higher wages than their competitors, my guess is that these same companies will  be quicker to shift to automation and will have smaller workforces in the future, and that those at the low end of the pay scale will be most hurt by this substitution. 
Illustrating my point about anecdotal evidence, the senators use Walmart and Harley Davidson to make their case, arguing that both companies should not have expended the money that they did on buybacks, and taken investments or raised wages instead. 
  • Assuming that Walmart had followed their advice and not bought back stock and invested instead, it is unlikely that Walmart would have opened more stores in the United States, a saturated market, but would have opened them instead in other countries, and I don’t believe that the senators would view more stores being built in Indonesia or India as the outcome they were hoping for. As for Harley Davidson, a company that serves a loyal, but niche market, building another factory may have created more jobs for the moment, but it is not at all clear that the demand exists for the bikes that would roll out.
  • Would Walmart have raised wages, if they had not bought back stock? In a retail landscape, where Amazon lays waste to any competitor with a higher cost structure, that would have been suicidal, and accelerated the flow of customers to Amazon, allowing that company to become even more dominant. In a world where people complain about how the FANG stocks are taking over the world, you would be playing into their hands, by handcuffing their brick and mortar competitors, with buyback legislation.
In short, restricting buybacks may lead to more reinvestment, but much of it will be in bad businesses, acquisitions of existing entities and often in other countries. Tying buybacks to employee wage levels may boost the pay for existing employees, but will lead to fewer new hires, increasing automation and smaller workforces over time. In short, the ills that the Schumer-Sanders bill tries to cure will get worse, as a result of their efforts, rather than better.

Conclusion
I believe that the shift to buybacks reflects fundamental shifts in competition and earnings risk, but I don't wear rose colored glasses, when looking at the phenomenon. There are clearly some firms that are buying back stock, when they clearly should not be, paying out cash that could be better used on paying down debt, especially in the aftermath of the reduction of tax benefits of debt, or taking investments that can generate returns that exceed their hurdle rates. You may consider me naive, but I believe that the market, while it may be fooled for the moment, will catch on and punish these firms. Also, the data suggests that these bad players are more the exception than the rule, and banning all buybacks or writing in restrictions on buybacks for all companies strikes me as overkill, especially since the promised benefits of higher capital investment and wages are likely to be illusory or transitory. If you are tempted to back these restrictions, because you believe they are well intentioned, it is worth remembering that history is full of well intentioned legislation delivering perverse results. 

YouTube Video

Datasets