Showing posts with label Earnings Reports. Show all posts

Wednesday, July 29, 2026

Information Timing and Release: The Gaming of Guidance!

    I am a lapsed academic, insofar as I have not submitted a paper for publication in more than two decades, but to acquire academic status, I did have to earn a PhD in the distant past. My doctoral dissertation, which like most doctoral theses is little noted and long forgotten, was completed in 1984 and focused on how the frequency of and delays in the release of information plays out in stock price volatility, skew and jumps. I don't plan to rehash that paper, but there have been two long running news stories that reminded me of it. The first is a proposal being floated by the Securities Exchange Commission (SEC) to replace quarterly reporting of financial statements by companies with semi-annual reporting. The second is the opinion voiced by Kevin Warsh, the new Fed Chair, that the Fed should provide less guidance to financial markets on future decisions.

    The two stories may seem unconnected, but they have two common features. First, both actions (removing quarterly reporting requirements and reducing/eliminating Fed guidance), if carried through, will remove "news" that markets have become used to receiving and using to calibrate prices.  Second, the arguments for and against each of these proposals have parallels. The advocates for removing quarterly reports argue that they feed into market myopia and increase short-termism in markets, and the supporters of less Fed guidance believe that this guidance creates gaming among traders and investors, increasing focus on the FOMC actions at the expense of fundamentals. The pushback against both proposals comes from those who believe that withholding quarterly reports and Fed guidance removes information that markets use to set prices, making these prices more volatile and less informative. As is almost always the case with these debates, there is both truth and hyperbole on both sides, and I will try to thread the needle.

Earnings Reports

    Most investors and traders in equity markets, and especially so in the United States, have spent their investing lifetimes in an environment where companies not only release full financial statements every quarter, but do so with fan fare. As we will note in this section, that has not always been the case, even in the US, and has more recent origins, with setbacks, in many foreign markets. 

The History of Earnings Reporting Periodicity

   The Securities Exchange Act of 1934, which created the SEC, set up foundational annual reporting requirements (10-Ks) for publicly traded companies, modified in 1955 to require semi-annual reporting and in 1970, quarterly reports, within 45 days from the end of each quarter. That said, there have been forces that have induced firms to report earnings on a more frequent basis to investors well before these regulatory requirements were put in place. The first were the stock exchanges that imposed their own constraints, with the NYSE requiring most firms to report on a quarterly basis as early as 1939. The second was the recognition by firms that financial transparency (in the form of more frequent and more detailed financial reports) could make them more attractive to investors. As a consequence, it is estimated that in 1931, prior to either the SEC or NYSE mandating disclosure, more than 60% of publicly traded companies were already disclosing information on a quarterly basis.

    The shift to more frequent reporting was slower in the rest of the world and has seen more reversals. Europe, for much of the last century, has a patchwork of rules, with some countries adopting stricter disclosure laws than others. The UK imposed mandatory quarterly earnings reporting in 2007, but allowed a shift back to semi-annual reporting in 2014, and the EU also followed a similar timeline, introducing quarterly reports in 2007 and withdrawing that requirement in 2013. In 2003, Singapore started requiring quarterly reporting for firms with market capitalization exceeding S$20 million, but in 2020, shifted away to requiring it only for a subset of firms with financial and regulatory concerns. Japan started its quarterly reporting requirements in 2003 as well, but it too reversed that requirement in 2024.  In emerging markets, there are large variations across countries. In India, publicly traded companies are required to report their financials on a quarterly basis, and the same is true for many Brazilian and Chinese companies. In Africa, Nigeria requires quarterly reporting but South Africa  has a semi-annual reporting mandate, though many companies voluntarily release quarterly financials; much of the rest of Africa has semi-annual reporting requirements. 

    In sum, the belief at the start of the twenty first century that the rest of the world would follow the US model of mandated quarterly reporting for publicly traded companies has not come to fruition, as many parts of the world have experimented with mandatory quarterly reporting, before abandoning it in favor of semi-annual reporting, for a variety of reasons. That said, it is worth noting that a significant percentage of firms voluntarily report their financial results on a quarterly basis, even when not mandated, albeit with different degrees of depth.

The Content of Earnings Reports

    The debate about how frequently companies should report their financials misses a key detail related to what their financial reports include as content. Focusing on the US, for instance, the magnitude of quarterly earnings reports has increased over time, expanding from bare bones financial statements fin the 1970s to much larger documents that go well beyond financial statements today. In 1980, for instance, a typical quarterly earnings report contained 2000-5000 words, but by the turn of this century, those reports had tripled or quadrupled in size, and the trends continue. The graph below, for instance, looks at the growth in word count for the median quarterly and annual reports in the Russell 3000 companies between 2006 and 2020 (for quarterly) and 1994 to 2020 (for annual):

As you can see the number of words in both quarterly and annual reports has increased over time, and the bulking up of earnings reports can be explained by multiple factors:

  1. Accounting rule changes: Accounting rule writers have been busy adding more items to the list of required disclosures for public companies in the last few decades. Some of this increased disclosure (stock-based compensation, for example) reflects a changing business world and is merited, some is in reaction to a corporate scandal and if often knee-jerk and some, in my cynical vie, reflects accounting trying to be relevant to markets again. 
  2. Macro events: In years of market crises, economic or political, you will see disclosures increase. In the graphs above, notice the spikes in 2008/2009 and 2020, the first in response to the 2008 banking crisis and the latter to COVID.  Superimposing the effects of globalization, where a company finds itself exposed to problems in every corner of the world, it has added to the disclosure bloat.
  3. Legal Protection: One of the culprits responsible for disclosures bulk is the risk exposure section, where companies are required lay out an exhaustive (and exhausting) list of things that can go wrong in their business models. I have never found a risk disclosure useful in a valuation, as it seems to be written by lawyers with the objective of providing legal cover.
  4. Guidance: In the 1980s, quarterly earnings reports were focused on reporting on operations during the quarter in question and management was not expected to, and did not provide, guidance about future quarters. That started to change in the 1990s, especially with the passage of the 1995 Safe Harbor Law and Reg FD (which prevented companies from selectively leaking information to analysts), and surged through the second half of the decade, peaking in 2003, when more than 50% of all companies providing earnings guidance. Thankfully, the process has receded, with only a fifth of all firms now providing guidance with earnings reports, but it is undeniable that there is much more forward-looking components to earnings reports than used to be the case.

The bulking up of earnings reports is part of a phenomena that I term "disclosure diarrhea" and argue has undercut the usefulness of these reports, with more disclosure perversely making for less information.

The Earnings Game

    To make sense of the arguments for and against quarterly earnings reporting, you have to get a measure of what happens leading into and out of these reports, in the "earnings game". The process starts with analysts and investors making forecasts of what the earnings report will contain, almost always including estimates of the earnings per share, but often also containing estimates of expected revenues and even operating metrics (like margins) for high profile companies. The analyst forecasts, at least from sell side analysts, become quasi public information and are often aggregated and reported as consensus estimates by financial news services. Zacks, for instance, is one of the services that has been doing this for decades, but that information is now widely accessible on Google and Yahoo! Finance (with the estimates for Apple on July 27, 2026, for the September 2026 earnings report, shown below):

Yahoo! Finance for Apple earnings forecasts

These analyst forecasts, once made, are revisited, partly in response to company-specific news stories and partly to macroeconomic developments, and revised forecasts are provided, with services again tracking these revisions for trends (as you can see below for Apple, from Zack's):

Zack's Apple earnings revisions

As the earnings release date approaches, analysts continue to revise their estimates, and on the date of the announcement, the actual earnings per share is compared to the expected number, with higher (lower) than expected earnings labeled as positive (negative) surprises. The market price response is often consistent, with positive (negative) earnings surprises translating into increases (decreases) in stock price. The graph below, while dated, looks at stock price responses to earnings surprised classified into ten deciles (from most positive to most negative):


There is some evidence that the market responses to earnings reports have become more muted over time, perhaps because of public access to analyst forecasts and revisions. The link between earnings surprises and stock price changes has become the reason why analysts spend as much time as they do, forecasting earnings per share in the next quarterly report, and why traders focusing on the same metric. There is another aspect of the market reaction to earnings surprises that becomes grist for the trading mill, and it comes from the price drifts in the days after earnings are released, with positive (negative) surprises followed by upward (downward) drifts. While the price drift is small, it may still be large enough to make a difference in active trading, where winning by inches is still winning.

    As with almost everything else that is market-related, there are no easy wins in this game, and as more and more people play the earnings forecasting game, new wrinkles have emerged. First, companies have learned to use the flexibility embedded in accounting rules to find ways to beat analyst estimates, with tech companies, in particular, standing out. That earnings gaming plays out as a disproportionately large number of positive earnings surprises (at least among the S&P 500 companies, broken down by sector), as is clear from earnings surprises at the  S&P 500 companies in the second quarter of 2026:

Source: Factset

Second, as companies routinely beat analyst estimates, markets readjust, creating the phenomenon of whispered earnings, where investors build in the expectation that a company that has historically delivered earnings that are 5% or 10% above estimates will continue to do so, and a lesser number is a negative surprise. In the graph below, I look at the market price reaction to earnings surprises in the second quarter of 2026:

Source: Factset

As you can see, the linkage between earnings surprises and price reaction is weak, with a significant subset of positive surprises resulting in price drops. 

The Bottom Line

    Much of the debate about whether the US should shift away from quarterly to semi-annual reports can be boiled down to what you think about the time and energy investors and companies spend playing the earnings game, and where that time and energy will be spent in the absence of quarterly reports. Those who are advocates for less frequent reporting are of the view that the earnings game, focused as it is on next quarter's earnings estimates and whether the company can beat them, contributes to short-termism and distracts from fundamentals. Those who are pushing for preserving the status quo (of quarterly reporting) believe that removing quarterly reports will just shift the game, perhaps more intensively, into the semi-annual reports and that there is value to long term investors from having quarterly reports, gaming notwithstanding. 

    There is another issue that comes up in the context of quarterly reporting, and what would happen if these reports did not exist. Legal strictures notwithstanding, insiders (from within and outside the firm) trade and make money on material information that they have access to, but the public does not. Removing quarterly reporting will create more of an opening for insiders to make money at the expense of public market investors, and while inside trading may contribute to making prices more informative, it also adds to the sense that financial markets are an unfair game.

    I am an investor, and I  think that there is a compromise solution that draws on both sides of this argument. I like quarterly reporting for two reasons. 

  1. There is information in those reports that allows me to update my company valuations, though for many companies, the marginal impact of a quarterly report on value is small. 
  2. While I have no interest in playing the earnings game, the price corrections that happen around earnings reports serve two purposes. For companies that I have a position in, they can operate as catalysts, bringing down (up) the stock price of over valued (under valued) companies. At the same time, almost all of the information that I find useful in an earnings reports is in the financial statements and footnotes, not in the lengthy discussions of risk exposure or in the management guidance, and I would welcome an elimination of these sections and a slimming down of these reports. 

Note that none of my arguments for preserving quarterly reporting are about short-termism, and that is intentional. First, I am not sure what short-termism even means, since the cynical answer seems to be that any market movement away from your preferred price direction is short term, and any movement in your favor is indicative of market wisdom. Second, I believe that most market participants, and this is true across time and markets, trade to make money in the near term, and that there is nothing that regulators or rule writers can do to alter this dynamic. In fact, the magic of markets is that millions of trades motivated by opportunism and the short term can still yield a price that is long term and rational. Finally, it remains true that if we were all long-term investors who traded only when the fundamentals drove us to do so, markets would be less liquid and transactions costs would increase; short term traders provide a market service and supply liquidity that we all (including long term investors) benefit from.

    I hope that the SEC preserves the current quarterly reporting requirement, while scaling back the volume of disclosure, but if it decides otherwise, it will not materially change much of what I do. I will miss the quarterly updates more with younger, higher-growth firms, where the operating metrics (revenues, margins etc.) can change quickly over short periods, but it is my guess that many of these firms will voluntarily continue the quarterly reporting tradition. 

Fed Guidance on Rates

    For most investors who started investing after 2008, the Fed, in particular, and central banks, in general, have loomed large in the investing process. Many investors attribute the low interest rates after 2008 almost entirely to Fed actions, and by extension, blame the Fed for the higher rates since 2022. I have long argued that not only is this perception incorrect, but that it is unhealthy for investors to view the Fed as either savior or villain. 

A Short (and Personal) History of the Fed

    I started in equity markets in the 1980s, when Paul Volcker as the chair of the Fed played a central role in getting inflation back into check. I might have been ignorant, but I did not know the names of any of the members of the Federal Open Market Committee and had no idea when they met. Changes in the fed funds rate, the only rate effectively controlled by the FOMC, would percolate their way into markets, but I don't remember them being central to equity market movements. 

    Volcker was followed by Alan Greenspan, and while he acquired rockstar status (at least  among investors) in the late 1990s, his views on rates were superseded by his views on equity investors (and their irrational exuberance). The FOMC met eight times per year during that period, and you can access the meeting minutes and actions on the Fed website here, but it stayed away from explicit guidance about future rate changes, choosing to send subtle hints instead. 

    The sea change in Fed behavior and centrality occurred with the 2008 market crisis, when the Fed first introduced explicit guidance noting that rates would stay low "for some time", and it has largely continued that practice through the stewardships of Bernanke (2006-2014), Yellen (2014-2020) and Powell (2020-2026). Along the way, its place in markets has changed, as both bond and equity investors have become focused on the Fed as the arbiter of interest rates and director of the economy. 

The Fed's Powers (and Powerlessness)

    To understand the extent and limits of the Fed's capacity to guide rates and the economy, it is useful to begin with an understanding of what it does. Through its twelve districts that span the United States, the Fed collects information on almost every aspect of the economy, from price pressures building on consumers and producers to the pace of economic growth. While there are other government agencies that also track these statistics, it is undeniable that the Fed has a big picture view and access to more data than any other government agency. The Federal Open Market Committee, composed of all of the members of the board of governors and representatives of the district presidents, sets Fed policy on open market operations (where the Fed buys and sells US government securities), the size of the Fed's balance sheet and the Fed Funds rate (an overnight rate at which banks can borrow and lend their reserves). In addition to the FOMC providing policy direction on inflation and the economy, the Fed chair testifies to Congress every six months, facing and answering questions from legislators.

    As the key interest rate set by the Fed, the Fed Funds rate often acquires an outsized role and there are good reasons to pay attention to it. First, it operates as a signal of what the Fed is seeing in the data it has collected on the economy, with an increase (decrease) in rates indicating that it sees higher (lower) inflation and an overheated (slowing) economy. Second, there are interest rates that are directly tied to the Fed Funds rate, where changes percolate down to businesses and customers; the prime rate and some credit card and CD rates move with the Fed Funds rate. That said, I believe that Fed's capacity to affect interest rates is far more limited than most believe, for two reasons. First, while there is positive correlation between Fed Funds rates and short-term market-set rates (like the US treasury bill rate), there is as much evidence (if not more) that the latter lead the former, rather than the other way around. Put simply, Fed funds rates tend to be increased (cut) after short term treasury rates have gone up (down), suggesting that the Fed is mimicking the market. Second, the relationship between Fed Funds rates and long-term market-set rates, which drive asset valuation and affect borrowers more, is even weaker. To back these contentions, I chart the effective fund funds rate, the three-month US treasury bill rate and the 10-year treasury note rate on a monthly basis from January 1962 to June 2026:

Download data

At the bottom of the graph, I have a table where I look at the data on a quarterly basis, and break it down into three groups - quarters where the fed funds rate decreased, quarters where it increased and quarters where it stayed unchanged. With both fed funds rate increases and decreases, you can see that the link with short term rates is stronger, and with both short term and long term rates, the bulk of the change in rates happens prior to or in the quarter that the Fed Funds rate changed, but there is only a mild spill over into the quarter after, with three month rates, and almost no spillover, with long term rates. Put simply, baed on this history, it looks like changes in fed funds rate are less signals of future movements in interest rates and more reflectors of changes that have already happened.

    The Fed's weaknesses in setting interest rates also plays out in its capacity to alter the trajectory of the real economy. While there are clearly periods that you can point to where Fed actions have had a material impact on he economy, with the Fed Fund rate was hiked to 20% under Paul Volcker in 1981, and triggering a deep recession, being a prime example, the link between Fed Fund rates and economic growth remains tenuous. In the graph below, I look at the changes in Fed Funds rates and real GDP growth in the quarter leading into, the quarter of and the quarter after the change:

Download data (FRED)

Again, there is little backing for conventional wisdom, which is that fed tightening (by raising the Fed funds rate) leads to drops in real growth (or even recessions) and that fed loosening (by lowering the Fed funds rate) is a signal of higher economic growth in the future. In fact, the more general conclusion that one can draw from the data is that the fed effect on the real economy has been more "meh" than "wow".

    The gap between investor perception on what the Fed can control on interest rates and the economy and its actual powers is not just wide, but potentially dangerous. From a policy perspective, it can lead to perverse actions, where central banks are pressured to lower the rates they control (like the Fed Funds rate) in the face of high inflation, leading to even higher inflation in the future. From an investor and business perspective, the focus on what the Fed is doing or will do can take attention away from the fundamentals, especially inflation, that ultimately drive both interest rates and growth.

Download data

As you can see, much of the variation in long term interest rates (with the ten-year US treasury rate standing in as proxy) can be explained by movements in inflation and real economic growth over time, not Fed action or inaction.

The Warsh Doctrine?
    All Fed chairs have had to wrestle with the problem of being perceived as all-powerful, when their true powers are limited, but Kevin Warsh is perhaps more exposed than any of his predecessors. The market fixation with the Fed is now deeply embedded in market, and there are politicians on both sides of the aisle who seem to think that Warsh can bring rates (mortgage, treasury) down to 2% or lower, if he so desires, when the truth is that with inflation expectations running at 2.5-3%, there is no chance of that happening. 
    The pathway out of this problem will be long and there will be pushback, but the end game should be a world where you see and hear from the Fed less, not more. I do believe that the decision to reduce or withhold guidance is a good first step, and it has to be followed by more open humility from the Fed (and from Warsh) about the limits of its powers and honesty about how frequently it follows markets, rather than leads them. In the context of today's (July 29, 2026) decision by the FOMC to leave rates unchanged, for instance, the subtext is that while inflation is running hotter than desired (3% or more, as opposed to the targeted number of 2%), much of that inflation is being driven by a war and its effect on oil prices
    There will be some who feel that markets will be lost without Fed guidance, but I don't think so. After all, financial markets set interest rates and stock prices before the guidance era, and did a pretty good job. In fact, I think that the surge in guidance from the Fed has led many in markets to abdicate their responsibility for paying heed to fundamentals and gauging what interest rates should be. 

Conclusion
    If there is a takeaway from this post, it should be that there is nothing inherently good about having more disclosure. In fact, there is a tipping point, where information overload can cause investors to behave in perverse ways. Thus, I am less of an absolutist about the quarterly versus semi-annual reporting debate than some, though my view is that rather than reduce the frequency of reporting, the SEC should be looking at slimming down reports, by replacing one-size-fits-all disclosure requirements with targeted disclosures and keeping the focus on reporting what has happened rather than prognosticate about the future. 
    With the Federal Reserve too, I think less is more is a better strategy - less guidance from the Fed about what it will do in the future, less opining from FOMC members about interest rates and the economy and less attention to FOMC meetings and the smoke signals that emerge from these meetings. Markets will step in to fill the vacuum, and that is good not just for investors but for the Fed, since its decisions are informed by those market judgments.

YouTube Video

Data


Thursday, September 5, 2024

The Power of Expectations: Nvidia's Earnings and the Market Reaction!

    Last Wednesday (August 28), the market waited with bated breath for Nvidia’s earning call, scheduled for after the market closed. That call, at first sight, contained exceptionally good news, with revenues and earnings coming in at stratospheric levels, and above expectations, but the stock fell in the aftermath, down 8% in Thursday’s trading. That drop of more than $200 billion in market capitalization in response to what looked like good news, at least on the surface, puzzled market observers, though, as is their wont, they had found a reason by day end. This dance between companies and investors, playing out in expected and actual earnings, is a feature of every earnings season, especially so in the United States, and it has always fascinated me. In this post, I will use the Nvidia earnings release to examine what news, if any, is contained in earnings reports, and how traders and investors use that news to reframe their thinking about stocks.

Earnings Reports: The Components
   When I was first exposed to financial markets in a classroom, I was taught about information being delivered to markets, where that information is processed and converted into prices. I was fascinated by the process, an interplay of accounting, finance and psychology, and it was the subject of my doctoral thesis, on how distortions in information delivery (delays, lies, mistakes) affects stock returns. In the real world, that fascination has led me to pay attention to earnings reports, which while overplayed, remain the primary mechanism for companies to convey information about their performance and prospects to markets.

The Timing
    Publicly traded companies have had disclosure requirements for much of their existence, but those requirements have become formalized and more extensive over time, partly in response to investor demands for more information and partly to even the playing field between institutional and individual investors. In the aftermath of the great depression, the Securities Exchange Commission was created as part of the Securities Exchange Act, in 1934, and that act also required any company issuing securities under that act, i.e., all publicly traded firms, make annual filings (10Ks) and quarterly filings (10Qs), that would be accessible to investors.
    The act also specifies that these filings be made in a timely manner, with a 1946 stipulation the annual filings being made within 90 days of the fiscal year-end, and the quarterly reports within 45 calendar days of the quarter-end. With technology speeding up the filing process, a 2002 rule changed those requirements to 60 days, for annual reports, and 40 days for quarterly reports, for companies with market capitalizations exceeding $700 million. While there are some companies that test out these limits, most companies file well within these deadlines, often within a couple of weeks of the year or quarter ending, and many of them file their reports on about the same date every year.
    If you couple the timing regularity in company filings with the fact that almost 65% of listed companies have fiscal years that coincide with calendar years, it should come as no surprise that earnings reports tend to get bunched up at certain times of the year (mid-January, mid-April, mid-July and mid-October), creating “earnings seasons”. That said, there are quite a few companies, many of them high-profile, that preserve quirky fiscal years, and since Nvidia’s earnings report triggered this post, it is worth noting that Nvidia has a fiscal year that ends on January 31 of each year, with quarters ending on April 30, July 31 and October 31. In fact, the Nvidia earnings report on August 28 covered the second quarter of this fiscal year (which is Nvidia's 2025 fiscal year).

The Expectations Game
    While corporate earnings reports are delivered once a quarter, the work of anticipating what you expect these reports to contain, especially in terms of earnings per share, starts almost immediately after the previous earnings report is delivered. In fact, a significant portion of sell side equity research is dedicated to this activity, with revisions made to the expected earnings, as you get closer and closer to the next earnings report. In making their earnings judgments and revisions, analysts draw on many sources, including:
  1. The company’s history/news: With the standard caveat that the past does not guarantee future results, analysts consider a company’s historical trend lines in forecasting revenues and earnings. This can be augmented with other information that is released by the company during the course of the quarter.
  2. Peer group reporting: To the extent that the company’s peer group is affected by common factors, it is natural to consider the positive or negative the operating results from other companies in the group, that may have reported earnings ahead of your company. 
  3. Other analysts’ estimates: Much as analysts claim to be independent thinkers, it is human nature to be affected by what others in the group are doing. Thus, an upward revision in earnings by one analyst, especially an influential one, can lead to revisions upwards on the part of other analysts.
  4. Macro news: While macroeconomic news (about the economy, inflation or currency exchange rates) cuts across the market, in terms of impact, some companies are more exposed to macroeconomic factors than others, and analysts will have to revisit earnings estimates in light of new information.
The earnings expectations for individual companies, from sell side equity research analysts are publicly accessible, giving us a window on trend lines. 
    Nvidia is one of the most widely followed companies in the world, and most of the seventy plus analysts who publicly follow the firm play the estimation game, leading into the earnings reports. Ahead of the most recent second quarter earnings report, the analyst consensus was that the company would report revenues of $28.42 billion for the quarter, and fully diluted earnings per share of 64 cents; in the 30 days leading into the report, the earnings estimates had drifted up mildly (about 0.1%), with the delay in the Blackwell (NVidia’s new AI chip) talked about but not expected to affect revenue growth near term. It is worth noting that not all analysts tracking the stock forecast every metric, and that there was disagreement among them, which is also captured in the range on the estimates; on earnings per share, for instance, the estimates ranged from 60 to 68 cents, and on revenues, from $26 to $30 billion.
    The pre-game show is not restricted to analysts and investors, and markets partake in the expectations game in two ways. 
  • Stock prices adjust up or down, as earnings expectations are revised upwards or downwards, in the weeks leading up to the earnings report. Nvidia, which traded at $104 on May 23rd, right after the company reported its results for the first quarter of 2024, had its ups and down during the quarter, hitting an all-time high of $135.58 on June 18, 2024, and a low of $92.06, on August 5, before ending at $125.61 on August 28, just ahead of the earnings report:

    During that period, the company also split its shares, ten to one, on June 10, a week ahead of reaching its highs.

  • Stock volatility can also changes, depending upon disagreements among analysts about expected earnings, and the expected market reaction to earnings surprises. That effect is visible not only in observed stock price volatility, but also in the options market, as implied volatility. For Nvidia, there was clearly much more disagreement among investors about the contents of the second quarter earnings report, with implied volatility spiking in the weeks ahead of the report: 
Source: Fintel
While volatility tends to increase just ahead of earnings reports, the surge in volatility ahead of the second quarter earnings for Nvidia was unusually large, a reflection of the disagreement among investors about how the earnings report would play out in the market. Put simply, even before Nvidia reported earnings on August 28, markets were indicating more unease about both the contents of the report and the market reaction to the report, than they were with prior earnings releases. 

The Event
    Given the lead-in to earnings reports, what exactly do they contain as news? The SEC strictures that companies disclose both annual and quarterly results have been buffered by accounting requirements on what those disclosures should contain. In the United States, at least, quarterly reports contain almost all of the relevant information that is included in annual reports, and both have suffered from the disclosure bloat that I called attention to in my post on disclosure diarrhea. Nvidia’s second quarter earnings report, weighing in at 80 pages, was shorter than its annual report, which ran 96 pages, and both are less bloated than the filings of other large market-cap companies.
    The centerpieces of the earnings report, not surprisingly, are the financial statements, as operating numbers are compared to expectations, and Nvidia’s second quarter numbers, at least at first sight, are dazzling:


The company’s astonishing run of the last few years continues, as its revenues, powered by AI chip sales, more than doubled over the same quarter last year, and profit margins came in at stratospheric levels.  The problem, though, is that the company's performance over the last three quarters, in particular, have created expectations that no company can meet. While it is just one quarter, there are clear signs of more slowing to come, as scaling will continue to push revenue growth down, the unit economics will be pressured as chip manufacturers (TSMC) push for a larger slice and operating margins will decrease, as competition increases.
    Over the last two decades, companies have supplemented the financial reports with guidance on key metrics, particularly revenues, margins and earnings, in future quarters. That guidance has two objectives, with the first directed at investors, with the intent of providing information, and the second at analysts, to frame expectations for the next quarter. As a company that has played the expectations game well, it should come as no surprise that Nvidia provided guidance for future quarters in its second quarter report, and here too, there were reminders that comparisons would get more challenging in future quarters, as they  predicted that revenue growth rates would come back to earth, and that margins would, at best, level off or perhaps even decline. 
    Finally, in an overlooked news story, Nvidia announced that it would had authorized $50 billion in buybacks, over an unspecified time frame. While that cash return is not surprising for a company that has became a profit machine, it is at odds with the story that some investors were pricing into the stock of a company with almost unlimited growth opportunities in an immense new market (AI). Just as Meta and Alphabet’s dividend initiations signaled that they were approaching middle age, Nvidia’s buyback announcement may be signaling that the company is entering a new phase in the life cycle, intentionally or by accident.

The Scoring
    The final piece of the earning release story, and the one that gets the most news attention, is the market reaction to the earnings reports. There is evidence in market history that earnings reports affect stock prices, with the direction of the effect depending on how actual earnings measure up to expectations. While there have been dozens of academic papers that focus on market reactions to earnings reports, their findings can be captured in a composite graph that classifies earnings reports into deciles, based upon the earnings surprise, defined as the difference between actual and predicted earnings:


As you can see, positive surprises cause stock prices to increase, whereas negative surprises lead to price drops, on the announcement date, but there is drift both before and after surprises in the same direction. The former (prices drifting up before positive and down before negative surprises) is consistent with the notion that information about earnings surprises leaks to markets in the days before the report, but the latter (prices continuing to drift up after positive or down after negative surprises) indicates a slow-learning market that can perhaps be exploited to earn excess returns. Breaking down the findings on earnings reports, there seems to be evidence that the that the earnings surprise effect has moderated over time, perhaps because there are more pathways for information to get to markets.
    Nvidia is not only one of the most widely followed and talked about stocks in the market, but one that has learned to play the expectations game well, insofar as it seems to find a way to beat them consistently, as can be seen in the following table, which looks at their earnings surprises over the last 5 years:
Nvidia Earnings Surprise (%)
Barring two quarters in 2022, Nvidia has managed to beat expectations on earnings per share every quarter for the last five years. There are two interpretations of these results, and there is truth in both of them. The first is that Nvidia, as with many other technology companies, has enough discretion in both its expenditures (especially in R&D) and in its revenue recognition, that it can use it to beat what analysts expect. The second is that the speed with which the demand for AI chips has grown has surprised everyone in the space (company, analysts, investors) and that the results reflect the undershooting on forecasts. 
    Focusing specifically on the 2025 second quarter, Nvidia beat analyst expectations, delivering earnings per share of 68 cents (above the 64 cents forecast) and revenues of $30 billion (again higher than the $28.4 billion forecast), but the percentage by which it beat expectations was smaller than in the most recent quarters. That may sound like nitpicking, but the expectations game is an insidious one, where investors move the goal posts constantly, and more so, if you have been successful in the past. On August 28, after the earnings report, Nvidia saw share prices drop by 8% and not only did that loss persist through the next trading day, the stock has continued to lose ground, and was trading at $106 at the start of trading on September 6, 2028.

Earnings Reports: Reading the Tea Leaves
    So what do you learn from earnings reports that may cause you to reassess what a stock is worth? The answer will depend upon whether you consider yourself more of a trader or primarily an investor. If that distinction is lost on you, I will start this section by drawing the contrast between the two approaches, and what each approach is looking for in an earnings report.

Value versus Price
    At the risk of revisiting a theme that I have used many times before, there are key differences in philosophy and approach between valuing an asset and pricing it.
  • The value of an asset is determined by its fundamentals – cash flows, growth and risk, and we attempt to estimate that value by bringing in these fundamentals into a construct like discounted cash flow valuation or a DCF. Looking past the modeling and the numbers, though, the value of a business ultimately comes from the story you tell about that business, and how that story plays out in the valuation inputs.
  • The price of an asset is set by demand and supply, and while fundamentals play a role, five decades of behavioral finance has also taught us that momentum and mood have a much greater effect in pricing, and that the most effective approach to pricing an asset is to find out what others are paying for similar assets. Thus, determining how much to pay for a stock by using a PE ratio derived from looking its peer group is pricing the stock, not valuing it.
The difference between investing and trading stems from this distinction between value and price. Investing is about valuing an asset, buying it at a price less than value and hoping that the gap will close, whereas trading is almost entirely a pricing game, buying at a low price and selling at a higher one, taking advantage of momentum or mood shifts. Given the very different perspectives the two groups bring to markets, it should come as no surprise that what traders look for in an earnings report is very different from what investors see in that same earnings report. 

Earnings Reports: The Trading Read
    If prices are driven by mood and momentum, it should come as no surprise that what traders are looking for in an earnings report are clues about how whether the prevailing mood and momentum will prevail or shift. It follows that traders tend to focus on the earnings per share surprises, since its centrality to the report makes it more likely to be a momentum-driver. In addition, traders are also swayed more by the theater around how earnings news gets delivered, as evidenced, for instance, by the negative reaction to a recent earnings report from Tesla, where Elon Musk sounded downbeat, during the earnings call. Finally, there is a significant feedback loop, in pricing, where the initial reaction to an earnings report, either online or in the after market, can affect subsequent reaction. As a trader, you may learn more about how an earnings report will play out by watching social media and market reaction to it than by poring over the financial statements.
    For Nvidia, the second quarter report contained good news, if good is defined as beating expectations, but the earnings beat was lower than in prior quarters. Coupled with sober guidance and a concern the stock had gone up too much and too fast, as its market cap had increased from less than half a trillion to three trillion over the course of two years, the stage was set for a mood and momentum shift, and the trading since the earnings release indicates that it has happened. Note, though, that this does not mean that something else could not cause the momentum to shift back, but before you, as an Nvidia manager or shareholder, are tempted to complain about the vagaries of momentum, recognize that for much of the last two years, no stock has benefited more from momentum than Nvidia.

The Investing Read
    For investors, the takeaways from earnings reports should be very different. If value comes from key value inputs (revenues growth, profitability, reinvestment and risk), and these value inputs themselves come from your company narrative, as an investor, you are looking at the earnings reports to see if there is information in them that would change your core narrative for the company. Thus, an earnings report can have a significant effect on value, if it significantly changes the growth, profitability or risk parts of your company’s story, even though the company’s bottom line (earnings per share) might have come in at expectations. Here are a few examples:
  • A company reporting revenue growth, small or even negligible for the moment, but coming from a geography or product that has large market potential, can see its value jump as a consequence. In 2012, I reassessed the value of Facebook upwards, a few months after it had gone public and seen its stock price collapse, because its first earnings report, while disappointing in terms of the bottom line, contained indications that the company was starting to succeed in getting its platform working on smart phones, a historical weak spot for the firm.
  • You can also have a company reporting higher than expected revenue growth accompanied by lower than anticipated profit margins, suggesting a changing business model, and thus a changed story and valuation. Earlier this year, I valued Tesla, and argued that their lower margins, while bad news standing alone, was good news if your story for Tesla was that it would emerge as a mass market automobile company, capable of selling more cars than Volkswagen and Toyota. Since the only pathway to that story is with lower-priced cars, the Tesla strategy of cutting prices was in line with that story, albeit at the expense of profit margins.
  • A company reporting regulatory or legal actions directed against it, that make its business model more costly or more risky to operate, even though its current numbers (revenues, earnings etc.) are unscathed (so far).
In short, if you are an investor, the most interesting components of the report are not in the proverbial bottom line, i.e., whether earnings per share came in below or above expectations, but in the details. Finally, as investors, you may be interested in how earnings reports change market mood, usually a trading focus, because that mood change can operate as a catalyst that causes the price-value gap to close, enriching you in the process. 

    The figure below summarizes this section, by first contrasting the value and pricing processes, and then looking at how earnings releases can have different meanings to different market participants. 

As in other aspects of the market, it should therefore come as no surprise that the same earnings report can have different consequences for different market participants, and it is also possible that what is good news for one group (traders) may be bad news for another group (investors). 

Nvidia: Earnings and Value
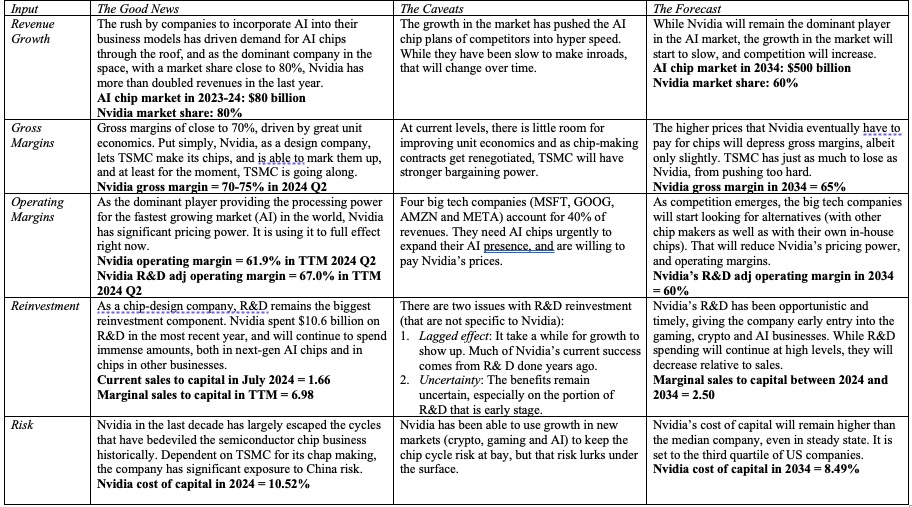
    My trading skills are limited, and that I am incapable of playing the momentum game with any success. Consequently, I am not qualified to weigh in on the debate on whether the momentum shift on Nvidia is temporary or long term, but I will use the Nvidia second quarter earnings report as an opportunity to revisit my Nvidia story and to deliver a September 2024 valuation for the company. My intrinsic valuation models are parsimonious, built around revenue growth, profit margins and reinvestment, and I used the second quarter earnings report to review my story (and inputs) on each one:

Nvidia: Valuation Inputs (Sept 2024)
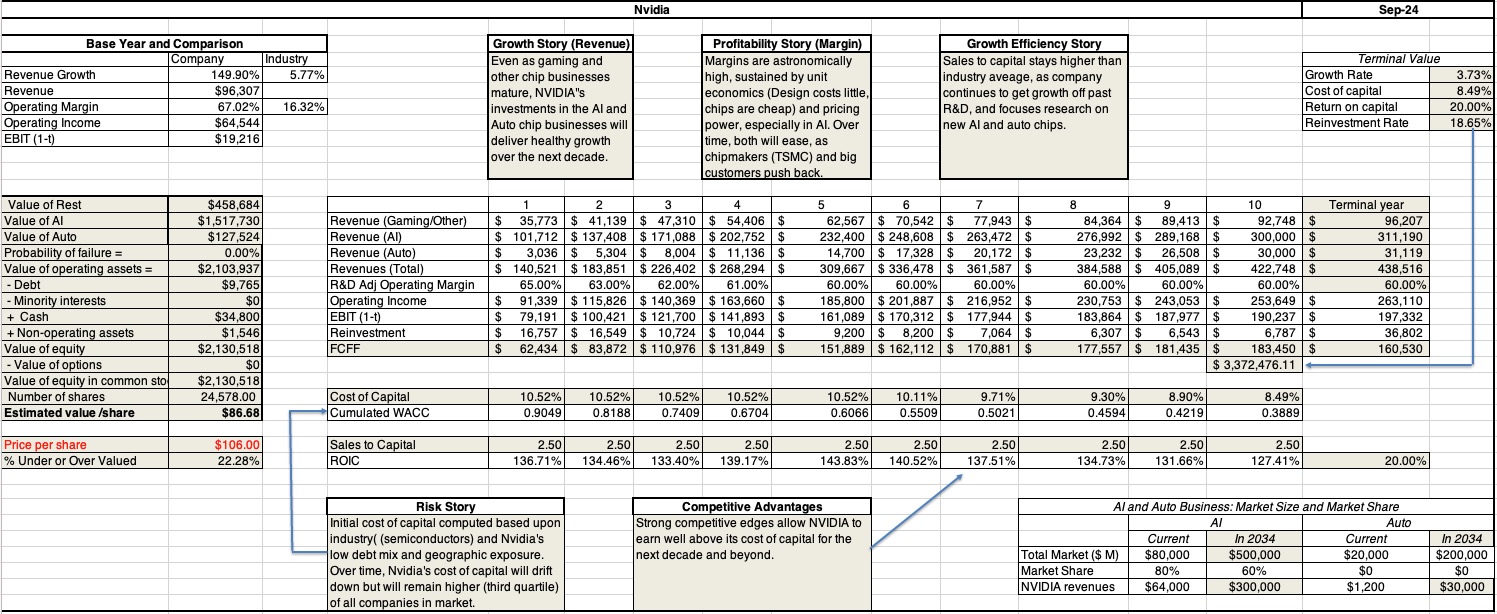
With these input changes in place, I revalued Nvidia at the start of September 2024, breaking its revenues, earnings and cash flows down into three businesses: an AI chip business that remains its central growth opportunity, and one in which it has a significant lead on the competition, an auto chip business where it is a small player in a small game, but one where there is potential coming from demand for more powerful chips in cars, and the rest, including its existing business in crypto and gaming, where growth and margins are solid, but unlikely to move dramatically. While traders may be disappointed with Nvidia’s earnings release, and wish it could keep its current pace going, I think it is both unrealistic and dangerous to expect it to do so. In fact, one reason that my story for Nvidia has become more expansive, relative to my assessment in June 2023, is that the speed with which AI architecture is being put in place is allowing the total market to grow at a rate far faster than I had forecast last year. In short, relative to where I was about a year ago, the last four earnings reports from the company indicate that the company can scale up more than I thought it could, has higher and more sustainable margins than I predicted and is perhaps less exposed to the cycles that the chip business has historically been victimized by. With those changes in place, my value per share for Nvidia in  is about $87, still about 22% below the stock price of $106 that the stock was trading at on September 5, 2024, a significant difference but one that is far smaller than the divergence that I noted last year.

Download spreadsheet

As always, the normal caveats apply. The first is that I value companies for myself, and while my valuations drive my decisions to buy or sell stocks, they should not determine your choices. That is why my Nvidia valuation spreadsheet is available not just for download, but for modification, to allow you to tell your own story for Nvidia, yielding a different value and decision. The second is that this is a tool for investors, not traders, and if you are playing the trading game, you will have to reframe the analysis and think in terms of mood and momentum. Looking back, I am at peace with the decision made in the summer of 2023 to shed half my Nvidia shares, and hold on to half. While I left money on the table, with the half that I sold, I have been richly compensated for holding on to the other half. I am going to count that as a win and move on!

YouTube Video


Links

Wednesday, February 27, 2019

The Perils of Investing Idol Worship: The Kraft Heinz Lessons!

On February 22, Kraft Heinz shocked investors with a trifecta of bad news in its earnings report: sub-par operating results, a mention of accounting irregularities and a massive impairment of goodwill, and followed up by cutting dividends per share almost 40%. Investors in the company reacted by selling their shares, causing the stock price to drop more than 25% overnight. While Kraft is neither the first, nor will it be the last company, to have a bad quarter, its travails are noteworthy for a simple reason. Significant portions of the stock were held by Berkshire Hathaway (26.7%) and 3G Capital (29%), a Brazil-based private equity group. Berkshire Hathaway’s lead oracle is Warren Buffett, venerated by some who track his every utterance, and try to imitate his actions. 3G Capital might not have Buffett’s name recognition, but its lead players are viewed as ruthlessly efficient managers, capable of delivering large cost cuts. In fact, their initial joint deal to bring together Heinz and Kraft, two of the biggest names in the food business, was viewed as a master stroke, and given the pedigree of the two investors, guaranteed to succeed. As the promised benefits have failed to materialize, the investors who followed them into the deal seem to view their failure as a betrayal.

The Back Story
You don’t have to like ketchup or processed cheese to know that Kraft and Heinz are part of American culinary history. Heinz, the older of the two companies, traces its history back to 1869, when Henry Heinz started packing and selling horseradish, and after a brief bout of bankruptcy, turned to making 57 varieties of ketchup. After a century of growth and profitability, the company hit a rough patch in the 1990s, and was targeted by activist investor, Nelson Peltz, in 2013. Shortly thereafter, Heinz was acquired by Berkshire Hathaway and 3G Capital for $23 billion, becoming a private company. Kraft started life as a cheese company in 1903, and over the next century, it expanded first into other dairy products, and then widened its repertoire to includes other processed foods. In 1981, it merged with Dart Industries, maker of Duracell batteries and Tupperware, before it was acquired by Philip Morris in 1988. After a series of convulsions, where parts of it were sold and rest merged with Nabisco, Kraft was spun off by Philip Morris (renamed Altria), and targeted by Nelson Peltz (yes, the same gentleman) in 2008. Through all the mergers, divestitures and spin offs, managers made promises of synergy and new beginnings, deal makers made money, but little of substance actually changed in the products.

In 2015, the two companies were brought together, with Berkshire Hathaway and 3G playing both match makers and deal funders, as Kraft Heinz, and the merger was completed in July 2015. At the time of the deal, there was unbridled enthusiasm on the part of investors and market observers, and part of the unquestioning acceptance that the new company would become a force in the global food business was the pedigree of the main investors. In the years since the merger, though, the company has had trouble delivering on expectations of revenue growth and cost cutting:

The bottom line is that while much was promised in terms of revenue growth, from expanding its global footprint, and increased margins, from cost cutting, at the time of the deal, the numbers tell a different story. In fact, if investors were surprised by the low growth and declining margins in the most recent earnings report, they should not have been, since this has been a long, slow bleed.

The Earnings Report
The earnings report that triggered the stock price collapse, for Kraft-Heinz, was released on February 22, and it contained bad news on many fronts:
  1. Flatlining Operations: Revenues for 2018 were unchanged from revenues in 2017, but operating income dipped (before impairment charges) from $6.2 billion in 2017 to $5.8 billion in 2018; the operating margin dropped from 23.5% in 2017 to 22% in 2018.
  2. Accounting Irregularities: In a surprise, the company also announced that it was under SEC investigation for accounting irregularities in its procurement area, and took a charge of $25 million to reflect expected adjustments to its costs.
  3. Goodwill Impairment: The company took a charge of $15.4 billion for impairment of goodwill, primarily on their US Refrigerated and Canadian Retail segments, an admission that they paid too much for acquisitions in prior years.
  4. Dividend Cuts: The company, a perennial big-dividend payer, cut its dividend per share from $2.50 to $1.60, to prepare itself for what it said would be a difficult 2019.
While investors were shocked, the crumb trail leading up to this report contained key clues. Revenues had already flattened out in 2017, relative to 2016, and the decline in margins reflected difficulties that 3G faced in trying to cut costs, after the deal was made. The only people who care about impairment charges, a pointless and delayed admission of overpayment on acquisitions, are those who use book value of equity as a proxy for overall value. The dividend cuts were perhaps a surprise, but more in what they say about how panicked management must be about future operations, since a company this attached to dividends cuts them only as a last resort.

The Value Effects
With the bad news in the earnings report still fresh, let’s consider the implications for the story for, and the value of, Kraft Heinz. The flat revenues and the declining margins, as I see them, are part of a long term trend that will be difficult, if not impossible, to reverse. While Kraft-Heinz may have a quarter or two with positive blips, I see more of the same going forward. In my valuation, I have forecast a revenue growth of 1% a year in perpetuity, less than the inflation rate, reflecting the headwinds the company faces. That downbeat revenue growth story will be accompanied by a matching “bad news” story on operating margins, where the company will face pricing pressures in its product markets, leading to a drop (though a small and gradual one) in operating margins over time, from 22% in 2018 (already down from 2017) to 20% over the next five years. The company’s cost of capital is currently 6%, reflecting the nature of its products and its use of debt, but over time, the benefits from the latter will wear thin, and since that is close to the average for the industry (US food processing companies have an average cost of capital of 6.12%), I will leave it unchanged. Finally, the mistakes of the past few years will leave at least one positive residue in the form of restructuring charges, that I assume will provide partial shelter from taxes, at least for the next two years.
Spreadsheet with valuation
The good news is that, even with a stilted story, Kraft Heinz has a value ($34.88) that is close to the stock price ($34.23). The bad news is that the potential upside looks limited, as you can see in the results of a simulation that I did, allowing expected revenue growth, operating margin and cost of capital to be drawn from distributions, rather than using point estimates.
Simulation Results
The finding the value falls within a tight range, with the first decile at about $26 and the ninth at close to $47 should not surprise you, since the ranges on the inputs are also not wide. As an investor, here are the actions that would follow this valuation. 
  • If you owned Kraft Heinz prior to the earnings report (and I thankfully did not), selling now will accomplish little. The damage has been done already, and the stock as priced now, is a fair value investment. I know that 3G sold almost one quarter of its holding in September 2018, good timing given the earnings report, but any attempts to sell now will gain them nothing. (I made a mistake in an earlier version of the post, and I thank those of you who pointed it out.)
  • If you don’t own Kraft Heinz, the valuation suggests that the stock is fairly valued, at today’s price, but at a lower price, it would be a good investment. I have a limit buy on the stock at a $30 price (close the 25th percentile of the distribution), and if it does hit that price, I will be a Kraft Heinz stockholder, notwithstanding the fact that I think its future does not hold promise. If it does not drop that low, there are other fish to catch and I will move on.
There are two concerns, though, that investors looking at this stock have to consider. The first is that when companies claim that they have discovered accounting irregularities, but that they have cleaned up their acts, they are often dissembling and that there are more shocks to come. With Kraft Heinz, the magnitude of the irregularity is small, and given that they have no history of playing accounting games, I am willing to given them the benefit of the doubt. The second is that the company does carry $32 billion in debt, and while that debt has no toxic side effects today, that is because the company is perceived to have stable and positive cash flows. If the margin decline that I forecast becomes a margin rout, the debt will expose the company to a clear and present danger of default. Put simply, it will make the bad case scenarios that are embedded in the simulation worse, and perhaps threaten the company’s existence. 

The Lessons
There are lessons in the Kraft-Heinz blow-up, but I will tread carefully, since I risk offending some, with talk that you may view as not just incorrect but sacrilegious:
  1. It is human to err: At the risk of stating the obvious, Warren Buffett and 3G’s key operators are human, and are prone to not only making mistakes, like the rest of us, but also to have blind spots in investing that hurt them. In fact, Buffett has been open about his mistakes, and how much they have cost him and Berkshire Hathaway shareholders. He has also been candid about his blind spots, which include an unwillingness to invest in businesses that he does not understand, a sphere that only grows as he gets older and the economy changes, and an excessive trust in the managers of the companies that he invests in. While he is, for the most part, an excellent judge of character, his investments in Wells Fargo, Coca Cola and Kraft-Heinz show that he is not perfect. The fault, in my view, is not with Buffett, but with the legions of investors, analysts and journalists who treat him as an investment deity, quoting his words as gospel and tarring and feathering anyone who dares to question them. 
  2. Stocks are not bonds: In my data posts, I looked at how companies in the United States have moved away from dividends to buybacks, as a way of returning cash. That trend, though, has not been universally welcomed by investors, and there remains a significant subset of investors, with strategies built around buying stocks with big dividends. One reason that stocks like Kraft  Heinz become attractive to conservative value investors is because they offer high dividend yields, often much higher than what you could earn investing in treasury or even safe corporate bonds. In effect, the rationale that investors use is that by buying these shares, they are in effect getting a bond (with the dividends replacing coupons), with price appreciation. From the Dogs of the Dow to screening based upon dividend yields, the underlying premise is that investors can count more on dividends than on buybacks. While it is true that dividends are stickier than buybacks, with many companies maintaining or increasing dividends over time, these dividend-based strategies become delusional when they treat dividends as obligated payments, rather than expected ones. After all, much as companies do not like to cut dividends, they are not contractually obligated to pay dividends. In fact, when a stock carries a dividend yield that looks too good to be true, it is usually almost always an unsustainable dividends, and it is only a question of time before dividends are cut (or even stopped) or the company drives itself into a financial ditch. 
  3. Brand Names last a long time, but nothing lasts forever: A major lodestone of conventional value investing is that while technology, cost efficiencies and new products are all competitive advantages that can generate value, it is brand name that is the moat that has the most staying power. Again, that statement reflects a truth, which is that brand names last long, often stretching over decades, but even brand name benefits fade, as customers change and companies seek to become global. The troubles at Kraft-Heinz are part of a much bigger story, where some of the most recognized and valued brand names of the twentieth century, from Coca Cola to McDonalds, are finding that their magic fading. Using my life cycle terminology, these companies are aging and no amount of financial engineering or strategic repositioning is going to make them young again. 
  4. Cost cutting can take you far, but no further: For the last few decades, we have cut a great deal of slack for those who use cost cutting as their pathway for creating value, with many leveraged buyouts and restructurings built almost entirely on its promise. Don’t get me wrong! In firms with significant cost inefficiencies and bloat, cost cutting can deliver significant gains in profits, but even with these firms, those gains will be time limited, since there is only so much fat to cut out. Worse, there are firms that find themselves in trouble for a myriad of reasons that have little to do with cost inefficiencies and cutting costs as these firms is a recipe for disaster. It is true that 3G did a masterful job, cutting costs and increasing margins at Mexico's Grupo Modelo, the Mexican brewer that they acquired through Inbev, but that was because Modelo’s problems lent themselves to a cost-cutting solution. It may even have worked at Kraft-Heinz initially, but at this point, the company’s problems may have little to do with cost inefficiencies, and much to do with a stable of products that is less appealing to customers than it used to be, and cost cutting is the wrong medicine for whatever ails them.
Conclusion
I hope that you do not read this as a hit piece on Warren Buffett and/or 3G. I admire Buffett’s adherence to a core philosophy and his willingness to be open about his mistakes, but I think he is ill served by some of his devotees, who insist on putting him on a pedestal and refuse to accept the reality that his philosophy has its limits, and that like the rest of us, he has an ego and makes mistakes. If you have faith in value investing, you should be willing to have that faith tested by the mistakes that you and the people you admire make in its pursuit. If your investment views are dogma, and you believe that your path is only the correct one to success, I wish you the best, but your righteousness and rigidity will only set you up for more disappointments like Kraft Heinz.

YouTube Video

Data

Tuesday, February 23, 2016

Lazarus Rising or Icarus Falling? The GoPro and LinkedIn Question!

As I watch GoPro and LinkedIn, two high flying stocks of not that long ago, come back to earth my mind is drawn to two much told stories. The first is the Greek myth about Icarus, a man who had wings of feathers and wax, but then soared so high that the sun melted his wings and he fell to earth. The other is that of Lazarus, who in the biblical story, is raised from the dead, four days after his burial. As investors, the decision that we face with GoPro and LinkedIn is whether like Icarus, they soared too high and have been scorched (perhaps permanently) or like Lazarus, they will come back to life.

GoPro: Camera, Smart Phone Accessory or Social Media Company?
GoPro went public in June 2014 at $24/share and quickly climbed in the months following to hit $93.85 in October of that year. When I first valued the company in this post, the stock was still trading at more than $70/share. Led by Nick Woodman, a CEO who had a knack for keeping himself in the public eye (not necessarily a bad thing for publicity seeking start up), and selling an action camera that was taking the world by storm, the company’s spanning of the camera, smartphone accessory and social media businesses seemed to position it to conquer the world. Even at its peak, though, it was clear the competitive storm clouds were gathering as other players in the market, noting GoPro’s success, readied their own products.

In the last year, GoPro lost much of its luster as its product offerings have aged and sales growth has lagged expectations. It is a testimonial to these lowered expectations that investors were expecting revenues to drop, relative to the same quarter in the prior year, in the most recent quarterly earnings report from the company.

The company reported that it not only grew slower and shipped fewer units than expected in the most recent quarter, but also suggested that future revenues would be lower than expected. While the company’s defense was that consumers were waiting for the new GoPro 5, expected in 2016, investors were not assuaged. The stock dropped almost 20% on the news, hitting an all-time low of $9.78, right after the announcement.

To evaluate how the disappointments of the last year have impacted value, I went back to October 2014, when I valued the stock at $30.57. Viewing it as part camera, part smart phone and part social media company (whose primary market is composed of hyper active, over sharers), I estimated that it would be able to grow its revenues 36% a year, to reach about $10 billion in steady state, while earning a pre-tax operating margin of 12.5%. Revisiting that story, with the results in the earnings reports since, it looks like competition has arrived sooner and stronger than anticipated, and that the company’s revenue growth and operating margins will both be more muted.

In my updated valuation, I reduced my targeted revenues to $4.7 billion in steady state, my target operating margin to 9.84% (the average for electronics companies) and increased the likelihood that the company will fail to 20%. The value per share that I get with my updated estimates is $17.66, 35% higher than the price per share of $12.81, at the start of trading on February 22, 2016.  Looking at the simulation of values, here is what I get:
Spreadsheet with valuation
At its price of $12.81, there is a 68% chance that the stock is under valued, at least based on my assumptions.

I am fully aware of the risks embedded in this valuation. The first is that as an electronics hardware company that derives the bulk of its sales from one item, GoPro is exposed to a new product that is viewed as better by consumers, and especially so if that new product comes from a company with deep pockets and a big marketing budget; a Sony, Apple or Google would all fit the bill. The second is that the management of GoPro has been pushing a narrative that is unfocused and inconsistent, a potentially fatal error for a young company. I think that the company not only has to decide whether its future lies in action cameras or in social media and act accordingly, but it also has to stop sending mixed messages on growth; the stock buyback last year was clearly not what you would expect from a company with growth options.

Linkedin: The Online Networking Alternative?
LinkedIn went public in May 2011, about a year ahead of Facebook and can thus be viewed as one of the more seasoned social media companies in the market. Like GoPro, its stock price soared after the initial public offering:

LinkedIn Stock Price: IPO to Current
While it often lumped up with other social media companies, Linkedin is different at two levels. The first is that it is less dependent on advertising revenues than other social media companies, deriving almost 80% of its revenues from premium subscriptions that it sells its customers and from matching people up to jobs. The second is that its pathway to profitability has been both less steep and speedier than the other social media companies, with the company reporting profits (GAAP) in both 2013 and 2014, though they did lose money in 2015.

Unlike GoPro, where expectations and stock prices had been on their way down in the year before the most recent earnings report, the most recent earnings report was a surprise, though, at least at first sight, it did not include information that would have led to this abrupt a reassessment:
Linkedin delivered earnings and revenue numbers that were higher then expectations and much of the negative reaction seems to have been to the guidance in the report.

While I have not valued Linkedin explicitly on this blog for the last few years, it has been a company that has impressed me for a simple reason. Unlike many other social media companies that seemed to be focused on just collecting users, Linkedin has always seemed more aware of the need to work on two channels, delivering more users to keep markets happy and working, at the same time, on monetizing these users in the other, for the eventuality that markets will start wanting more at some point in time. Its presence in the manpower market also means that it does not have to become one more player in the crowded online advertising market, where the two biggest players (Facebook and Google) are threatening to run up their scores. Nothing in the latest earnings report would lead me to reassess this story, with the only caveat being that the drop in earnings in the most recent year suggests that profit margins in the manpower business are likely to be smaller and more volatile than in the advertising business.

Allowing for Linkedin’s presence in two markets, I revalued the company with revenue growth of 25% a year for the next five years, leading to $15.3 billion in revenues in steady state (ten years from now), and a target pre-tax operating margin of 18%, lower than my target margins for Twitter or Facebook, reflecting the lower margins in the manpower business. The value per share that I get for the company is $103.49, about 10% below where the market is pricing the stock right now. The results of the simulation are presented below:

Spreadsheet with valuation
At its current stock price, there is about a 40% chance that the company is under valued.  If you have wanted to hold LinkedIn stock, and have been put off by the pricing, the price is tantalizingly close to making it happen. As with other social media companies, LinkedIn’s user base of 410 million and their activity on the platform are the drivers of its revenues and value.

The Acquisition Option
If you are already invested in GoPro or LinkedIn, one reason that you may have is that there will be someone out there, with deep pockets, who will acquire the firm, if the price stays where it is or drops further, thus putting a floor on the value. That is not an unreasonable assumption but to me, this has always been fool's gold, where the hope of an acquisition sustains value and the price goes up and down with each rumor. I have seen it play out on my Twitter investment and I do think it gets in the way of thinking seriously about whether your investment is backed by value.

That said, I do think that having an asset or assets that could be more valuable to another company or entity does increase the value of a company. It is akin to a floor, but it is a shifting floor, and here is why. Consider LinkedIn, a company with 410 million users. Even with the drop in market prices of social media companies in the last few months, the market is paying roughly $80/user (down from about $100/user a couple of years ago). You could argue that an acquirer would be a bargain, if they could acquire LinkedIn at $8 billion, roughly $20 a user. However, the price that an acquirer will be willing to pay for LinkedIn users will increase if revenues are growing at a healthy rate and the company is monetizing its users. 

To evaluate the impact that introducing the possibility of an acquisition does to LinkedIn's value, I started by assuming that the acquisition price for LinkedIn would be $8 billion, but that the value would range from $4 billion (if revenue growth is flat and margins are low) to $12 billion (if revenue growth is robust). I then reran the simulation of LinkedIn's valuation, with the assumption that the company would be bought out, if the market capitalization dropped below the acquisition price. In the picture below, I compare the values across the two simulations, one without an acquisition floor and one with:

You may be surprised by how small the effect of introducing an acquisition floor has on value but it reflects two realities. One is my assumption that the expected acquisition price is $8 billion; raising that number towards the current market capitalization of $15.4 billion will increase the effect. The other is my assumption that the acquisition price will slide lower, if LinkedIn's revenue growth and operating profitability lag. 

Fighting my Preconceptions
I must start with a confession. After watching the price drop on these two stocks, and prior to my valuations, I really, really wanted LinkedIn to be my investment choice. I like the company for many reasons:
  1. As noted earlier, unlike many other social media companies, it is not just an online advertising company.
  2. The other business (networking and manpower) that the company operates in is appealing both because of its size, and the nature of the competition.
  3. The top management of LinkedIn has struck me as more competent and less publicity-conscious that those at some other high profile social media companies. I think it is good news that I had to think a few minutes about who LinkedIn's CEO was (Jeff Weiner) and check my answer.
I have a sneaking suspicion that my biases did affect my inputs for both companies, making me more pessimistic in my GoPro inputs and more optimistic on my LinkedIn values. That said, the values that I obtained were not in keeping with my preconceptions. In spite of my inputs, GoPro is significantly under valued and in spite of my implicit attempts to pump it up, LinkedIn does not make my value cut. Put differently, the market reaction to the most recent earnings report at LinkedIn was clearly an over reaction, but it just moved the stock from extremely over valued, on my scale, to close to fair value. 

YouTube Video

Datasets
  1. GoPro - Bloomberg Summary (including 2015 numbers)
  2. LinkedIn - Bloomberg Summary (including 2015 numbers)
Spreadsheets
  1. GoPro - Valuation in February 2016
  2. Twitter - Valuation in February 2016
Blog posts in this series
  1. A Violent Earnings Season: The Pricing and Value Games
  2. Race to the top: The Duel between Alphabet and Apple!
  3. The Disruptive Duo: Amazon and Netflix 
  4. Management Matters: Facebook and Twitter
  5. Lazarus Rising or Icarus Falling? The GoPro and LinkedIn Question!
  6. Investor or Trader? Finding your place in the Value/Price Game! (Later this year)
  7. The Perfect Investor Base? Corporation and the Value/Price Game (Later this year)
  8. Taming the Market? Rules, Regulations and Restrictions (Later this year)