Showing posts with label Pricing and Value. Show all posts

Tuesday, September 19, 2023

Putting the (Insta)cart before the (Grocery) horse: A COVID Favorite's Reality Check!

After years of rumors of an imminent IPO, Instacart has finally filed for a public offering of it’s shares, aspiring to raise about $600 million from markets, at a pricing of about $9-$10 billion for its equity. Coming in the week after ARM, an AI chip designer, also filed to go public, but with an estimated pricing of $55-$60 billion, it is an indication of how much the ground has shifted under Instacart since the heady days of 2020, when Instacart was viewed by some Americans as the only thing that stood between them and starvation. At that time, there were some who were suggesting that the company could go public at $50 billion or more, and pricing it on that basis, but reality has caught up with both the company and investors, and this IPO represents vastly downgraded expectations for the company’s future.

The Back Story

    To value Instacart, you have to start with an understanding of the business model that animates the company, as well the underlying business that it is intermediating. I start with this section with the Instacart business model, which is not complicated, but I will spend the rest of the section exploring the operating characteristics of the grocery business, and its online segment.

The Instacart Business Model

    The Instacart business model extends online shopping, already common in other areas of retailing, into the grocery store space. That is not to say that there aren't logistical challenges, especially because grocery store carry thousands of items, and grocery shopping lists can run to dozens of these, with varying unit measures (by item, by weight) and substitution questions (when items are out of stock). Instacart operates as the intermediary between customers and grocery stores, where customers pick the grocery store that they would like to shop at and the items that they would like to buy at that store, and Instacart does the rest:


Instacart hires store shoppers who gather the items for the order, checking with the customer on substitutions, if needed, and for those customers who choose the pick-up option, have them ready for pick-up. If home delivery is chosen as the option, a driver (who, in many cases, is also the shopper) delivers the groceries to the customer's home. Customers get the time-savings and convenience from having grocery shopping (and delivery, if chosen) done for them, but they pay in the form on both delivery fees and a service charge of 5-10% of the bill, depending on the store picked and the number of items in the basket. Instacart also offers a subscription model, Instacart Express, where subscribers in return for paying a subscription fee (annual or monthly) get free deliveries from the service.

    For grocery stores, Instacart is a mixed blessing. It does expand the customer base by bringing in those who could not or would not have shopped physically at the store, but stores often have to pay Instacart fulfillment fees, which they sometime pass through as higher prices on products. In addition, grocery stores lose direct relationships with customers as well as data on their shopping habits, which may be useful in making strategic and tactical decision on product mix and pricing.

    I will approach the analysis of the Instacart model's capacity for growth and value creation in four steps. In the first, I will look at the grocery business, both in terms of growth and profitability of grocery stores, since Instacart, as an intermediary in the business, will be affected by grocery business fundamentals. In the second, I will examine the forces that are pushing consumers to online grocery shopping, and the ceiling for that growth is much lower than it is than in other areas of retailing. In the third, I will focus on how the competition to Instacart, within the online grocery retail space, is shaping up, and the consequences for its market share. In the final, I will examine the operating costs faced by Instacart, especially in the content of how the fee pie will be shared by the company with its shoppers and drivers.

1. The Grocery Business

    When you are looking for an easy company to value, where you can safely extrapolate the past and not over indulge your imagination, you should try a grocery store. For decades, at least in the US and Europe, the grocery business has had a combination of low growth and low margins that, on the one hand, keep pricing in check and on the other, make the business an unlikely target for disruption. Let's start by looking at growth in aggregate revenues, across all grocery stores in the United States over the last three decades:

You will notice that revenue growth rate has been anemic for most of the thirty years covered in this analysis, and that even the spurts in growth you have seen in 2020 and 2022 have specific reasons, unlikely to be sustainable, with the COVID shutdown explaining the 2020 jump, and inflation in food prices explaining the 2022 increase.
    On the profitability front, the grocery business operates on slim margins, at every level. The gross margin, measuring how much grocery stores clear after covering the costs of the goods sold, has risen slightly over time, perhaps because of growth in processed and packaged food sales, but is still less than 25%. The operating margin, which is after all operating expenses, and a more complete measure of operating profitability has been about 5% or less for almost the entire period.


If you are an intermediary in a business with slim operating margins, as Instacart is, the low operating profitability of the grocery business will limit how much you can claim as a price for intermediation, in service fees.
    To complete the grocery business story, it is also worth looking at the players in the business, and it should come as little surprise that it is dominated by a few big names. The biggest is Walmart, which derives close to 56% of its $400 billion in total revenues in the US, from groceries, but Target and Amazon (through Whole Foods and Amazon Fresh) are also big players. Krogers and Albertsons have emerged as the grocery store giants, by consolidating smaller grocery companies across the country: 


The fact that the grocery business is dominated by a few big names will also play a role in the Instacart valuation story, by affecting the bargaining power that Instacart has, in negotiating for its share of the grocery pie. In sum, the overall grocery pie is growing slowly, and the slice of the pie that is profit for those in the grocery game is slim, effectively limiting the valuation stories (and values) for every player in that game.

2. The Online Option

    Grocery shopping is different from other shopping, for many reasons. First, customers tend to favor a specific grocery store (or at most, a couple of stores) for most of their grocery needs. One reason for that is familiarity with store layout, since knowing where to find the items that you are looking for can make the difference between a 20-minute trip to the store and a hour-long slog. Another is location, with customers tending to shop at neighborhood stores, for much of their needs, since groceries do not do well with long transportation times. Second, for non-processed food, especially meats and produce, being able to see and sometimes touch items before you buy them is part of the shopping experience, with online pictures of the same products operating as poor substitute. For these reasons, grocery retail remained almost immune from the disruption wrought on the rest of brick-and-mortar retail, at least in the United States. Even so, there has always been always a segment of the population that has been open to online grocery shopping, sometimes because of physical constraints (homebound or unable to drive) and sometimes because of time and convenience (busy work and family schedules). That segment was viewed as a niche market, and until 2020, conventional players in the grocery business did not pay much attention to it, with the exception of Amazon. It was the COVID shutdown in 2020 that changed the dynamics, as online grocery shopping became not just an option, but sometimes the only option, for some. 

As a company that was built exclusively for this purpose, Instacart had a first-move advantage and saw customers, order and revenues all soar during the year. Caught up in the mood of the moment, it is easy to see why so many extrapolated Instacart’s success in 2020 into the future, forecasting that the shift to online grocery shopping would be permanent, and that Instacart would dominate that business.

      As COVID has eased, though, many of those who shopped for groceries online have returned to physical shopping, but it is undeniable that there are some who have decided that the convenience of online shopping exceeds any disadvantages, and have continued with that practice. In fact, while there is uncertainty on this front, the projection is that the percent of grocery shopping that will be done online will increase over time:

There are two points worth making about the trend towards online shopping. The first is that the ceiling on online grocery retail will remain much lower than the ceiling on online shopping in other areas in retail, with even optimists capping the share at 20%.  In short, the growth in online grocery sales will be higher than total grocery sales growth, but not overwhelmingly so. The second is that while some have persisted with online grocery shopping after 2020, it is less in deliveries and more in pick-ups, which will have implications for the market shares of competitors in the space.

3. The Competition

    In the first few months of the COVID shutdown, Instacart was dominant, partly because its platform was designed for online shopping, and partly because in a grocery market, where many stores were out of stock, it offered shopping choices to shoppers. That dominance, though, was short lived, since the grocers woke up quickly, and started offering online shopping services to their customer, with the tilt towards pick-up over delivery. The cost savings to customers was significant, since most grocery stores dispensed with service fees and used employees as shoppers, for their online customers. In the aftermath of COVID, the grocery stores have cemented their dominance of online grocery market, as can be seen in the market shares of the biggest online grocery retailers:


Walmart and Amazon are the two largest players in the online grocery market, and Instacart, while it has lost market share since 2020, is firmly in third place. Kroger's and Albertsons, the two largest grocery story chains, have also improved their standing. Instacart, as the only pure intermediary in this group, allows customers access to multiple grocery store options, and more choices when it comes to delivery, but even one that front, it is starting to face competition from Uber Eats, DoorDash and GrubHub. In short, Instacart will be lucky to hold on to its existing market share, even if it plays its cards right, leaving its growth at or below the growth in the overall online grocery shopping market.
    On a personal note, and it qualifies purely as anecdotal evidence, we (in my household) have not used Instacart since the peak COVID days of 2020, as we have returned to physical grocery shopping for products where it matters, while preserving online shopping for products which are staples, but only for pick up, rather than delivery. Since we shop at Ralph's, a Kroger subsidiary, we use their online shopping app, since it costless, matches in-store discounts and comes with a Ralph employee as a shopper, that is familiar with what we usually buy. I know that there are others who have stayed with Instacart, perhaps because of the grocery store choices it offers or because of its delivery options, but we have little interest in either, and perhaps are closer to the norm than the exception.

4. Operating Economics

    The revenues that Instacart collects from customers, either in service fees or in subscription revenues have multiple costs to cover. By far, the biggest is the cost that the company faces in hiring and paying thousands of shoppers and drivers to operate its system. Like ride-sharing companies, the question of how Instacart categorizes these workers, and the resulting costs, will determine what it will be able to generate as operating profits:

  1. Pay versus Commission: Instacart has traditionally paid its shoppers based upon the batches of work done (with a batch including shopping, packing and loading a customer order) and payments for deliveries made, with tips from customers accruing as additional income. In effect, that makes almost all of these expenses into variable costs, rising and falling with revenues, reducing risk to the company but also limiting benefits from economies of scale, as it gets bigger.
  2. Independent contractor versus Employee: Instacart has argued that the shoppers and drivers who work for it are independent contractors, rather than employees. That distinction matters because an employee categorization will open up Instacart not only to additional costs (social security, health care etc.) but also to legal liabilities, for employee actions. Many states are pushing Instacart (and others users of independent contractors, like Uber and Lyft) to reclassify their workers as employees, and in 2023, Instacart paid $46.5 million, to settle a California lawsuit on this count. 

As a company built around a technology platform, Instacart also has significant spending on R&D, as well as on customer support services.  In many ways, the operating expense issues that Instacart faces parallel the issues that Uber and Lyft have faced in the last few years, and I do believe that, over time, Instacart will have no choice but to deal with their shoppers as employees, with the accompanying costs. 

The Instacart IPO

    To value Instacart ahead of its IPO, I will start with a look at the prospectus filed by the company, which will give me a chance to unload on my pet peeves about how these disclosures have evolved over time, then look at the operating history and unit economics at the company, before settling in on a valuation story (and valuation) of the company.

Prospectus Pet Peeves

    About two years ago, I wrote a post on what I called the disclosure dilemma, where the more companies disclose, the less informative these disclosures become. As part of the post, I talked about trends in IPO prospectuses over time, and the Instacart prospectus gives me a chance to revisit some of those trends that I highlighted. 

  1. Disclosure Diarrhea: Apple and Microsoft, when they filed for their initial public offerings in the 1980s, had prospectuses that were less than 100 pages apiece; Apple weighed in at 73 pages and Microsoft had only 52. In 1997, when Amazon filed for a public offering, its prospectus was 47 pages long. I noted that prospectuses have become more and more bulky over time, with Airbnb's 2020 listing including a prospectus that was 350 pages long. With appendices, Instacart's prospectus stretches on to 416 pages.
  2. “Tech” and AI: In common with many other companies that have gone public in the last decade, Instacart is quick to label itself a technology company, when the truth is that it is a grocery delivery company that uses technology to smooth the ride. In keeping with the times, the prospectus mentions AI multiple times, I counted 32 mentions of AI in the prospectus, and I remain skeptical that AI will (or should) alter grocery shopping in fundamental ways.
  3. Adjusted EBITDA: I have written about the absolute foolishness of adding back stock-based compensation to get to adjusted earnings, noting that stock-based compensation is not a neutral non-cash expense (like depreciation) but one that an expense-in-kind, where you give away equity in your company to employees, either as options or as restricted stock. Needless to say, Instacart plows right ahead and not only adds back stock-based compensation but makes a host of other adjustments (see page 126 of prospectus). Since Instacart makes money without these adjustments, they only draw attention away from that good news.
  4. Share count shenanigans: On page 19 of the prospectus, Instacart headlines that its share count will be 279.33 million shares, if the underwriters exercise their options, but two pages later (on page 21) the company discloses that it does not count restricted stock units, which are shares in existence that still have restrictions on trading or waiting to be vested, options and shares issuable on conversion of preferred shares. Adding these exception together, you get an ignored share count of 43.62 million, which brings the total share count to 322.94 million shares.
To give the company credit on useful disclosures, the company has followed the lead of other user-based companies in providing a cohort table (see page 111) on platform users (tracing how usage changes as users stay on the platform) and on unit economics (the size of an order, with the costs of filling it), but that good disclosure is hidden behind layers of flab.

An Operating History

    For young companies, you learn less by browsing through financial history than with much more mature companies, but it in instructive to look at the pathway that Instacart has taken to arrive at its current position.  For close to seven years after its founding in 2012, Instacart struggled to find its footing with customers, as relatively few were willing to jump on the online grocery shopping bandwagon. Coming into 2020, the  company had about 50 million subscribers and $215 million in revenues, and the $5.1 billion that customers spent on groceries on its platform was a tiny fraction of the $800 billion US grocery market. In a turn of fortune that I am sure that even Instacart did not see coming, the COVID shutdown changed the shopping dynamics. As homebound customers desperately looked for options to shop for and get groceries delivered at home, Instacart stepped into the fray, allowing user numbers, the value of gross transactions (GTV) and revenues to quadruple in 2020. 

It is undeniable that Instacart, like Zoom and Peloton, was a COVID winner, but like those companies, it has struggled to build on those winnings and deliver on the resulting unrealistic expectations. The good news for Instacart is that many of the customers who joined its platform at the height of COVID have stayed on, but the bad news is that growth has leveled off in the years since, and especially so leading into the initial public offering.
    As subscribers and grocery sales on the Instacart platform grew between 2019 and 2023, its business model has also been taking form, turning from losses to a measure of profitability in the twelve months leading into the offering:

Instacart Prospectus
Note again, though, that the bulk of the improvement in operating metrics occurred in 2020, and while the numbers have continued to improve since 2020, the change has been marginal. To understand the drivers of Instacart’s profitability over time, let us break down its components:
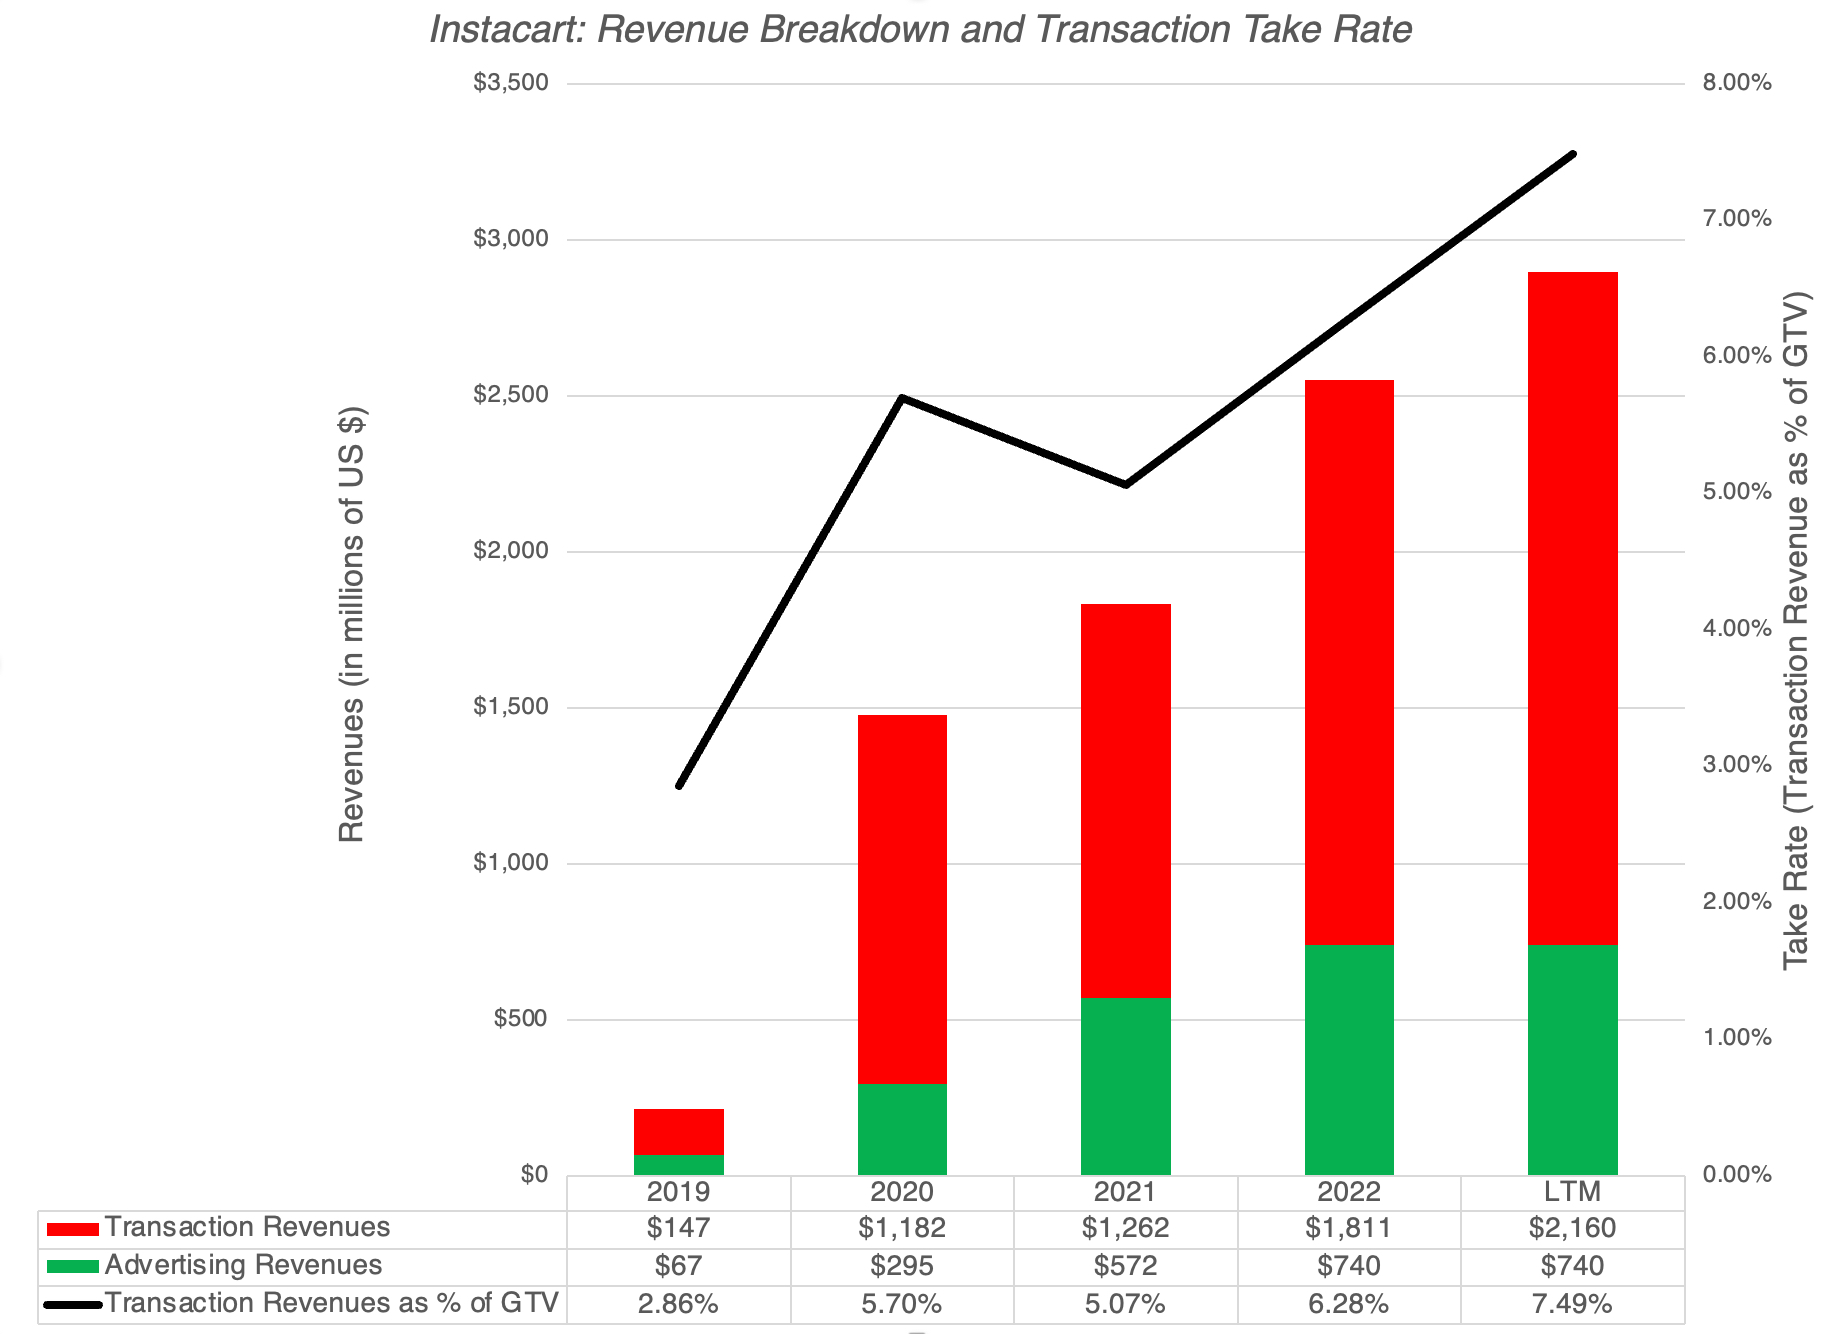
  1. Take Rate: When an grocery order is placed on the Instacart platform, the service fees that Instacart collects represent its revenues from transactions, and the take rate measures these revenues as a percentage of the transaction value. Instacart's take rate has improved over time, doubling from 2.86% in 2019 to 5.70% in 2020, before leveling off in 2021 and 2022, and then increasing again to 7.49% in the last twelve months of 2023.

    Just to provide a contrast, Airbnb and Doordash, two other companies in the intermediary business have much higher take rates at 14% and 11.79% respectively. Much of that difference, though, is unbridgeable for a simple reason: the grocery business has significantly lower operating margins (at 5%) than the hospitality  (15% in 2022)  or restaurant businesses (16% in 2022). Put simply, Instacart's take rate will be lower, even with full economies of scale at play, than its counterparts in businesses with more profit buffer.
  2. Operating expenses: The revenues that Instacart collects, from transactions and advertising, are used to cover its operating expenses, which are broken down into three categories: cost of goods sold, operations and support and G&A:

    There are economies of scale that kicked in, in 2020, and the good news is that those economies of scales continued to benefit the company in 2021 and 2022, as all three categories of expense decreased, as a percent of sales. 
  3. Customer Acquisition and Reinvestment:  Growth comes with reinvestment, and in the case of Instacart, as with many other tech companies, that reinvestment is embedded in its operating expenses (instead of capital expenses), since their two biggest capital expenditures are the costs of acquiring new subscribers (shown as part of sales and marketing) and investments in technology/platform (shown as R&D). 

    Looking at the customer acquisition (selling) costs alone, there is evidence that these costs, in dollar terms and as a percent of revenues, after the steep drop off in 2020, are rising over time, indicating that there are more competitors for new online grocery shoppers.  If you add to that the same trend in R&D spending, it does look like the company is working harder and spending more to deliver growth after the COVID boost in 2020.
  4. Unit Economics: With transaction-based businesses, like Instacart, understanding how the unit economies (on individual orders and platform users) are evolving over time can be useful in forecasting the future. Looking across Instacart's entire history, the typical order size has remained remarkably stable, at around $100, with the spurt in 2020 being the exception.
    Instacart Prospectus

    On an inflation-adjusted basis, especially in 2021 and 2022, the average order size has decreased over time. That, by itself, may not be a problem, if Instacart customers are ordering more often, especially as they stay on the platform for longer, and to answer this, I look at Instacart's estimates of revenues, by cohort class:
    Instacart Prospectus
The good news is that customers who joined the platform in 2017, 2018, 2019 and 2021 spend more on the platform, the longer they are on it. The bad news is that customers in joined in 2020, Instacart's biggest year of growth in users, are spending less on the platform in 2021 and 2022, indicating that some of the COVID gains are slipping away. That should not be surprising, since many customers who used Instacart in 2020 did so only because they had no alternatives, and once the shutdown ended, returned to old habits.

    As the company has struggled, coming off its COVID high, there has been turnover in its management ranks. Apoorva Mehta, who founded the company and oversaw its COVID growth, stepped down as CEO of the company in 2022, and was replaced with Fido Simo, a Facebook executive, with the impetus for the change rumored to have come from Sequoia, the biggest single stockholder in the company. Before you instinctively jump to the defense of founders, like Mr. Mehta, it is worth noting that he owned only 10% of the outstanding shares in the company in 2022. In short, scaling up and high growth often require large capital infusions, and a side cost almost always will be a reduction in founder control of the company. 

The Valuation Story & Intrinsic Value

    With that long lead-in, I have the basis for my Instacart story, and it reflects both the good and bad news in the company's operating history. 

  1. Growth: To estimate revenue growth at Instacart, I think it makes sense to break down revenues into transaction revenues and advertising revenues, with the former coming from service fees and subscriptions, and the latter from ads. To estimate transaction revenues, I will assume that gross transaction value on the platform will track growth in online grocery retailing, which seems to have settled into a compounded annual growth rate of about 12%, for the next five years. I will assume that Instacart will maintain its market share of the online grocery market, in the face of competition, but only by cutting its fees and accepting a take rate of 6%, by year 5, down from 7.5% in the trailing 12 months. Advertising revenues, though, are assumed to keep track with gross transactions on the platform.
  2. Profitability: Drawing on the company's history of delivering economies of scale on cost of goods sold and operations support, I will assume that the company will be able to improve its operating margins over time to 25%. The tensions between Instacart and its shoppers, as well as push back from grocery stores, will keep a lid on these margins and prevent further improvement.
  3. Reinvestment: As user growth levels off, I expect the company to revert to its capital-light origins, and spend far less on customer acquisitions, as well as on acquisitions. This allows me to assume that the company will be able to deliver $3.13 in revenues, for every dollar invested, roughly matching the global industry average.
With these assumptions in place, the value that I get for the company is shown below:

My Instacart Valuation

With my story and inputs, the value per share that I get for Instacart is about $29, close to the offer price being floated of $30 per share. 
    There is, of course, the very real possibility that I could be wrong on my estimates (in either direction) of key inputs: the growth in GTV, the take rate, the operating margin and the cost of capital, and to account for this uncertainty, I fall back on a simulation:


As you can see, at the offer price of $30/share, the company is priced close to its median value, and the distribution of values suggests that there is less upside in this company than in some of the other growth companies I have valued in recent years.

The Offering

    Instacart was expected to hit the market on September 19, and the reception that it gets may tell us as much about the market, as it does about the company. In my posts on the market, starting mid-year last year and extending into this one, I noted that risk capital had retreated o the sidelines, and one of the statistics that I used was the number of IPOs hitting the market. After hitting an all-time high in 2021, the IPO market has frozen, and the ARM, Instacart and Birkenstock IPOs hitting the market in September may be a sign of a thaw. That sign will become stronger, if the offerings are well received and there is a price pop on the offering. 

Pricing versus Investing

    I have long argued that IPOs are priced, not valued, notwithstanding the lip service that everyone involved in the process, including VCs, founders and bankers, pays to valuation, The difference between valuing and pricing is that while the former requires that you grapple with business questions on growth, profitability and reinvestment, the latter is based on how much investors are paying for peer group companies, a subjective judgment, but one made nevertheless. In keeping with this theme, I compared the proposed pricing for Instacart against the pricing of its peer group. That peer group is not other grocery companies, since the Instacart model is very different, but other intermediary companies like Airbnb and Doordash, which like Instacart, take a slice of transaction revenues in the markets they serve, and try to keep costs under control:

While Instacart looks cheap, relative to Doordash and Airbnb, this pricing is an illustration of the limits of the approach.  Instacart trades at a much lower multiple of revenues, because its take rate (as a percent of gross transaction value) is much lower than the slices that Doordash and Airbnb keep. Airbnb keeps 14% of gross transaction value, Doordash keeps more than 11.79%, but Instacart keeps only 7.5%, if advertising revenues are excluded. Instacart and Doordash both trade at lower multiples of revenues than Airbnb, but that is because Airbnb has higher expected growth and higher operating margins in steady state.    

Previewing the Offering

  Since pricing is about mood and momentum, it is worth looking at the ARM IPO offering on September 14, which saw the company's stock price, which was offered at $51, open for trading at $56.10 and close the dat at $63.59. If that mood spills over into this week, I expect Instacart's IPO to pop on its opening day as well, especially given the fact that the offering price seems to reflect a relatively conservative outlook for the company, and the pricing looks favorable. Even if it does not, I don't see much benefit to buying the stock at the offering price, not only because it looks fairly valued, but also because I don't see enough of an upside, even if things work out in the company's favor. 

    The question of what the market will do became moot, even as I was finishing this post, the stock started trading(September 19), and popped to $42 per share, before giving back some of its gains to settle at about $38 per share. At those prices, you would need more upbeat assumptions about online grocery growth and take rates than I am willing to make, but with this market, who knows? The stock may be trading at a discount on value, a week from now. 

The VC Game

    In the last decade, we have raised venture capital to "great investor" status, driven by stories of investments that have paid off in huge returns. In fact, good venture capitalists are often viewed as shrewd assessors of business potential, capable of separating the wheat from the chaff, when it comes to start-ups. That is true for some of them, but I believe that venture capital is a pricing game, with little heed paid to value, and that  the most successful venture capitalists share more traits with great traders, than with great investors. Not only are the best venture capitalists good at pricing the businesses they invest in, honing in on to the traits that are being priced in (users, subscribers, downloads etc.), but are just as good at making sure that these business scale up these traits. Their success comes from timing skills, entering a business at the right time and just as critically, exiting before the momentum shifts.

    Instacart's multiple venture capital rounds illustrates this process well, and you can see the pricing of the company at each round below:

The earliest providers of capital to the company will walk away with substantial profits, even if the company's market cap ends up at $9 - $9.5 billion, as indicated by the offering price. The seed capital providers (Khosla, Canaan and Y Combinator) will have earned at 55% compounded annual return on their investment, at the IPO offering price, well in excess of the S&P 500 annual return of 13.04% over the same period. Every subsequent round earns a lower annual return, and all investments in Instacart made after 2015 have underperformed the S&P 500 significantly, and the NASDAQ by even more.  The biggest losers in this capital game have been those who provided capital in 2020 and 2021, when COVID pushed up both capital needs and company pricing to new highs. The Series I investment in 2021, when the company was priced at $39 billion,will see markdowns in excess of 60%. While there is no redeeming grace for Fidelity and T. Rowe Price, it is true that Sequoia also invested earlier in the company, and will walk away with substantial returns on its total investment. Thus, the write down that Sequoia takes for its $300 million investment in 2021 will be more than offset by the gains it made on the $21 million that it invested in the company in 2013 and 2014. 

   The notion that there is smart money, i.e., that there is an investor group that is somehow wiser, more informed and less likely to act emotionally than the rest of us, and that it earns higher returns than the rest of us, is deeply held. In my view, it is a mirage, since every group that is anointed as smart money ultimately ends up looking average (in terms of behavior and returns), when all is said and done. It happened to mutual fund managers decades ago, and it has happened to hedge funds and private equity over the last two decades. For those who are holding on to the belief that venture capitalists are the last bastion of smart money, it is time to let go. While there are a few exceptions, venture capitalists for the most part are traders on steroids, riding the momentum train, and being ridden over by it, when it turns. 

YouTube Video

Instacart files

  1. Instacart Prospectus
  2. My Instacart Valuation


Friday, July 1, 2022

Risk Capital and Markets: A Temporary Retreat or Long Term Pull Back?

As inflation has taken center stage, markets have gone into retreat globally, and across asset classes. In 2022, as bond rates have risen, stock prices have fallen, and crypto has imploded, even true believers are questioning what the bottom for markets might be, and when we will get there. While it is easy to call the market movement in 2022 a correction and to argue that it is overdue, it is facile, and it fails to address the question of why it is happening now, and whether the correction is overdone or has more to go. In this post, I will argue that almost everything that we are observing in markets, across asset classes, can be explained by a pull back on risk capital, and that understanding the magnitude of the pull back, and putting in historical perspective, is key to gauging what is coming next.

Risk Capital: What is it?

To put risk capital in perspective, it is best to start with a definition of risk that is comprehensive and all-inclusive, and that is to think of risk as a combination of danger (downside) and opportunity (upside) and to consider how investments vary in terms of exposure to both. In every asset class, there is a range of investment choices, with some being safer (or even guaranteed) and others being riskier.

Risk capital is the portion of capital that is invested in the riskiest segments of each market and safety capital is that portion that finds its way to the safest segments in each market

While risk and safety capital approach the market from opposite ends in the risk spectrum, one (safety capital) being driven by fear and the other (risk capital), by greed, they need to not only co-exist, but be in balance, for the market to be healthy. When to two are not in balance, these imbalances can have profound and often unhealthy effects not just of markets, but also on the overall economy. At the extremes, when risk capital is absent and everyone seeks safety, the economy and markets will atrophy, as businesses and investors will stay away from risky ventures, and when risk capital is too easy and accessible, risky asset prices will soar, and the economy will see too much growth in its riskiest segments, often at the expense of more stable (and still necessary) businesses.

Risk Capital's Ebbs and Flows

It is a common misconception that the risk-takers supply risk capital (risk takers) and that the investors who invest for safety draw from different investor pools, and that these pools remain unchanged over time. While investor risk aversion clearly does play a role in whether investors are drawn to invest in risk or safety capital, it obscures two realities:

  1. Variation within an investor's portfolio: Many investors, including even the most risk averse, may and often do  set aside a portion of their portfolios for riskier investments, drawn by the higher expected returns on those investments. For some investors, this set aside will be the portion that they can afford to lose, without affecting their life styles in any material way. For others, it can be the portion of their capital with the longest time horizon (pension fund savings or 401Ks, if you are a young investor, for example), where they believe that any losses on risk capital can be made up over time. For still others, it is that segment of their portfolios that they treat las long shot gambles, hoping for a disproportionately large payoff, if they are lucky. The amount that is put into the risk capital portion will vary with investor risk aversion, with more risk averse investors putting less or even nothing into the riskiest assets, and less risk averse investors putting in more.
  2. Variation across time: The amount that investors are willing to put into risk capital, or conversely redirect to safety capital, will change over time, with several factors playing a role in determining whether risk capital will be plentiful or scarce. The first is market momentum, since more money will be put into the riskiest asset classes, when markets are rising, because investors who benefit from these rising markets will have more capital that they are willing to risk. The second is the the health and stability of the economy, since investors with secure jobs and rising paychecks are more willing to take risks. 

There are two macro factors that will come into play, and both are in play in markets today. The first is the return that can be earned on guaranteed investments, i.e., US treasury bills and bonds, for instance, if you are a investor in US dollar, since it is a measure of what someone who takes no or very low risk can expect to earn. When treasury rates are low or close to zero, refusing to take risk will result in returns that are very low or close to zero as well, thus inducing investors to expose themselves to more risk than they would have taken in higher interest rate regimes. The second is inflation, which reduces the nominal return you make on all your investments, and the effects of rising inflation on risk capital are complex. As expected inflation rises, you are likely to see higher interest rates, and as we noted above, that may induce investors to cut back on risk taking and focus on earning enough to cover the ravages of inflation. As uncertainty about inflation rises, you will see reallocation of investment across asset classes, with real assets gaining when unexpected inflation is positive (actual inflation is higher than expected), and financial assets benefiting when unexpected inflation is negative (actual inflation is less than expected).

And Consequences

    If you are wondering why you should care about risk capital's ebbs and flows, it is because you will feel its effects in almost everything you do in investing and business. 

  1. Risk Premiums: The risk premiums that you observe in every risky asset market are a function of how much risk capital there is in play, with risk premiums going up when risk capital becomes scarcer and down, when risk capital is more plentiful. In the bond and loan market, access to risk capital will determine default spreads on bonds, with lower rated bonds feeling the pain more intensely when risk capital is withdrawn or moves to the side lines. Not only will default spreads widen more for lower-rated bonds, but there will be less bond issuances by riskier companies. In the equity market, the equity risk premium is the price of risk, and its movements will track shifts in risk capital, increasing as risk capital becomes scarcer. 
  2. Price and Value Gaps: As those of you who read this blog know well, I draw a contrast between value and price, with the former driven by fundamentals (cash flows, growth and risk) and the latter by mood, momentum and liquidity. The value and price processes can yield different numbers for the same company, and the two numbers can diverge for long periods, with convergence not guaranteed but likely over long periods.

    I argue that investors play the value game, buying investments when the price is less than the value and hoping for convergence, and that traders play the pricing game, buying and selling on market momentum, rather than fundamentals. At the risk of generalizing, safety capital, with its focus on earnings and cash flows now, is more likely to focus on fundamentals, and play the investor game, whereas risk capital, drawn by the need to make high returns quickly, is more likely to play the trading game. Thus, when risk capital is plentiful, you are more likely to see the pricing game overwhelm the value game, with prices often rising well above value, and more so for the riskiest segments of every asset class. A pull back in risk capital is often the catalyst for corrections, where price not only converges back on value, but often overshoots in the other direction (creating under valuations). It behooves both investors and traders to therefore track movements in risk capital, since it is will determine when long term bets on value will pay off for the former, and the timing of entry into and exit from markets for the latter.
  3. Corporate Life Cycle: The ebbs and flows of risk capital have consequences for all businesses, but the effects will vary widely across companies, depending on where they are in the life cycle. Using another one of my favorite structures, the corporate life cycle, you can see the consequences of expanding and shrinking risk capital, through the lens of free cash flows (and how they vary across the life cycle).

    Early in the corporate life cycle, young companies have negative free cash flows, driven by losses on operations and investments for future growth, making them dependent on risk capital for survival and growth. As companies mature, their cash flows first become self sustaining first, as operating cash flows cover investments, and then turn large and positive, making them not only less dependent on risk capital for survival but also more valued in an environment where safety capital is dominant. Put simply, as risk capital becomes scarcer, young companies, especially those that are money-losing and with negative cash flows, will see bigger pricing markdowns and more failures than more mature companies.

Risk Capital: Historical Perspective

How do you track the availability and access to risk capital over time? There are three proxies that I will  use, and while each has its limitations, read together, they can provide a fuller measure of the ebbs and flows of risk capital. The first is funds invested by venture capitalists, with a breakdown further into types, from pre-seed and seed financing to very young companies to capital provided to more young companies with more established business models, as a prelude to exit (acquisition or IPO). The second is the trend line in initial public offerings (number and value raised), since companies are more likely to go public and be able to raise more capital in issue proceeds, when risk capital is plentiful. The third is original bond issuances by the riskiest companies (below investment grade and high yield), since these issuances are more likely to have a friendly reception when risk capital is easily available than when it is not.

Let’s start with venture capital, the typical source of capital for start ups and young companies for decades in the United States, and more recently, in the rest of the world. In the graph below, I trace out total venture capital raised, by year, between 1995 and 2021, in the US: 

Source: NVCA Yearbooks
The dot-com boom in the 1990s created a surge in venture capital raised and invested, with venture capital raised peaking at more than $100 billion in 2000, before collapsing as the that bubble burst. The 2008 banking and market crisis caused a drop of almost 50% in 2009, and it took the market almost five years to return to pre-crisis levels.   In the just-concluded decade, from 2011 to 2020,  the amount raised and invested by venture capitalists has soared, and almost doubled again in 2021, from 2020 levels, with venture capital raised in 2021 reaching an all-time high of $131 billion, surpassing the 2000 dot-com boom levels, albeit in nominal terms. Along the way, exits from past venture capital investments, either in IPOs or in M&A, have become more lucrative for the most successful companies, with 43 exits that exceeded a billion (the unicorn status) in 2021. 

If success in venture capital comes from exiting investments at a higher pricing, initial public offerings represent the most lucrative route, and tracking the number of initial public offerings over time provides a window on the ebbs and flows of risk capital, over long periods. Using data made public by Jay Ritter on IPOs, I track the number of IPO and dollar proceeds from offerings in the graph below from 1980 to 2021:
Source: Jay Ritter
As you can see, IPOs go through hot periods (when issuances surge) and cold ones (when there are relatively few listed), with much of the last decade representing hot periods and 2000/01 and 2008/09 representing periods when there were hardly any offerings. While the number of IPOs in 2021 is still below the peak dot-com years, the proceeds from IPOs has surged to an all-time high during the year.

    In the final graph, I look at corporate bond offerings, broken down into investment grade and high yield, by year, from 1996 to 2021:

Source: SIFMA

Here again, you see a familiar pattern, with the percentage of high-yield bond issuances tracking the availability of risk capital. As with IPOs, you see big dips in 2000-01and 2008-09, reflecting market corrections and crises, and a period of easy access to risk capital in the last decade. Again, the percentage of corporate bond issuances hit an all-time high in 2021, representing more than a quarter of all bond issuances. In sum, all three proxies for risk capital show the same patterns over time, pulling back and surging during the same time periods, and with all three proxies, it is clear that 2021 was a boom year.

An Update

The last two and a half years may not represent much time on a historical scale, but the period has packed in enough surprises to make it feel like we have aged a decade. We started 2020 with a pandemic that altered our personal, work and financial lives, and in 2022, at least in North America and Europe, we have seen inflation reach levels that we have not seen for decades. Looking at the 30 months through the lens of risk capital can help us understand not only the journey that markets have gone through to get where they are today, but also perhaps decipher where they may go next. In the graph below, I look at venture capital, IPOs and high yield bond issuances over the last two and a half years:


The first thing to note is that there was a pullback on all three measures in the first quarter of 2020, as COVID put economies into deep freeze and rolled markets. The big story, related to COVID, is that risk capital not only did not stay on the side lines for long but came surging back to levels that exceeded pre-COVID numbers, with all three measures hitting all-time highs in 2021. In a post in late 2020, I argued that it was the resilience of risk capital that explained why markets recovered so quickly that year, even as the global economy struggled, that year, and pointed to three explanatory factors. The first was the perception that the COVID shut-down was temporary, and that economies would come back quickly, once the immediate threat from the virus passed. The second was the decline in interest rates across the globe, with rates in developed market currencies (US $, Euro, Japanese Yen etc.) moving towards zero, increasing the costs of staying on the sidelines.  The third was a change in investor composition, with a shift from institutional to individual investor market leadership, and increased globalization.

    The first half of 2022 has been a trying period for markets, and as inflation has risen, it is having an effect on the availability of and access to risk capital. There has been a pullback in all three proxies for risk capital, albeit smaller in venture capital, than in IPOs and in high-yield bond issuances in the first few months of 2022. That pullback has had its consequences, with equity risk premiums rising around the world. In the graph below, I have updated the equity risk premium for the S&P 500 through the start of July 2022:

Spreadsheet for implied ERP

The chart reveals how unsettling this year has been for equity investors, in the United States. Not only has the implied ERP surged to 6.01% on June 23, 2022, from 4.24% on January 1, 2022, but stocks are now being priced to earn 9.03% annually, up from the 5.75% at the start of the year. (The jump in ERP may be over stated, since the forward earnings estimates for the index, from analysts, does not seem to be showing any upcoming pain from an expected recession. )

As inflation and recession fears have mounted, equity markets are down significantly around the world, but the drop in pricing has been greatest in the riskiest segments of the market. In the table below, I look at the price change in the first six months of 2022 for global stocks, broken down by quintiles, into net profit margin and revenue growth classes:
Source for raw data: S&P Cap IQ

Note that high growth, negative earnings companies have fared much worse, in general, during the 2022 downturn, than more mature, money-making companies.  The fear factor that is tilting the balance back to safety capital from risk capital has also had clear consequences in the speculative collectibles space, with cryptos bearing the brunt of the punishment. Finally, there are markdowns coming to private company holdings, both in the hands of venture capitalists, and public market investors (including mutual funds that have been drawn into this space and public companies like Softbank).

    The big question that we all face, as we look towards the second half of the year, is whether the pullback in risk capital is temporary, as it was in 2020, or whether it is more long term, as it was after the dot-com bust in 2000 and the market crisis in 2008. If it is the former, there is hope of not just a recovery, but a strong rebound in risky asset prices, and if it is the latter, stocks may stabilize, but the riskiest assets will see depressed prices for much longer. I don't have a crystal ball or any special macro forecasting abilities, but if I had to guess, it would be that it is the latter. Unlike a virus, where a vaccine may provide at least the semblance of a quick cure (real or imagined), inflation, once unleashed, has no quick fix. Moreover, now that inflation has reared its head, neither central banks nor governments can provide the boosts that they were able to in 2020 and may even have to take actions that make things worse, rather than better, for risk capital. Finally, at the risk of sounding callous, I do think that a return of fear and a longer term pullback in risk capital is healthy for markets and the economy, since risk capital providers, spoiled by a decade or more of easy returns, have become lazy and sloppy in their pricing and trading decisions, and have, in the process, skewed capital allocation in the economy. If a long-term slowdown is in the cards, it is almost certain that the investment strategies that delivered high returns in the last decade will no longer work in this new environment, and that old lessons, dismissed as outdated just a few years go, may need to be relearned. 

YouTube Video


Thursday, April 21, 2022

Elon's Twitter Play: Valuation and Corporate Governance Consequences

I am not a prolific user of social media platforms, completely inactive on Facebook and a casual lurker on LinkedIn, but I do use Twitter occasionally, and have done so for a long time, with my first tweet in April 2009, making me ancient by Twitter standards. That said, I tweet less than ten times a month and follow only three people (three of my four children) on the platform. I am also fascinated by Elon Musk, and even more so by his most prominent creation, Tesla, and I have valued and written about him and the company multiple times. When Musk made news a little over two weeks ago, with his announcement that he owned a major stake in Twitter, I could not stay away from the story, and what's happened since has only made it more interesting, as it casts light on just Musk and Twitter, but on broader issues of the social and economic value of social media platforms, corporate governance, investing and how politics has become part of almost every discussion.

The Twitter Story

To get a measure of Musk's bid for Twitter, you have to also understand the company's path to its current status. In this section, I will focus on the milestones in the company's history that shape it today, with an eye on how it may affect how this acquisition bid plays out.

Inception to IPO

Twitter was founded in 2006 by Jack Dorsey, Noah Glass, Biz Stone and Evan Williams, and its platform was launched later that year. It succeeded spectacularly in attracting people to its platform, hitting a 100 million users in 2012, and then doubling those numbers again by 2013, when it went public ,with an initial public offering. In a post on this blog on October 5, 2013, I valued Twitter, based on the numbers in its prospectus:

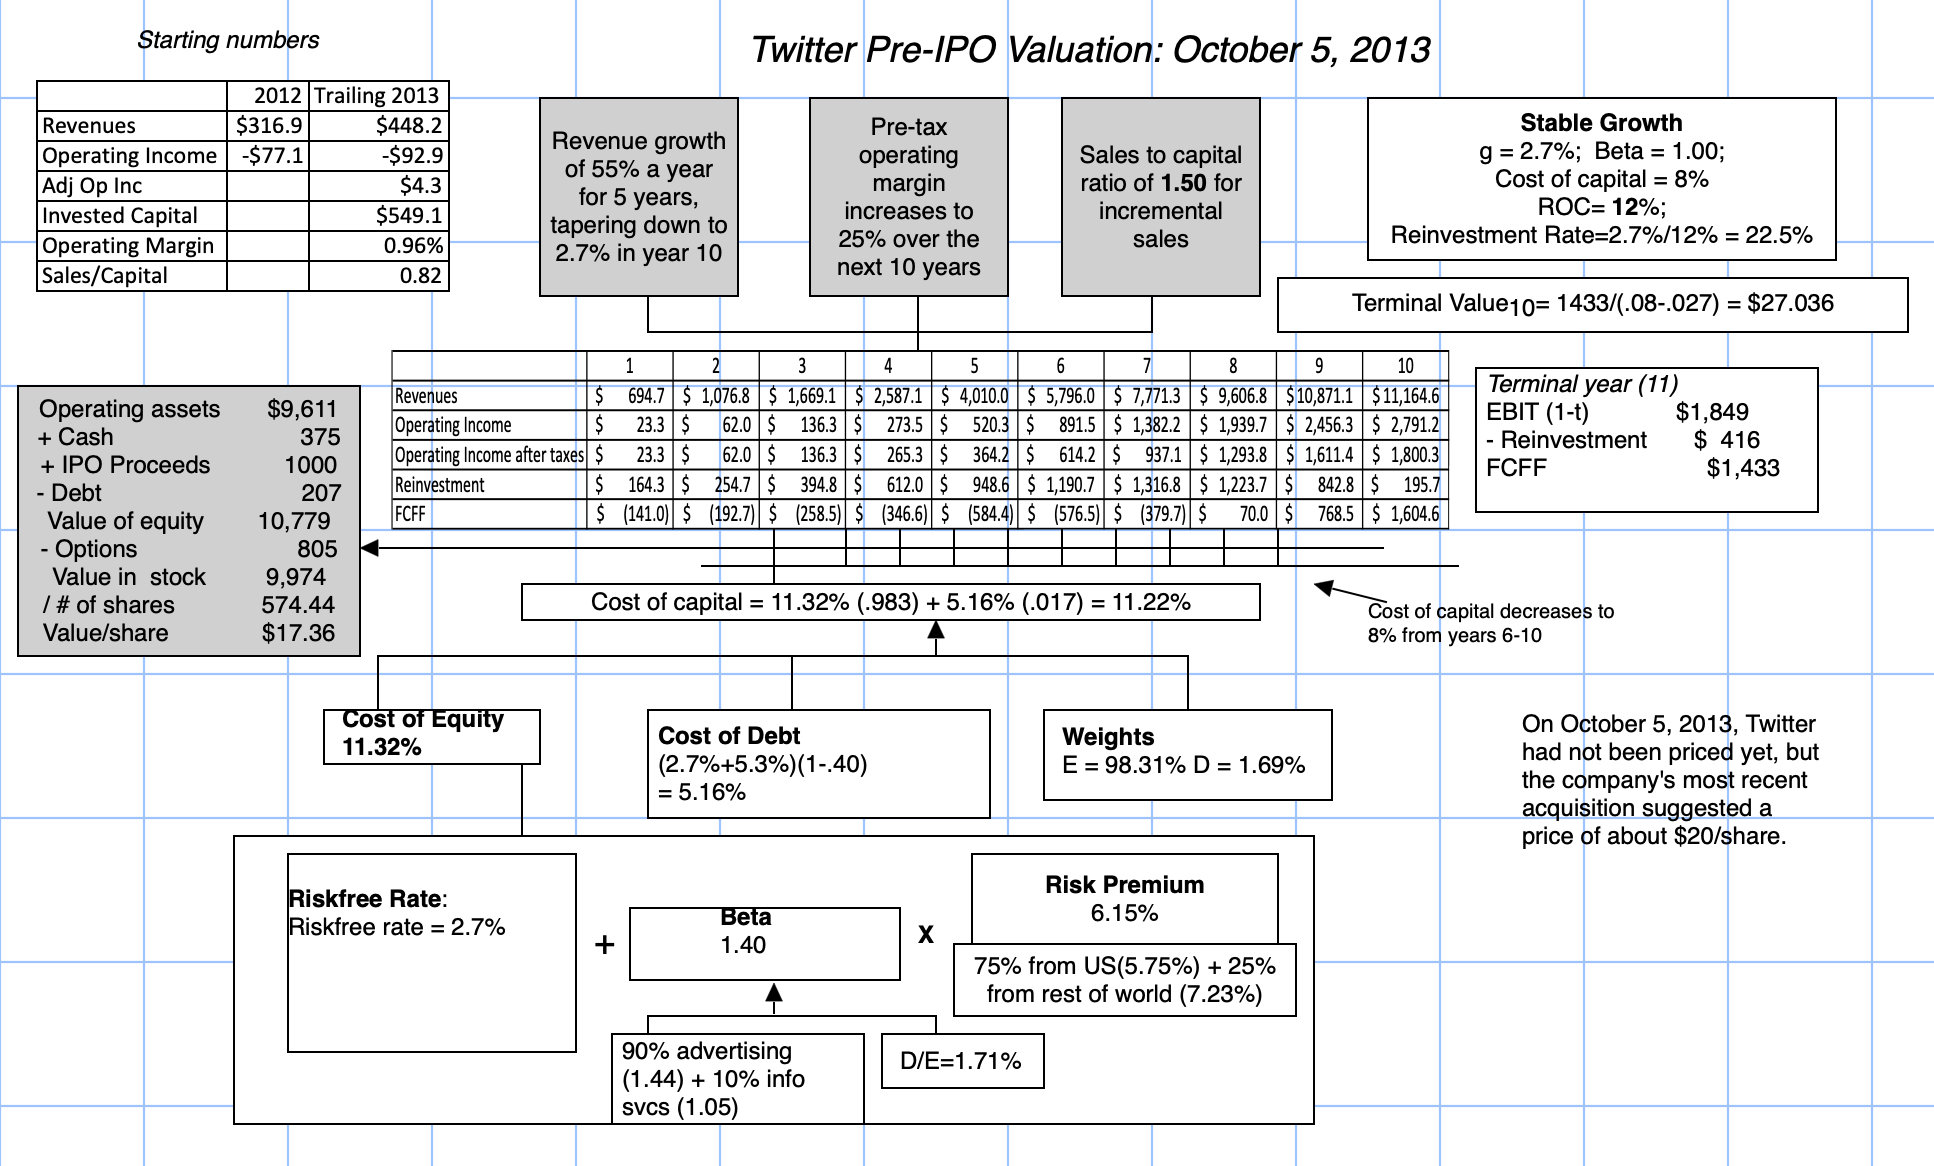
Spreadsheet with valuation

In keeping with my belief that every valuation tells a story, my IPO valuation of Twitter in October 2013 reflected my story for the company, as a platform with lots of users, that had not yet figured out how to monetize them, but would do so over time. My forecasted revenues for 2023 of $11.2 billion and predicted operating margin of 25% in that year reflected my optimistic take for the company, with substantial reinvestment (in acquisitions and technology) needed along the way (as seen in my reinvestment). A few weeks later, the offering price for Twitter's shares was set at $26, by its bankers, and the stock debuted on November 7, 2013, at $45. In the weeks after, that momentum continued to carry the stock upwards, with the price reaching  $73.31 by December 26, 2013. 

If the story had ended then, the Twitter story would have been hailed as a success, and Jack Dorsey as a visionary. But the story continues...

The Rise and Fall of Jack Dorsey

In the years since its IPO, the Twitter story has developed in ways that none of its founders and very few of its investors would have predicted. On some measures of user engagement and influence, it has performed better than expected, but in the operating numbers measuring its success as a business, it has lagged, and the market has responded accordingly

Users: Numbers and Engagement

In terms of user numbers, Twitter came into the markets as a success, with 240 million people on its platform in November 2013, at the time of its public offering. In the years since, those user numbers have grown, as can be seen in the chart below:

In keeping with disclosure practices at other user-based companies, in 2017, Twitter also started tracking and reporting the users who were most active on its platform, by looking at daily usage, and counting daily active users (DAU). While total user numbers have leveled off in recent years, albeit with a jump in 2021, the daily active user count has continued to climb. 

Over the last decade, the company's platform, and the tweets that show up on it, became a ubiquitous part of news, culture and politics, as politicians used the platform to expand their reach and spread their ideas and celebrities built their personal brands around their followers. Looking at the list of the Twitter persona with the most followers provides some measure of its reach, with a mix of politicians (Barack Obama, Narendra Modi), musicians (Justin Bieber, Katy Perry, Taylor Swift, Ariana Grande), celebrities (Kim Kardashian) and sporting figures (Cristiano Ronaldo). Sprinkled in the list are brands/businesses (YouTube, CNN Breaking News), with millions of followers, though relatively few business people make the list, with Elon Musk being the exception.  It is worth noting that many of the people on top follower list tweet rarely, and that behavior is mimicked by many of the users on the platform, many of whom never tweet. The bulk of the tweets on the platform are delivered by a subset of users, with the top 10% of users delivering 80% of the tweets. 

While there are multiple reasons that Twitter users come to the platform, the demographics of its platform provides some clues, especially when contrasted with other social media platforms:

Pew Research

Twitter's user base skews younger, more male, more educated and more liberal than the US population, and especially so, when compared with Facebook, which has the biggest user base.

Revenues, Profits and Stock Prices

As Twitter user base and influence have grown, there has been one area where it has conspicuously failed, and that is on business metrics. The company's revenues have come primarily from advertising (90%) and while these revenues have grown, they have not kept up with user engagement, as can be seen in the chart below:

In the last few years, revenue growth has flattened, again with the exception of 2021, and while operating margins have finally turned positive in the last five years, there has been no sustained upward movement. To give a measure of Twitter's disappointing performance, note that the company's actual revenues in 2021 amounted to $5.1 billion, well below the $9.6 billion I estimated in 2021 (year 8 in my IPO valuation) as revenues in my IPO valuation of the company in November 2013, and its operating margin, even with generous assumptions on R&D, was 19.02% in 2021, still below my estimate of 19.76% in that year. 

The disappointments on the operating metric front has played out in markets, where Twitter's stock price dropped to below IPO levels in 2016 and its performance has lagged its social media counterparts:

Source: Bloomberg

In fact, Twitter's stock prices did not breach their December 2013 high of $73.31 until February 26, 2021, when the stock peaked at $77.06, before dropping back to 2013 levels again by the end of the year. The company that provides the best contrast to Twitter is Snapchat, another company that I valued at the time of its IPO in February 2017 at $14.4 billion, with a value per share of $10.91. Like Twitter, Snapchat had a rousing debut in the market, rising 40% to hit $24.48 on its first trading day, before falling on hard times, as Instagram undercut its appeal. The stock dropped below $6 in 2019, before mounting a comeback in 2021. While Snap is a younger company than Twitter, a comparison of the operating metrics and user numbers yields interesting results:

Looking at the 2021 numbers, Snap now has more daily active users than Twitter, but delivers less in revenues and is still losing money. That said, the market clearly either sees more value in Snap's story or has more confidence in Snap's management, since there is a wide gap in market capitalizations, with Snap trading at a premium of 60% over Twitter.

Corporate governance

While Twitter can be faulted on many of its actions leading into and after its IPO, there is one area where credit is due to the company. In a period when companies, especially in the tech sector, fixed the corporate governance game in favor of insiders and incumbents, by issuing shares with different voting classes, Twitter stuck to the more traditional model, with equal voting right shares.  It is also worth noting that Twitter came into its IPO, with a history of bloodletting at the top, with Jack Dorsey, who led the company at the start, getting pushed aside by Evan Williams, his co-founder, before reclaiming his place at the top. In fact, at the time of its IPO, Twitter's CEO was Dick Costolo, but he was replaced by Dorsey again, a couple of years later. Dorsey's founder status gave him cover, but his ownership stake of the company was not overwhelming enough to stop opposition. As disappointment mounted at the company, the murmuring of discontent became louder among Twitter shareholders, especially since Jack divided his top executive duties across two companies, Twitter and Square, both of which demanded his undivided attention.  

The corporate governance issues at Twitter came to a head in 2020, when Elliott Management, an activist hedge fund, purchased a billion dollars of Twitter stock, and demanded changes. While Dorsey was successful in fighting off their demands that he step down, he surprised investors and may company employees when he stepped down in November 2021, claiming that he was leaving of his own volition. That may be true, but it seemed clear that the relationship between Dorsey and his board of directors had ruptured, and that the departure might not have been completely voluntary. As a replacement, the board did stay within the firm in picking a successor, Parag Agrawal, who joined Twitter as a software engineer in 2011 and rose to become Chief Technology Officer in 2017.

The Musk Entree!

It is ironic that the threat to Twitter has come from Elon Musk, who has arguably used its platform to greater effect than perhaps anyone else on it. There are some Twitter personalities who have more followers than Musk, but most of them are either inactive or tweet pablum, but Musk has made Twitter his vehicle for selling both his corporate vision and his products, while engaging in distractions that sometimes frustrate his shareholders. While he has made veiled promises of alternative platforms for expression, it was a surprise to most when he announced on April 4, 2022, that he had acquired a 9.2% stake in the company. Stock prices initially soared on the announcement, but what has followed since has been one of the strangest corporate chronicles that I have ever witnessed, as you can see in the time line below:

This post is being written on April 19, and the only thing that is predictable is that everything is unpredictable, at the moment, and that should come as no surprise, when Musk is involved.

The Value Arguments: Status Quo and Potential

While Musk's acquisition bid is anything but conventional, the gaming that it initiated on the part of Twitter, the target company, and Musk, the potential acquirer, was completely predictable. The company's initial response was that it was worth great deal more than Musk's offering price, and that Twitter shareholders would be receiving too little for their shares if they sold. Musk's response was that the market clearly did not believe that current management could deliver that higher value, and that he would be able to do much better with the platform.

Twitter's argument that Musk was lowballing value, by offering $54.20 per share for the company,  and that the company was worth a lot more is not a novel one, and it is heard in almost every hostile acquisition, from target company management. That argument can sometimes be true, since markets can undervalue companies, but is it the case with Twitter? To answer that question, I valued Twitter on April 4, at about the time that Musk announced his 9.2% stake, updating my story to reflect a solid performance from the company in 2021, and with Parag Agrawal, its newly anointed CEO:

Spreadsheet with Twitter Status Quo Value

In my story, which I view as upbeat, given Twitter's inability to deliver on operating metrics in the last decade, I see continued growth in revenues, with revenues reaching almost $13 billion in 2033, and a continued increase in operating margins to 25%, not quite the levels you see at the dominant online advertising players (Facebook and Google), but about what you would expect for a successful, albeit secondary, online advertising platform. (Note that I am capitalizing R&D expenses to give the company healthier margins right now, to begin my valuation). The value per share that I obtained was about $46, $ 4 higher than the prevailing stock price, but below Musk's acquisition offer of $54.20.

To the critique that revenue growth could surprise and that margins could be higher, my answer is of course, and to incorporate the uncertainty in my inputs, I fell back on one of my favored devices for dealing with uncertainty, a Monte Carlo simulation. I picked three variables, the revenue growth over the next five years, the target operating margin and the initial cost of capital, to build distributions around, and the results of the simulation are below:

The median value in the simulation is $45.17, close to the base case valuation, but at least based on my estimates, Musk's offering price is at the 75th percentile of value. It is possible that the value could be higher but making that is not a particularly strong argument to make, if you are Twitter's board.

Competing Views: The Fight for Twitter

As a company that has lived its entire life on the promise of potential, it should come as no surprise if that is where the next phase of this argument heads. In particular, Twitter's management will claim that the company's platform has the potential to deliver significantly more value, either by changing the business model (and including subscriptions and other revenue sources) or fine tuning the advertising model. On this count, Musk will agree with the argument that Twitter has untapped potential, but counter that he (and only he) can make the changes to Twitter's business model to deliver this potential. In short, investors will get to choose not only between competing visions for Twitter's future, but also who they trust to deliver those visions.

The problem that Twitter's management will face in mounting a case that Twitter is worth more, if it is run differently, is that they have been the custodians of the company for the last decade, and have been unable or unwilling to deliver these changes. Shareholders in Twitter will welcome management's willingness to consider alternative business models, but the timing makes it feel more like a deathbed conversion rather than a well thought through plan. Elon Musk's problem, on the Twitter deal, is a different one. If you think Jack Dorsey was stretching the limits of his time by running two companies, I am not sure how to characterize what Musk will be doing, if he acquires Twitter, since he does have a trillion dollar company to run, in Tesla, not to mention SpaceX, the Boring company and a host of other ventures. In addition, Musk's unpredictability makes it difficult to judge what his end game is, at least with Twitter, since he could do anything from selling his position tomorrow to bulldozing his way through a poison pill, taking Twitter down with him. I know that there are question of how Musk  finance the deal and whether he can secure funding, but of all of the impediments to this takeover, those might be the easiest to overcome. The fact that Twitter's stock price has stayed stubbornly below Musk's offering price suggests that investors have their doubts about Musk's true intentions, and whether this deal will go through.

Alternate Endings

No matter what you think about Elon Musk and how his acquisition bid will play out, it is undeniable that he has put Twitter in play here, and that it is likely that the company that emerges from this episode will look different from the company that went into it. In particular, I see four possible outcomes for Twitter:

  1. Status Quo: It is possible that Twitter wins this round with Musk, and that the poison pill adopted by the board is sufficient to get him to walk away from the deal, perhaps selling his holdings along the way. The existing management go back to their plans for incremental change that they have already put in motion, and hope that the payoffs of higher revenue growth and profitability will unlock share value. 
  2. Musk takes Twitter private: Having spent more than a decade seeing Musk pull off what most market observers would view as impossible, I have learned not to underestimate the man. For Musk to succeed at this point, he has to be able to buy enough shares in a tender offer and/or convince other shareholders to put pressure on the board to remove the poison pill, and allow him to move forward with his plans. The odds are against success, but then again, this is Elon Musk.
  3. Independent, but with corporate governance changes: Even if Twitter is able to fend off Musk, the way that the company's management and board have handled the deal does not inspire confidence in their ability to run the company. In fact, having gone through five CEOs over Twitter's life, it is worth asking the question whether the dysfunction at the company lies with the board, and not just with the CEO. In this scenario, institutional investors will follow through by pushing for change in the company, translating into new board members and perhaps even a new CEO.
  4. Someone else acquires Twitter: There may be something to Musk's claim that the changes that are needed to make Twitter a functional business can only be made, if it is taken private. If so, it is  the board may be willing to sell the company to someone other than Musk, albeit at a slightly higher price (if for no other reason than to save face). The fact that the buyer may be Silver Lake, a firm that Musk has connections with, or another private equity investor, whose plans for change are similar to Musk's, will mean that Elon Musk will have accomplished much of what he set out to do, without spending $43 billion dollars along the way or having to deal with the distractions that owning Twitter will bring to his other, more valuable, ventures.
If I were to put these possibilities in terms of likelihood, I would put "staying independent with significant corporate governance changes" as most likely, followed by someone else acquiring Twitter, with the status quo and Musk succeeding getting the lowest odds.

Political Markets?

In this discussion, I have deliberately stayed away from the elephant in the room, which is that this is , at its core, a political story, not a financial one. To see why, consider a simple test. If you tell me which side of the political divide you fall on, I am fairly certain that I will be able to guess whether you favor or oppose Musk's takeover bid. As with most things political, you will provide an alternate, more reasoned, argument for why you are for or opposed, but you are deluding yourself, and hypocrisy is rampant on both sides.  

  • If you are opposed to the deal, and your argument is that billionaires should not control social media platforms, that outrage cannot be selective, and you should be just as upset about Jeff Bezos owning the Washington Post or a George Soros bid for Fox News. If it is Musk's personality that you feel is what makes him an unsuitable owner, I wonder whether we should be requiring full personality tests of the owners of other media companies.
  • If you are for the deal, and it is because you want Twitter to be a bastion of free speech, it is worth remembering that every social media platform is involved in some degree of censoring, for legal reasons and self preservation. It should also be noted that while those disaffected with Twitter have attempted to build their own social media platforms, they still get far more mileage from their presence on Twitter than from their posts on alternate platforms, and the complaints about Twitter not being balanced seem to end up being on Twitter.
The hand wringing from pundits about changes that may or may not be coming to Twitter, and the impact it will have on our collective consciousness, to be over wrought. In fact, some critics of Musk seem to have decided that Twitter, in its current form, is a national treasure that needs to be preserved or at least protected from money grubbing barbarians. I beg to differ. The brevity (of having to compress your thoughts into 280 characters) and timeliness of Twitter's platform has made it the place to go to get breaking news, but the notion that it is an educational platform shortchanges the meaning of learning, and the impulsiveness that it encourages from users is a recipe for tweeting remorse, or worse. I believe that while there are some who come to Twitter for news and witty repartee, many come to the platform for the same reasons that they slow down on highways to look at car crashes, i.e., to witness, and sometimes partake in, deranged arguments about trivial issues. Much as we like to complain about the ugliness and anger that we see on social media, it is exactly those forces that draw users to it, and arguing that Elon Musk will make it worse, misses the point that he symbolizes the strengths and weaknesses of the Twitter platform better than any other person walking the face of the earth. 

YouTube Video


Spreadsheets