In my last post, I used Facebook's recent troubles to talk about the importance of corporate governance, and how we, as investors, have abandoned the power to change management at many younger tech companies in return for being able to invest in young tech companies, with growth potential and well-regarded founders. In this post, I will revisit Facebook's most recent earnings report, and argue that while it contained disappointing news on growth and profitability, the bad news was exaggerated by systematic inconsistencies in how accountants categorize expenses, skewing earnings and invested capital down in firms that don't fit the accounting prototype. That skewing can affect valuation and pricing judgments about these firms, and correcting accounting inconsistencies is a key step towards leveling the playing field.
Accounting 101
I am not an accountant, and have no desire to be one, but I have used their output (accounting statements) as raw material in valuation and corporate finance. As I look at accounting from the outside, I see the primary role of accounting as recording and reporting, in a consistent and standardized form, the answers to three basic questions:
What does a business own? List out the assets that a business has invested in, and how much it spent on those investments and perhaps what these assets are worth today.
What does the business owe? Specify the contractual commitments that a business has to meet, to stay in business. Simply put, this should include all borrowings, but is not restricted to those
How much money did the business make? Measure the profitability of the business, both with accounting judgments on expenses, and based upon cash in and cash out, over the period of measurement (quarter, year).
It is in pursuit of answering these questions that accountants generate financial statements, and the three most basic are:
The balance sheet, which summarizes what a firm owns and owes at a point in time, as well as an estimate of what equity is worth (through accounting eyes).
The income statement, which reports on how much a business earned in the period of analysis, while providing detail on revenues and expenses.
The statement of cash flows, which reports on cash inflows and outflows to the firm during the period of analysis and allows for a measure of cash earnings (as opposed to accounting earnings) and cash flows.
In recording transactions, most businesses are required to follow an accrual method, where transactions are recorded as they occur, rather than cash accounting, where you record items as you pay for them or get paid. In accrual accounting, accountants categorize expenses into operating, capital and financing expenses, with the distinction, at least in theory, being as follows:
Operating expenses are expenses associated with generating the revenues reported by a business during a period. Thus, it includes not only the direct costs of producing the product or service the firm sells, but also other expenses associated with operations, including S, G & A expenses and marketing costs.
Financing expenses are expenses associated with the use of non-equity financing, and in most firms, it takes the form of interest expenses on debt, short term and long term.
Capital expenses are expenses that provide benefits over many years. For a manufacturing company, these can take the form of plant and equipment. For non-manufacturing companies, they can take on less conventional and tangible forms (and as well argue in the next section, accounting has never been good at dealing with these).
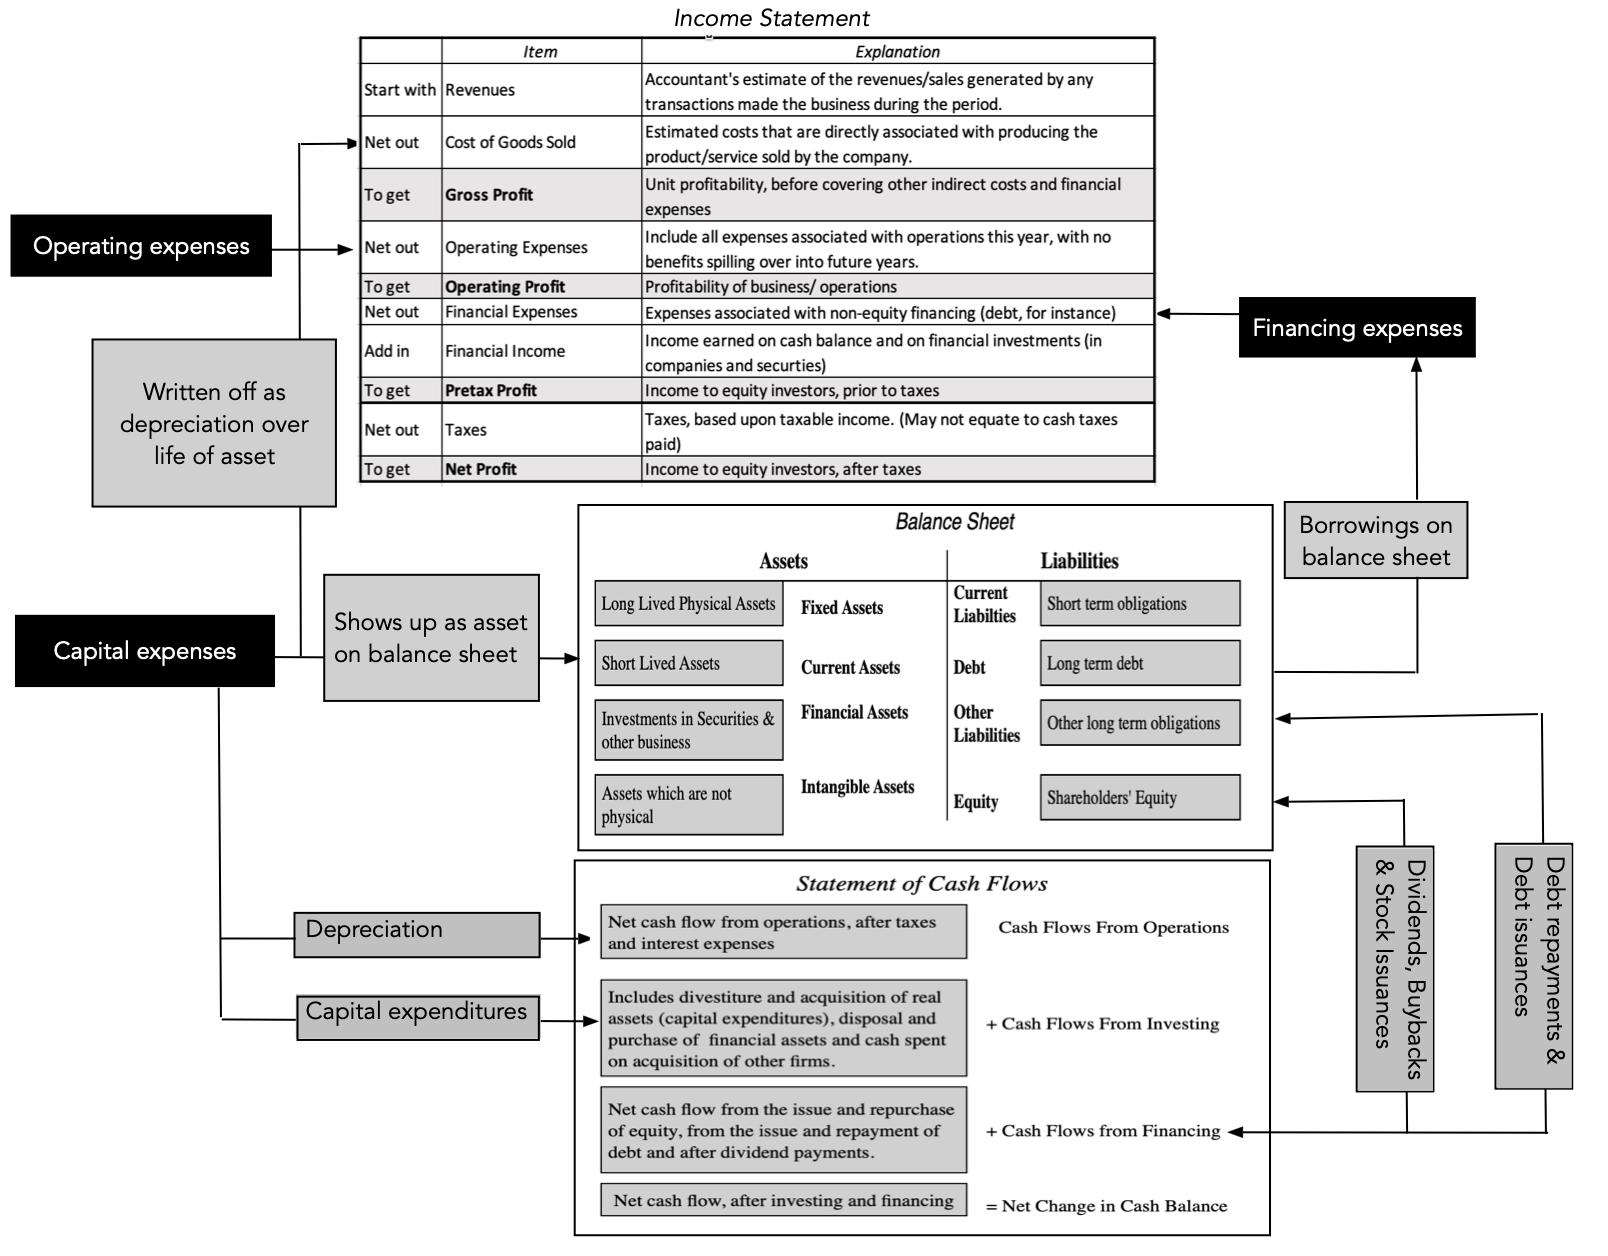
This classification plays out across the financial statements and plays a key role in accounting assessments of profitability, capital invested and even cash flows. In the figure below, I trace out where operating, capital and financing expenses show up in the three financial statements:
Operating expenses become part of cost of good sold or other operating expenses (like SG&A and adverting costs) in an income statement, and are key inputs in determining operating income. Capital expenses create assets on the balance sheet, in the year in which they are made, and when amortized or depreciated, in subsequent years, the resulting amortization or depreciation becomes part of operating expenses in those years. Financing expenses are expenses associated with the use of non-equity financing, with interest expenses on borrowing (short and long term) being the most common items, with the non-equity financing showing up as debt on the balance sheet, with interest expenses reducing your taxable and net income. The statement of cash flows is explicitly broken down into operating, investing and financing categories, with the distinction being that it looks at cash flows, not accounting expensing.
Accounting Inconsistencies and Pricing Consequences
In my introductory accounting class, I was told that accountants were scrupulous about expense classification, and that misclassifying financing expenses or capital expenses as operating expenses occurred rarely. In the years since, I have concluded that this is not true and that expense mis-categorization is not only common, but that it varies widely across sectors, making it difficult to compare accounting numbers or ratios across firms.
1. Financing Expenses treated as Operating Expenses
When a financing expense is treated as an operating expense, that mistake plays out across the financial statements. In the income statement, this classification error moves an expense that should be below the operating income line, to above it, reducing operating income. The misclassification also means that the balance sheet recording of debt will not include the financing that gave rise to the mis-categorized expense:
As you can see, treating a financing expense as an operating expense has no effect on net income, but its effects will ripple through elsewhere affecting operating income (usually lowering it) and understating the borrowing on the balance sheet. To the extent that these numbers are used in computing financial ratios, it will affect your measures of operating income and return on invested capital. Until accountants came to their senses in 2019, they routinely treated a large segment of leases as debt, with questionable reasons, and skewed operating margins, returns on capital and debt ratios in lease-heavy sectors like retailing and restaurants. However, leases are only one of many other contractual commitments that meet the "debt" criteria, and require similar corrections. Thus, the content commitments at Netflix, representing contractual commitments on content that Netflix has obtained rights to, from other studios, as well as some purchase commitments at companies may require the same corrective treatment as leases.
2. Capital Expenses treated as Operating Expenses
Treating a capital expense as an operating expense also plays out across the financial statements, and we will use R&D, which is the most widely mis-categorized cap ex, to illustrate. When R&D is expensed, it pushes down both operating and net income for companies with growing R&D expenses over time; in the rarer case of declining companies where R&D has been dropping over time, it will have the opposite effect. In addition, the mistreatment of R&D as an operating expense will mean that the expense will not create an asset on the balance sheet, as capital expenses should, with consequences for your measures of book equity and capital invested:
The capitalization of R&D requires making an assumption about how long it will take for R&D, on average, to generate commercial products, with longer R&D lives for pharmaceutical companies and much shorter ones for technology and software companies. In general, correcting the accounting mistake will increase operating and net profits, at most firms, as well as book equity and invested capital, and for most firms that spend money on R&D, capitalizing R&D will lower accounting returns (return on equity and return on invested capital).
The arguments that we used for treating R&D as a capital expense, i.e., that the expense is intended to create benefits over many years and not in the current one, can also be used on other items that accountants routinely treat as operating expenses, such as
Exploration costs at natural resource companies, since even if successful, the reserves found will not add to revenues or income until years into the future.
Advertising expenses to build brand name at consumer product companies, and especially so at companies (like Coca Cola) that are dependent on brand name for both growth and pricing power. Note that not all business advertising is for building brand name, and capitalizing brand-name advertising will require separating advertising expenses into portions intended to sustain and increase current sales (operating expense) and for building brand name (capital expense).
Use/Subscriber acquisition costs at user or subscriber based firms, at companies that have built their value propositions around user or subscriber numbers. Note that the capitalization effect will depend on how long an acquired subscriber or user will stay with the business, with longer customer lives creating a bigger impact, from correction.
Employee recruiting and training expenses at consulting and human-capital driven firms, since their growth depends, in large part, on their employee quality and retention. Here again, the effect of capitalizing employee-related expenses will depend on employee tenure, with longer tenure creating a bigger effect, when the correction is made.
In making these corrections, you will face push back. Accountants will use the argument that the benefits are uncertain, true for some of these expenses, like R&D, but also true for many investments in fixed assets (factories, capacity etc) that are currently treated as capital expenses. Uncertainty about future benefits should never be the litmus test for whether to treat an expense as a capital or operating expense; instead, the focus should be on when you can expect to generate those uncertain benefits. Some may push back, arguing that making this correction will push up earnings at these companies, to which your response should be that this is exactly what you should be doing, if it reflects reality. The truth is that accounting has a legacy problem, where almost all of the rules that underlie accounting reflect the fact that they were written for the manufacturing companies that dominated the twentieth century. As technology companies, in particular, have taken an increasing share of the economy and the market, accounting has tried to catch up, with new rules on expensing and valuing intangible assets, but it remains decades behind reality.
3. Pricing and Investing Consequences
Even if you agree with me on the logic of correcting for accounting inconsistencies, you may wonder whether the effort of making these corrections is worth the effort. I believe it is, since failure to do so can have both valuation and pricing consequences. In the table below, I capture the effects of moving an item from operating to financing (as we do in the lease correction) and from operating to capital (as is the case when we capitalize R&D):
I believe that correcting for accounting inconsistencies is worth the trouble, given the value and pricing consequences. That is the reason I employ both corrections, albeit with a bludgeon, to reestimate company numbers, when I do my data updates for industry averages (for debt ratios, accounting returns, profit margins and reinvestment) at the start of every year.
Facebook: Cleaning up the Accounting
As you take a look at the most recent quarterly earnings report from Facebook, it is worth drawing on the discussion about accounting inconsistencies. Without contesting the basic conclusion that Facebook had a bad operating quarter, after its earnings report for the third quarter of 2022, let's review the accounting numbers to see how bad it truly was, and why.
The R&D Effect
As a technology company with billions of users on its platform, and increasing calls for respecting data privacy, Facebook needs to spend on R&D, and it has done so heavily all of its corporate life. In the chart below, I report on Facebook's R&D spending each year from 2011 to the last twelve months (ending September 2022):
In the last twelve months, Facebook spent $32.6 billion on R&D, making it one of the largest corporate spenders on research and development in the world; seven of the top ten companies, in R&D spending, are technology companies with two pharmaceutical companies and one automobile company (Volkswagen) rounding out the list. From the graph, you can also see that Facebook's spending on R&D has only accelerated in the last five years, even as it scales up, and that R&D growth will determine the impact of capitalizing it. Using a 3-year life for R&D, I estimate the capital invested in R&D to be $53.1 billion (which adds to book equity in 2022) in September 2022, and the R&D amortization for the most recent twelve months to be $18.9 billion. (In R&D capitalization, I use a range of 2-10 years, depending on the sector, with 3 years for most technology and software companies).
To correct earnings (net and operating income) each year, I add back that year's R&D expense and net out the amortization of R&D in that year, and I report this restated income from 2011 to 2022 in the graph below:
As you can see, the adjusted pre-tax operating income numbers are significantly higher every year, because of the adjustment, with the pre-tax operating income increasing from $35.5 billion to $49.3 billion in the last twelve months (ending September 2022). Since net income increases by the same magnitude, the company generated $42.5 billion in net income in the last twelve months, if you correct for R&D, rather than $28.8 billion, as reported.
Since R&D capitalization also pushes up the book value of equity, and by extension, the invested capital in the firm, I looked at the effect of capitalizing R&D on invested capital and return on invested capital, over time:
For the most part, capitalizing R&D lowers the return on invested capital, with the pre-tax return on invested capital dropping from 38.91% to 34.10%, in the most recent twelve months, after the correction. While these are returns that most companies in the world would gladly exchange for their own, the trend downwards over time is a reflection of the challenges of scaling up as well as competition within the business. The online advertising business is not just seeing slower growth, but increased competition and regulatory pressures (over privacy) are lowering the returns that can be made in the business.
The Metaverse Investment
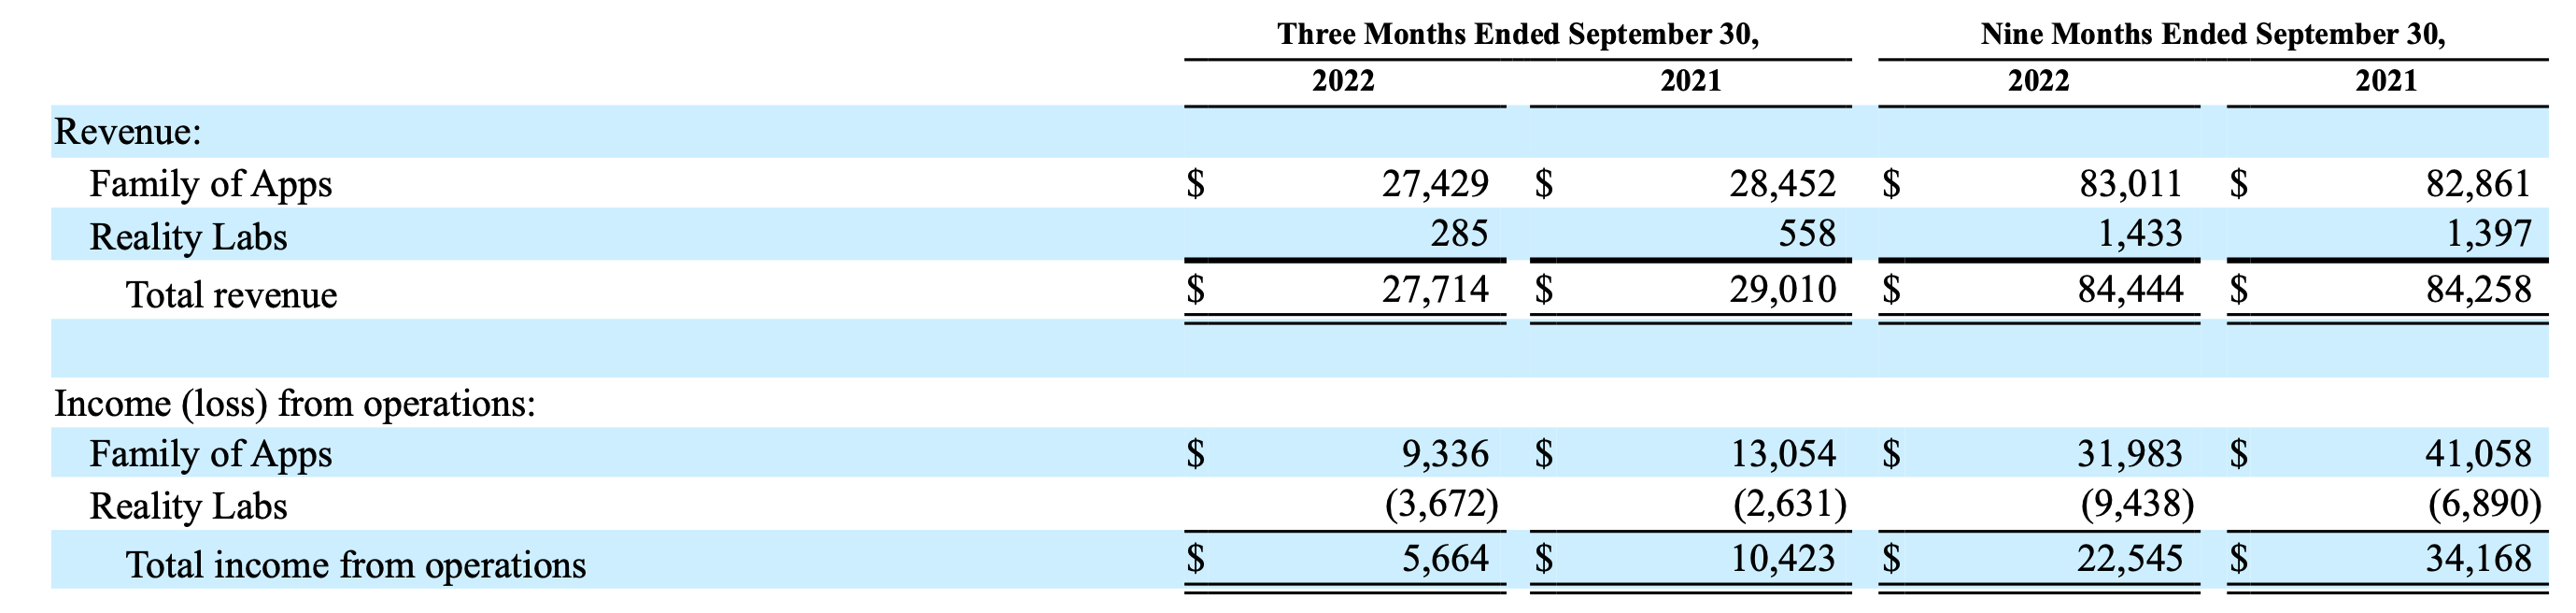
In the last few years, Facebook has been supplementing its R&D investments with substantive investments in the Metaverse, and it has been open about its plans to invest huge amounts in the future. The extent of Facebook's Metaverse bet, and its effects on the bottom line, are visible in this excerpt from the most recent quarterly report filed by the company:
In the last twelve months, Reality Labs, which comprises a big portion of the company's investment in the Metaverse and houses its VR glasses (acquired originally from Oculus), generated revenues of $2,310 million (add the revenues in the first nine months of 2022 to the last quarter numbers from 2021), while adding $12,741 million to operating expenses. We are certain that while some of these reality-lab related expenses are operating, a large portion represent capital expenses that are being expensed. The effect of Reality Labs on Facebook's income numbers can be seen below:
Without the expense drag created by Reality Labs, Facebook's operating margin would have been almost 12% higher, at 53.54%, instead of the 41.7% that we obtained, after correcting for R&D. While it is true that Facebook has spent this money, no matter how you categorize it, it is also true that if accounting stayed consistent in its capital expenditure treatment, much of this money should have been treated as a capital expense.
Consequences
My intent, when I started this post, was not to promote or to discount Facebook as an investment, but to provide some light on where Facebook stands right now (in terms of growth, profitability and risk), given the most recent quarter's earnings report:
Profitability: There is no denying that Facebook's revenues have flattened out, though a stronger dollar and slowing economic growth are partially responsible. However, the drop in operating and net margins that you saw in the most recent earnings report should not be taken as a sign that the profitability of the company's online has imploded. In fact, correcting for R&D and the Reality Lab investment, you can see that the online advertising business remains a money machine, generating sky-high margins. In fact, almost all of the drop in profitability is coming from Facebook's R&D and Metaverse investments, and if a large portion of that expenditure were treated as capital expense, that drop would have been far smaller.
Pricing: As Facebook's market cap has declined to approximately $250 billion, some have noted that the company now trades at about 8 times earnings, if you use the net income of $28.8 billion assessed by accountants. However, if you are comparing Facebook's PE ratio to the PE ratios of non-tech companies, for consistent comparisons, you should be using the adjusted net income of $42.5 billion, which results in an adjusted PE ratio of about 6. I don't use PE or EV to EBITDA multiples as my primary stock picking tool, but if you do, Facebook looks far cheaper, relative to other companies, after you have adjusted for its misclassified capital expenditures (R&D and Metaverse).
Valuation: From a valuation perspective, you care about cash flows, and since R&D and the Metaverse investments are cash outflows, Facebook's investments in these will lower cash flows. The value effect, though, will depend upon whether you think these investments will pay off in future revenue growth and higher cash flows in the future, and investors, at least at the moment, are not only not giving Facebook the benefit of the doubt, but seem to be actively building in the presumption that this is essentially wasted money, with no payoffs at all. As I will argue more extensively in my next post, I assign a great deal of blame for this investor mistrust to Facebook, because the company seems to have made almost no effort to explain its business model for generating revenues and profits from the Metaverse. In short, the only thing that Facebook has been clear about is that they will invest tens of billions of dollars in the Metaverse, while being opaque about how it plans to make money in that space. Remember that even if we all buy Facebook VR glasses and spend half our lives in the virtual world, for Facebook to make money, it has to either collect money from us (subscriptions or transactions) or show us advertising.
In sum, though, capitalizing R&D and the Metaverse investments is a good idea, whether you are an optimist or pessimist about the company. If you are bullish on Facebook, you will have convince others and, more importantly, yourself, that you expect Facebook (and Zuckerberg) to deliver a payoff on the Metaverse investment that justifies its scale. If you are in the pessimist group, it is important that your reasoning for why Facebook is a poor investment, at a PE ratio of 6, is not based upon the false premise that its prime operating business (online advertising) has becoming less profitable (it has not) but upon a judgment that you have made that Zuckerberg's ego has overridden his business sense, and that without the safety rails of corporate governance, he will continue to throw good money into a bad idea for the foreseeable future.
When I started these updates on February 26, 2020, about two weeks after the markets went into free fall, my first six posts were titled "Viral Market Meltdowns", reflecting the sell off across the globe. About half way through this series, I changed the title, replacing the word "meltdown" with "update", as markets turned around. In fact, by August 14, the date of this update, US equities had recouped all of their crisis losses, and were trading higher than they were on February 14, the start of the crisis. In that six-month period, though, there has been a reallocation of value, from old to young, value to growth and manufacturing to technology companies, and I have tried to both chronicle and explain these shifts in earlier posts. In this one, I plan to focus on a subset of these companies, the FANG (Facebook, Amazon, Netflix and Google) stocks, younger companies that have soared in value over the last decade, and two other tech companies of longer standing, Apple and Microsoft. These FANGAM stocks, which have dominated the market for the last decade, have become even more dominant during the crisis, and explaining (or trying to explain) that phenomenon is key to understanding both the market comeback and to assessing whether it is sustainable.
Market Outlook
My crisis clock started on February 14, 2020, and it is now six months since its start, and as with my previous updates, I will begin with a quick overview of financial market action over this period. I start by looking at selected equity indices, spread geographically, and how they have performed over the period:
On August 14, the S&P 500 was almost back to where it was on February 14, which was an all-time high, and the NASDAQ was 13.46% higher than its February-levels, hitting new highs. In local currency terms, the Latin American indices were still showing double-digit declines, as of August 14, but the Asian indices have recouped much of their early losses. As equities have gone on a roller-coaster ride, US treasuries have settled into a holding pattern, with rates across maturities at much lower levels than prior to it:
Almost all of the drop in rates occurred in the first few weeks of the crisis, but rates are now close to zero at the short end of the maturity spectrum, less than 1% for the 10-year treasuries and approaching 1.5% for the 30-year treasuries. The Fed's two big action announcements, the one of March 15 on expanding quantitative easing and the other on March 23, on operating as a backstop in lending markets, have had only a muted effect on treasury rates, but they do seem to have caused a shift in corporate bond markets, as can be seen in the graph below, showing corporate default spreads for bonds in different ratings classes:
Corporate bond spreads, which surged in the first five weeks of the crisis, have dropped back almost to pre-crisis levels for the highest rated bonds. For the lowest rated bonds, spreads have followed the same pattern, but they remain at elevated levels, relative to pre-crisis values. The ebbs and flows in equity and bond markets have also played out in commodities, where I track oil and copper on a daily basis in the graph below:
Copper, after dropping 15.36% between February 14 and March 20, has more than recovered its losses and was trading 10.57% higher on August 14, than on February 14. Oil had a much steeper fall in the early weeks, down more than 50% in the first five weeks of the crisis, and while it too has recovered, it was trading about 20% below where it was on February 14. Finally, I look at gold and bitcoin during the crisis period:
Comparing Bitcoin to gold, the cumulative return over the six-month period is not dissimilar, with gold up about 23% from its February 14 level, while Bitcoin is up 14%, but the performance over the six month period is telling. Gold has held its value through the crisis, reinforcing its crisis investment status, but bitcoin has been on a wild ride, falling about 40% in the first five weeks, when stocks were down, and rallying almost 89% in the weeks since, as stocks have risen, behaving more like very risky equity than a crisis investment.
Equities Breakdown
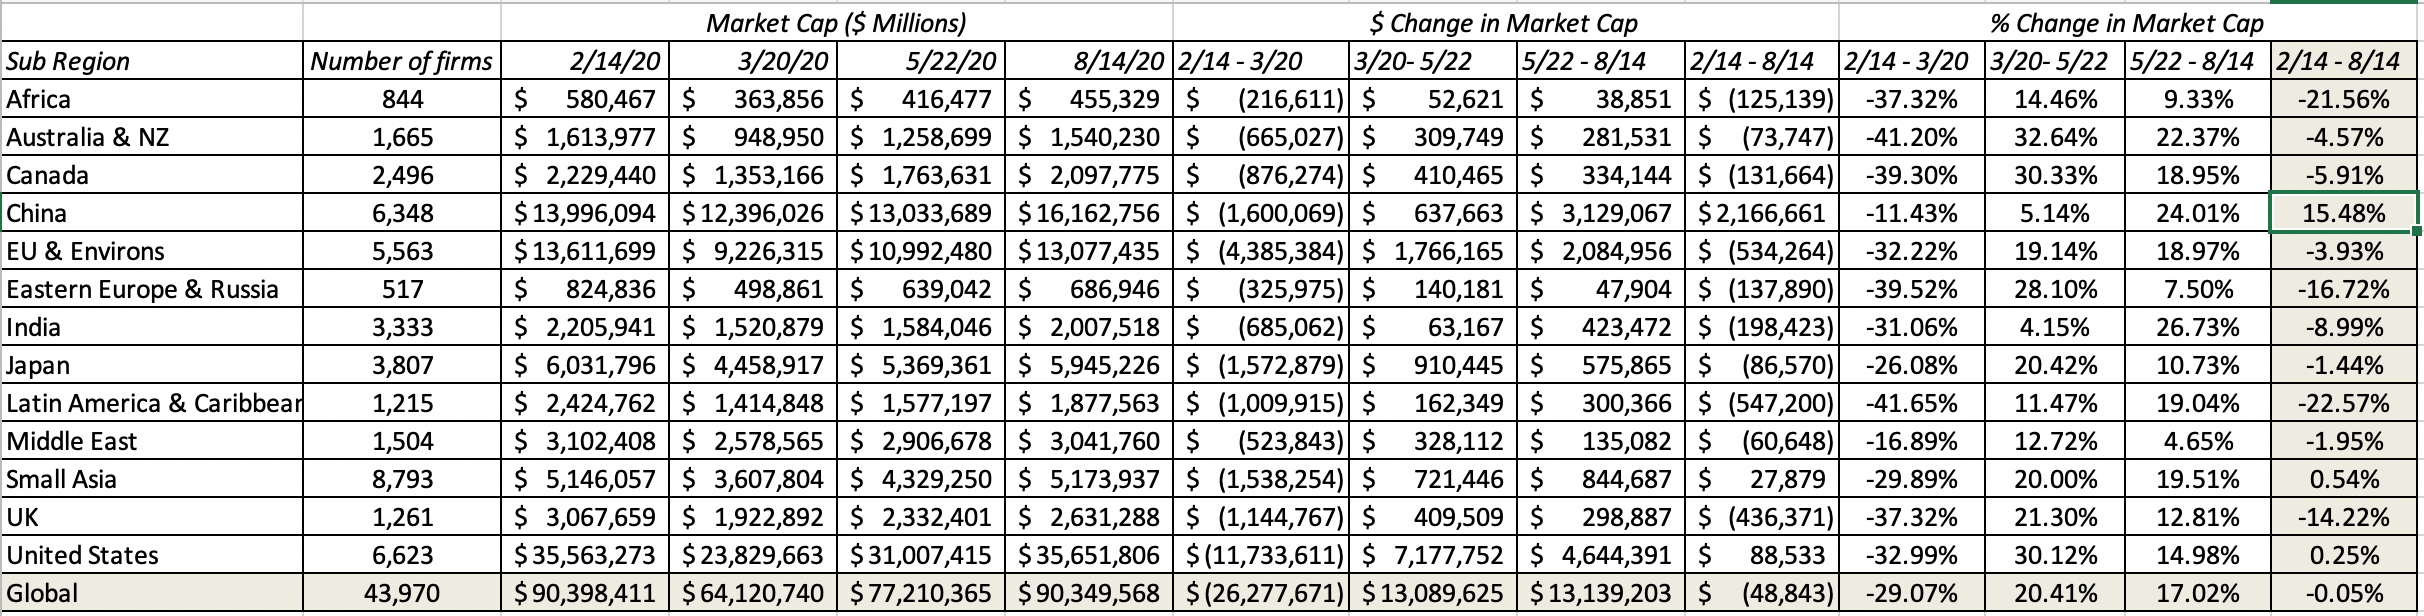
While looking at equity indices can provide a big-picture perspective on how stocks are doing, looking at individual companies can yield much richer insights. As in prior weeks, I updated my company-level data on market capitalizations to include the four weeks since my last update, and I report the changes in market capitalization, by region, in the table below:
All of these returns are computed in US dollar terms, for comparability, and they are based upon the aggregate market capitalization of all companies traded in each of these markets. As you can see, a subset of emerging markets (Africa, Eastern Europe, Latin America), are showing the most damage, with weakening local currencies exacerbating market damage. Collectively, global equities on August 14 are back to where they were on February 14, reflecting the comeback story that the indices were telling. Breaking down global stocks by sector, here is what I see:
Of the eleven sectors that S&P uses to classify stocks, six now have positive returns over the crisis period, and technology has now overtaken health care as the best performing sector. The worst performing sectors are energy, real estate and utilities, all businesses that are capital intensive and debt laden, and default worries about that debt burden may explain why financials remain the worst performing sector. Breaking sectors down into finer detail in industry groups, I list the ten worst performing and best performing industries, over the six-month period:
The message in this table reinforces what you saw in the sector returns, with infrastructure, commodity and financial service industries making up the bulk of the loser list, and technology, health care and retail dominating the winner list.
The FANGAM Phenomenon
In my earlier posts, I argued that the market effects of this crisis have been disparate, with capital-intensive, debt-laden and rigid firms being worse affected than firms that are capital-light and flexible. You see this play out in the returns you see across sectors, industries and regions. In fact, with returns updated through August 14, 2020, technology companies are now showing healthy gains from where they were at the start of this crisis, up 11.82% since February 14, 2020. There is an inside story to this success, and it revolves around six companies - the original FANG stocks and Apple and Microsoft. They have been responsible not just for the bulk of the returns among technology companies, but have also provided the thrust for the overall market's recovery.
FANGAM - Tale of the Tape
To understand the FANGAM story, let's retrace our steps to when there were only four young companies in this group, Facebook, Amazon, Netflix and Google (FANG) and look at how two of their senior counterparts, Apple and Microsoft, entered this group. In the table below, I list out the founding date for each of these companies, together with the date of their public offerings, the market capitalization at the time of the offering and the years in which each company hit market cap milestones ($100 billion, $500 billion and $1 trillion):
Looking at the six companies, they vary in age, with Microsoft being the oldest and Facebook the youngest, but they have also had extraordinary revenue growth in the last two decades, albeit from different bases. Coming into 2020, Apple, Amazon and Microsoft had already hit trillion-dollar market caps, and they were joined by Alphabet in 2020, and Apple crossed the $2 trillion threshold just two days prior to this post. I find the construct of a corporate life cycle useful in explaining the evolution of companies over time, in both corporate finance and valuations.
For most companies, aging is accompanied by three phenomena. The first is that revenue growth decreases as companies scale up, with the speed of deceleration in growth a function of competition in the business. The second is that profit margins, which are negative or very low when companies are young, improve as companies grow, with the magnitude of improvement depending upon the economies of scale in the business, but plateau as new competitors emerge. The third is that even the very best companies reach mature growth, where they remain profitable, but struggle to grow and create value at the same time. The FANGAM stocks stand out from the rest of the market, since they have, at least so far, found the antidote to aging, continuing to grow even as they get larger, while sustaining or even improving profit margins. Breaking down how each of these companies deviate from the norm, here is what I conclude:
Amazon, the Original: In an era, where every company claims to be the "next Amazon", it is worth remembering that the original company's rise to global dominance came with hiccups and interruptions. After its stint as the poster child for the dot com boom, Amazon's online retail business flirted with failure in 2001, but survived and prospered in the next decade. By the end of the decade, though, it seemed like Amazon's story had run its course, but just as investors were readying for the company becoming a mature retailer, the company reinvented itself as a disruption platform, ready to go after any business it chose to, with an army (Amazon Prime) backing it up.
Apple and Microsoft, the Reincarnation Duo: By tech company standards, Apple and Microsoft are old companies that should be struggling to hold on to their customers and fighting off competition. Both companies though seem to have found a way to move the clock back, and retain their status as growth companies. Apple, given up for dead in the late 1990s, found its answer in streamed music, smartphones and tablets in the following decade. Office and Windows were the cash cows that kept Microsoft going for much of its corporate life, but after seeing growth flatline in the software business, the company found new growth in a subscription model (Office 365) and the cloud business.
Alphabet and Facebook, the Advertising Juggernauts: Google and Facebook have had almost uninterrupted growth, since their founding, as they have not only taken advantage of the shift to online advertising, but also dominated that shift, while also delivering profit margins in the stratosphere. Along the way, they have accumulated huge user bases, giving them the power to influence not only where people shop, but also what they think, and perhaps even how they vote.
Netflix, the Shape Shifter: Of the six stocks, the one that has had to make the most mid-course corrections, changing its business model to reflect a changing world, is Netflix. It started life as a video rental service, mailing DVDs to its customers, and undercutting Blockbuster, the dominant player in the business then. It pivoted quickly to become the leading streaming player, renting its content from movie and TV producers, and offering them to subscribers. As content producers squeezed the company, it shifted its business model again to make its own shows and movies, becoming the largest spender on content in the business. Along the way, it has gone global, and its business machine not only has a huge base of subscribers, but finds ways to keep adding to that base.
Every investing generation has its share of legendary companies, but I do not believe that there has been another grouping of companies that has dominated the market as completely as these six have done over the recent past.
A Decade of Domination
To understand how the FANGAM stocks made the last decade their own, you need to go back to the start of 2010, and see how the market viewed each one then:
The Lagging Giant: At the start of 2010, Microsoft had a market capitalization in excess of $270 billion, and was second only to Exxon Mobil, with a market cap of $320 billion, among US companies, but that represented a come down from its status as the largest market cap company at the start of 2000, with a market cap exceeding $500 billion.
The Rising Star: At the start of 2010, Apple's market cap was approaching $200 billion, making it the fifth largest US company in terms of market cap, but that was a quantum leap from its market cap of $16 billion, ten years earlier.
The Field of Dreams Company: By early 2010, Amazon had cemented its status as online retailer, capable of growing its revenues at the expense of its brick and mortar competitors, but without a clear pathway to profitability. The market seemed to be willing to overlook this limitation, giving the company a market cap of more than $50 billion, a significant comeback from the dot-com bust days of 2001, when it was valued at less than $4 billion.
The New Tech Prototype: In January 2010, Google was already the prototype for the new tech company model, having reached a hundred-billion dollar market cap threshold faster (a little more than a year after going public) than any other company in history, and with its market capitalization of more than $160 billion in early 2010, the company was already on the top ten list among US companies.
On the cusp: In early 2010, it is unlikely that anyone would have put Netflix on the list of big-time winners, since its market capitalization was less than $4 billion and its business model of renting content and signing up subscribers was seen as successful, but not scalable.
The glimmer in the market's eye: At the start of 2010, Facebook was still a private business, though venture capitalists were clearly excited about its prospects, pricing it at roughly $14 billion in January 2010, based primarily on its user numbers.
Looking at the FANG or FANGAM grouping, there is an element of revisionist history at play, since the stocks that are part of this group are there primarily because they have done so well in the last decade. In short, no one was talking about FANG stocks in early 2010, and Microsoft would never have made this list even as late as 2012, when it was viewed as a stodgy and fading company. Notwithstanding this hindsight bias, the FANGAM stocks collectively saw their market capitalizations increase from $719 billion (albeit without Facebook) to a staggering $5 trillion between January 1, 2010 and January 1, 2020. In the graph below, I show that collective market cap figure as well as the market capitalizations of all other US equities, each year from the start of 2010 to the start of 2020.
It is true that US equities did well over the decade, but the FANGAM stocks rose much more, rising from 6.5% of the overall market capitalization of all US equities, in January 2010, to close to 15% in January 2020. To provide perspective on how much the FANGAM stocks contributed to the overall equity market's rise, I compute the change in market capitalization each year at the FANGAM stocks and all other US equities, each year from 2010 to 2019:
The $4.35 trillion in market cap added by the FANGAM stocks accounted for 19% of the overall increase in equity value across all US equities (>7000 stocks).
The COVID Rally
At the start of 2020, there was no denying the dominance of the FANGAM stocks in US equity markets, but there was a debate about whether they were over priced, at least collectively. For many old-time value investors, the FANGAM stocks had became a symbol of growth and momentum run amok, though a legendary member of this group (Warren Buffet) had invested in one of the companies (Apple). Between January 1, 2020 and February 14, 2020, the FANGAM stocks continued to rise more than the rest of the market and they collectively accounted for 16.08% of the market cap of all US equities on February 14, up from the 14.94% at the start of the year. When the crisis hit, there were some value investors who felt that the market correction would be felt disproportionately by this group, given their run-up in the years before. In the graph below, I look at the market capitalization of the FANGAM stocks and the rest of US equities, on a week-to-week basis from February 14, 2020 to August 14, 2020:
During the first five weeks of the crisis (2/14- 3/20), the FANGAM stocks lost about $1.44 trillion in value, providing partial vindication to value investors, but in spite of that loss, saw their share of the market rise to 17.94% of US equities. Between March 20 and August 14, the FANGAM stocks more than recouped the early losses, and were up $1.39 trillion from their February 14 levels, on August 14, while the rest of US equities have collectively lost $1.29 trillion in market capitalization. On August 14, 2020, the FANGAM stocks accounted for 19.94% of the market capitalization of all US equities. While much has been made about how technology has led the comeback on stocks, it is worth noting that US technology companies collectively are up only $973 billion in the last six months, implying that without the FANGAM stocks, there would be no tech comeback.
From Strength to Strength
We may lump the FANGAM stocks as a group, but these are different companies in different businesses. In fact, lumping them together as technology companies misses the fact that Netflix is closer to Disney in its business than it is to Microsoft's software offerings, and Google and Facebook are advertising companies built on very different technology platforms. There are three elements that they do share in common:
Cash Machines: Each of these companies has a business or segment that is a cash machine, generating large profits and huge amounts of cash for the company. With Apple, it is the iPhone business that allows it to generate tens of billions in cash flows each year, and with Microsoft, it is a combination of its legacy products (Office & Windows) and cloud services that plays this role. With Facebook and Google, their core online advertising businesses not only generate sky high margins, but require very little capital investment to grow. Amazon, until a few years ago, had no segment of equivalent profitability, but AWS (Amazon’s cloud business) is now delivering those cash flows. Netflix remains the weakest of the six companies on this dimension, but even it can count on the subscription revenues from its "sticky" subscriber base for its cash needs.
Platform of users/subscribers: The FANGAM stocks also share user bases that are immense, with Facebook leading that numbers game with close to 2.7 billion users, many of whom spend large portions of each day in its ecosystem. Microsoft, Google and Apple all also have more than a billion users apiece, with multiple ways to entangle them. Amazon and Netflix may not be able to match the other four companies on sheer numbers, but each has hundreds of millions of users.
Proprietary and Actionable Data: I know that big data is the buzzword of business today, and in the hands of most companies, that big data is of little use, since it is neither exclusive to them, nor the basis for action. What sets the FANMAG companies apart is that they use big data to create value, partly because the data that they collect is proprietary (Facebook from your posts, Amazon/Alexa from your shopping/interactions, Netflix from your watching habits, Google from your search history and Apple from your device usage). Even Microsoft, a late entrant into big data, has stepped up its game. On top of the data is actionable, since these companies clearly use the data to advance their business models,
Each of these strengths has contributed to helping these companies not just ride out the COVID storm, but to also emerge stronger from it. The cash machines embedded in each company, combined with light debt loads (relative to their earnings and valuations), have left them unscathed, while their debt-laden competitors are hamstrung by default and distress concerns. The economic shut down has left people home-bound and more dependent than ever before on the FANGAM companies to get through the day, increasing the power of the user platforms and the data collected on them by these companies.
In fact, it is the fact that these companies are doing so well that is giving rise to the biggest threat to their continued success, which is regulatory and legal pushback. With Facebook and Google, this is already a reality, especially in the aftermath of the privacy debates and worries about their platforms being used for political influence, with the EU being the forefront of writing restrictions on their data collection and usage. Amazon's disruption of retail, and the devastation it has wrought on its brick and mortar competitors has long been a source of concern for critics, but voices pushing for the use of legal restraints and anti-trust laws on the company are growing louder. Apple has been able to operate under the radar of political and legal scrutiny for a long time, but recent attempts to force app sellers to sell only through its App Store, leaving it with a hefty slice of revenues, has drawn calls for government action. While Microsoft is now viewed as the most virtuous of the six, and is in fact the most widely held stock in ESG portfolios, I am old enough to remember when Microsoft was viewed as the Darth Vader of technology and targeted by the Justice department for breakup, because of its monopoly power.
Value and Pricing
I know that this has been a long lead in, but interesting though it might be to explain why the FANMAG stocks are where they are, the question of the moment in investing is whether you should buy, sell or just watch these stocks. Having valued all these stocks in the past, and acted on those valuations, with mixed results, I will draw on my past history with each company, to craft my stories and valuations of the companies.
With each company, I report an estimated median (or most likely) value, as well as the range (1st decile, 1st Quartile, 3rd Quartile and ninth decile) of values that I estimated from running simulations. Given how much these stocks have gone up over the last six months, it should come as no surprise that I find only one (Facebook) to be under valued. Among the remaining, Apple looks the most overvalued (>30%), to me, followed by Amazon and Microsoft (10%-20%) and Netflix and Alphabet (<10%). I have also computed the internal rates of return for these stock, based upon the current market capitalization, and my estimates of expected cash flows. I would expect to earn an IRR of 7.16% on Facebook, for instance, if I bought at its current market capitalization, and it generates the cash flows I expect it to. That may not sound like much to you, but in a world of low interest rates and equity risk premiums, it is high enough for the stock to be undervalued. Even Apple, the most overvalued stock in this group can be expected to generate a 5.30% IRR, at its current market capitalization, lower than what I would need it to make, given its risk, but not bad given the alternatives. That said, I expect you to disagree with me, perhaps even strongly, on my stories and assumptions, which is one reason the spreadsheets are yours to download and change to reflect your views.
In Closing
In the interests of full disclosure, at the time that I started on this post, I owned three of these six stocks, Apple, Facebook and Microsoft, with each having spent significant time in my portfolio; my posts detailing their acquisitions are here, here and here. As you look back at the valuations that I used to justify those investments, they seem laughably low, and I will not claim any semblance of clairvoyance. In fact, I bought Microsoft in 2013, even though I perceived it to be an aging company with little left in the tank in 2013, Apple in 2016, notwithstanding my expectations of low growth in the future, and Facebook in 2018, in the aftermath of the Cambridge Analytica scandal, because I found the companies cheap, even with my stilted narratives.
I did sell my Apple holdings today (August 19, 2020) as the company crested the $2 trillion mark, will continue to hold Microsoft, even though I believe that it is moderately overvalued, and Facebook, hoping for more upside. In case you are tempted to follow my lead, let me hasten to add that I also sold my Tesla holdings in January 2020 at $640, and the stock is now trading at close to $2000. Google and Netflix will remain on my watch list, and I plan to add either stock, on weakness. I will not tempt fate, and sell short on Amazon, partly because I have seen what the market does to Amazon short sellers and partly because I struggle to think of a catalyst that will cause the price to adjust. If history is any guide, these companies, unstoppable though they seem now, will hand the baton, for carrying the market forward in this decade, to other companies.
Debt is a hot button issue, viewed as destructive to businesses by some at one end of the spectrum and an easy value creator by some at the other. The truth, as is usually the case, falls in the middle. In this post, I will look not only at how debt loads vary across companies, regions and industries, but also at how they have changed over the last year. That is because last year should have been a consequential one for financial leverage, especially for US companies, since the corporate tax rate was reduced from close to 40% to approximately 25%. I will also put leases under the microscope, converting lease commitments to debt, as I have been doing for close to two decades, and look at the effect on profit margins and returns, offering a precursor to changes in 2019, when both IFRS and GAAP will finally do the right thing, and start treating leases as debt.
The Debt Trade Off
Debt is neither an unmixed good nor an unmitigated disaster. In fact, there are good and bad reasons for companies to borrow money, to fund operations, and in this section, I will look at the trade off, and look at the implications for what types of businesses should be the biggest users of debt, and which ones, the smallest.
The Pluses and Minuses
There are only two ways you can raise capital to fund a business. One is to use owner funds, which can of course range from personal savings in a small start up to issuing shares to the market, for a public company. The other is to borrow money, again ranging from a loan from a family member or friend to bank debt to corporate bonds. The debt equity trade off then boils down to what debt brings to the process, relative to equity, in both good and bad ways.
The two big elements driving whether a company should borrow money are the tax code, and how heavily it is tilted towards debt, on the good side and the increased exposure to default and distress, that it also creates, on the bad side. Simply put, companies with stable and predictable earnings streams operating in countries, with high corporate tax rates should borrow more money than companies with unstable earnings or which operate in countries that either have low tax rates or do not allow for interest tax deductions. For financial service firms, the decision on debt is more complex, since debt is less source of capital and more raw material to a bank. As a consequence, I will look at only non-financial service firms in this post, but I plan to do a post dedicate to just financial service firms.
US Tax Reform - Effect on Debt
If one of the key drivers of how much you borrow is the corporate tax code, last year was an opportunity to see this force in action, at least in the US. At the start of 2018, the US tax code was changed in two ways that should have affected the tax benefits of debt:
The federal corporate tax rate was lowered from 35% to 21%. Adding state and local taxes to this, the overall corporate tax rate dropped from close to 40% to about 25%.
Restrictions were put on the deductibility of interest expenses, with amounts exceeding 30% of taxable income no longer receiving the tax benefit.
Since there were no significant changes to bankruptcy laws or costs, these tax code changes make debt less attractive, relative to equity, for all US companies. In fact, as I argued in this post at the start of 2018, if US companies are weighing the pros and cons correctly, they should have reduced their debt exposure during the course of 2018.
While I have data only through through the end of the third quarter of 2018, I look at the change in total debt, both gross and net, at non-financial service US companies, over the year (by comparing to the debt at the end of the third quarter of 2017).
In the aggregate, US non-financial service companies did not reduce debt, but instead added $434 billion to their debt load, increasing their total debt from $6,931 billion to $7,365 billion between September 2017 and September 2018. That represented only a 6.26% increase over the year, and was accompanied by a decline in debt as a percent of market capitalization, but that increase is still surprising, given the drop in the marginal tax rate and the ensuing loss of tax benefits from borrowing. There are three possible explanations:
Inertia: One of the strongest forces in corporate finance is inertia, where companies continue to do what they have always done, even when the reasons for doing so have long since disappeared. It is possible that it will be years before companies wake up to the changed tax environment and start borrowing less.
Uncertainty about future tax rates: It is also possible that companies view the current tax code as a temporary phase and that the drop in corporate tax rates will be reversed by future administrations.
Illusory and Transient Benefits: Many companies perceive benefits in debt that I term illusory, because they create value, only if you ignore the full consequences of borrowing. I have captured these illusory benefits in the table below: Put simply, the notion that debt will lower your cost of capital, just because it is lower than your cost of equity, is widely held, but just not true, and while using debt will generally increase your return on equity, it will also proportionately increase your cost of equity.
I will continue tracking debt levels through the coming years, and assuming no bounce back in corporate tax rates, we should get confirmation as to whether the tax hypothesis holds.
Debt: Definition
The tax law changed the dynamics of the debt/equity tradeoff, but there is an accounting change coming this year, which will have a significant impact on the debt that you see reported on corporate balance sheets around the world, and since this is the debt that most companies and data services use in measuring financial leverage. Specifically, accountants and their rule writers are finally going to come to their senses and plan to start treating lease commitments as debt, plugging what I have always believed is the biggest source of off balance sheet debt.
Debt: Definition
In my financing construct for a business, I argue that there are two ways that a business, debt (bank loans, corporate bonds) and equity (owner's funds), but to get a sense of how the two sources of capital vary, I looked at the differences:
Specifically, there are two characteristics that set debt apart from equity. The first is that debt creates a contractual or fixed claim that the firm is obligated to meet, in good and bad times, whereas equity gives rise to a residual claim, where the firm has the flexibility not to make any payments, in bad times. The second is that with debt, a failure to meet a contractual commitment, will lead to a loss of control of the firm and perhaps default, whereas with equity, a failure to meet an expected commitment (like paying dividends) can lead to a drop in market value but not to distress. Finally, in liquidation, debt holders get first claim on the assets and equity gets whatever, if any, is left over. Using this definition of debt, we can navigate through a balance sheet and work out what should be included in debt and what should not. If the defining features for debt are contractual commitments, with a loss of control and default flowing from a failure to meet them, it follows that all interest bearing debt, short term as well as long term, bank loans and corporate bonds, are debt. Staying on the balance sheet, though, there are items that fall in a gray area:
Accounts Payable and Supplier Credit: There can be no denying that a company has to pay back supplier credit and honor its accounts payable, to be a continuing business, but these liabilities often have no explicit interest costs. That said, the notion that they are free is misplaced, since they come with an implicit cost. To make use of supplier credit, for instance, you have to give up discounts that you could have obtained if you paid on delivery. The bottom line in valuation and corporate finance is simple. If you can estimate these implicit expenses (discounts lost) and treat them as actual interest expenses, thus altering your operating income and net income, you can treat these items as debt. If you find that task impossible or onerous, since it is often difficult to back out of financial reports, you should not consider these items debt, but instead include them as working capital (which affects cash flows).
Underfunded Pension and Health Care Obligations: Accounting rules around the world have moved towards requiring companies to report whether their defined-benefit pension plans or health care obligations are underfunded, and to show that underfunding as a liability on balance sheets. In some countries, this disclosure comes with legal consequences, where the company has to set aside funds to cover these obligations, akin to debt payments, and if this is the case, they should be treated as debt. In much of the world, including the United States, the disclosure is more for informational purposes and while companies are encouraged to cover them, there is no legal obligation that follows. In these cases, you should not consider these underfunded obligations to be debt, though you may still net them out of firm value to get to equity value.
The table below provides the breakdown of debt for non-financial service companies around the world.
As you browse this table, please keep in mind that disclosure on the details of debt varies widely across companies, and this table cannot plug in holes created by non-disclosure. To the extent that company disclosures are complete, you can see that there are differences in debt type across regions, with a greater reliance on short term debt in Asia, a higher percent of unsecured and fixed rate debt in Japan and more variable rate, secured debt in Africa, India and Latin America than in Europe or the US. You can get the debt details, by industry, for regional breakdowns at the link at the end of this post.
Debt Load: Balance Sheet Debt
Using all interest bearing debt as debt in looking at companies, we can raise and answer fundamental questions about leverage at companies. Broadly speaking, the debt load at a company can be scaled to either the value of the company or to its earnings and cash flows. Both measures are useful, though they measure different aspects of debt load: a. Debt and Value
Earlier, I noted that there are two ways you can fund a business, debt and equity, and a logical measure of financial leverage that follows is to look at how much debt a firm uses, relative to its equity. That said, there are two competing measures of value, and especially for equity, the divergence can be wide.
The first is the book value, which is the accountant's estimate of how much a business and its equity are worth. While value investors attach significant weight to this number, it reflects all of the weaknesses that accounting brings to the table, a failure to adjust for time value of money, an unwillingness to consider the value for current market conditions and an inability to deal with investments in intangible assets.
The second is market value, which is the market's estimate, with all of the pluses and minuses that go with that value. It is updated constantly, with no artificial lines drawn between tangible and intangible assets, but it is also volatile, and reflects the pricing game that sometimes can lead prices away from intrinsic value.
In the graph below, I look at debt as a percent of capital, first using book values for debt and equity, and next using market value.
In the table below, I break out debt as a percent of overall value (debt + equity) using both book value and market value numbers, and look at the distribution of these ratios globally:
Embedded in the chart is a regional breakdown of debt ratios, and even with these simple measures of debt loads, you can see how someone with a strong prior point of view on debt, pro or con, can find a number to back that view. Thus, if you want to argue as some have that the Fed (which is blamed for almost everything that happens under the sun), low interest rates and stock buybacks have led US companies to become over levered, you will undoubtedly point to book debt ratios to make your case. In contrast, if you have a more sanguine view of financial leverage in the US, you will point to market debt ratios and perhaps to the earnings and cash flow ratios that I will report in the next section. On this debate, at least, I think that those who use book value ratios to make their case hold a weak hand, since book values, at least in the US and for almost every sector other than financial, have lost relevance as measures of anything, other than accounting ineptitude.
b. Debt and Earnings/Cashflows
Debt creates contractual obligations in the form of interest and principal payments, and these payments have to be covered by earnings and cash flows. Thus, it is sensible to measure how much buffer, or how little, a firm has by scaling debt payments to earnings and cash flows, and here are two measures:
Debt to EBITDA: It is true that EBITDA is an intermediate cash flow, not a final one, since you still have to pay taxes and invest in growth, before you get a residual cash flow. That said, it is a proxy for how much cash flow is being generated by existing investments, and dividing the total debt by EBITDA is a measure of overall debt load, with lower numbers translating into less onerous loads.
Interest Coverage Ratio: Dividing the operating income (EBIT) by interest expenses, gives us a different measure of safety, one that is more immediately tied to default risk and cost of debt than debt to EBITDA. Firms that generate substantial operating income, relative to interest expenses, are safer, other things remaining equal, than firms that operate with lower interest coverage ratios.
In the table below, I look at the distributions of both these numbers, again broken down by region of the world:
Again, the story you tell can be very different, based upon which number you look at. Chinese companies have the most debt in the world, if you define debt as gross debt, but look close to average, when you look at net debt. Indian companies look lightly levered, if you look at Debt to EBITDA multiples, but have the most exposure to debt, if you use interest coverage ratios to measure debt load.
Operating Leases: The Accounting Netherworld
Going back to the definition of debt as financing that comes with contractually set obligations, where failure to meet these obligations can lead to loss of control and default, it is clear that focusing on only the balance sheet (as we have so far) is dangerous, since there are other claims that companies create that meet these conditions. Consider lease agreements, where a retailer or a restaurant business enters into a multi-year agreement to make lease payments, in return for using a store front or building. The lease payments are clearly set out by contract, and failing to make these payments will lead to loss of that site, and the income from it. You can argue that leases providing more flexibility that a bank loan and that defaulting on a lease is less onerous, because the claims are against a specific location and not the business, but those are arguments about whether leases are more like unsecured debt than secured debt, and not whether leases should be treated as debt. For much of accounting history, though, accountants have followed a different path, treating only a small subset of leases as debt and bringing them on to the balance sheet as capital leases, while allowing the bulk of lease expenses as operating expenses and ignoring future lease commitments on balance sheets. The only consolation prize is that both IFRS and GAAP have required companies to show these lease commitments as footnotes to balance sheets.
In my experience, waiting for accountants to do the right thing will leave you twisting in the wind, since it seems to take decades for common sense to prevail. Consequently, I have been treating leases as debt for more than three decades in valuation, and the process for doing so is neither complicated nor novel. In fact, it is the same process that accountants use right now with capital leases and it involves the following steps:
Estimate a current cost of borrowing or pre-tax cost of debt for the company today, given its default risk and current interest rates (and default spreads).
Starting with the lease commitment table that is included in the footnotes today, discount each lease commitment back to today, using the pre-tax cost of debt as your discount rate (since the lease commitments are pre-tax). Most companies provide only a lump-sum value for commitments after year 5, and while you can act as if this entire amount will come due in year 6, it makes more sense to convert it into an annuity, before discounting.
The sum total of the present value of lease commitments will be the lease debt that will now show up on your balance sheet, but to keep the balance sheet balanced, you will have to create a counter asset.
To the extent that the accounting has treated the current year's lease expense as an operating expense, you have to recompute the operating income, reflecting your treatment of leases as debt:
Adjusted Operating Income = Stated Operating Income + Current year's lease expense - Depreciation on the leased asset
Capitalizing leases will have large consequences for not just debt ratios at companies (pushing them for companies with significant lease commitments) but also for operating profitability measures (like operating margin) and returns on invested capital (since both operating income and invested capital will be changed). The effects on net margin and return on equity should either be much smaller or non-existent, because equity income is after both operating and capital expenses, and moving leases from one grouping to another has muted consequences. In the table below, I report on debt ratio, operating margin and return on capital. before and after the lease adjustment :
You can download the effects, by industry, for different regions, by using the links at the bottom of this post. Keep in mind, though, that there are parts of the world where lease commitments, though they exist, are not disclosed in financial statements, and as a consequence, I will understate the else effect, While the effect is modest across all companies, the lease effect is larger in sectors that use leases liberally in operations, and to see which sectors are most and least affected, I looked at the ten sectors, among US companies, and not counting financial service firms, that saw the biggest percentage increases in debt ratios and the ten sectors that saw the smallest in the table below:
Note that there are a large number of retail groupings that rank among the most affected sectors, though a few technology companies also make the cut. As I noted at the start of this post, this year will be a consequential one, since both GAAP and IFRS will start requiring companies to capitalize leases and showing them as debt. While I applaud the dawning of sanity, there are many investors (and equity research analysts) who are convinced that this step will be catastrophic for companies in lease-heavy sectors, since it will be uncover how levered they are. I am less concerned, because markets, unlike accountants, have not been in denial for decades and market prices, for the most part and for most companies, already reflect the reality that leases are debt.
Debt: Final Thoughts
One of the biggest impediments to any rational discussion of debt's place in capital is the emotional baggage that we bring to that discussion. Debt is neither poison, as some detractors claim it to be, nor is a nectar, as its biggest promoters describe it. It is a source of capital that comes with fixed commitments and the risk of default, good for some companies and bad for others, and when it does create value, it is because the tax code it tilted towards it. It is true that some companies and investors, especially those playing the leverage game, over estimate its benefits and under estimate its side costs, but they will learn their lessons the hard way. It is also true that other companies and investors, in the name of prudence, think that less debt is always better than more debt, and no debt is optimal, and they too are leaving money on the table, by being too conservative.