Showing posts with label Crisis. Show all posts

Wednesday, April 1, 2026

Oil, War and the Global Economy: The Market's Narrative in March 2026

    Markets play an expectations game, and in March 2026, we saw the process play out, with all of its upsides and downsides. The month started with a war in the Middle East, which quickly percolated into soaring oil prices and dropping stock prices, but the overwhelming factor was uncertainty about almost every dimension of the war - how long it would last, what permanent changes to oil prices would emerge as a consequence and how global governments and economies would respond to these changes. As we reach the end of the month, rather than getting answers, we face more questions, and not surprisingly, markets are volatile, not just on a day-to-day basis, but in intraday trading, driven as much by rumors and conjecture, as by facts. In keeping with my view that it is during periods of maximal uncertainty that you need perspective and to back to basics, I will focus my attention on market behavior in March, and what we can learn from that behavior, as a precursor for the months to come. 

The Market Narrative in March
    We live in an age of commentary, as self-proclaimed experts offer prognostications, half-baked or otherwise, about what is to come, and the Iran war, with its mix of politics, economics and religion baked in,, has drawn a large and extremely diverse set of expert forecasts. Given the strong priors (about Iran and Trump) that many of these experts bring to the game, it should not be surprising that their views about how the war will play out and the effect on markets is driven by those priors. It is up to markets to reconcile these contradictory perspectives, and come to consensus, and I will try to extract from market behavior what the market narrative is, leading into April 2026, with the recognition that it could be wrong and change overnight in good and bad ways. That said, over the last decade, I have learned that the market is far better at making sense of complexity and uncertainty than experts are, and it behooves us therefore to listen to what it is saying.

The Oil Price Shock
    As with almost every event in the middle east, the effects of the Iran War played out first in oil prices, and oil has been the lead player in March, surging and volatile, but with disparate impacts even within that market. In the graph below, I look at spot prices on Brent Crude and West Texas Intermediate (WTI) during March:


Both Brent and WTI crude oil saw prices increase in March, but with the price of Brent rising 49.9% and WTI rising 48.6% during March, the difference between the two almost doubled during the second half of the month. That divergence reflects the two-fold effect of the war on oil supply, with the first being the shuttering of oil production in the Gulf States and the second being the effecting throttling of ship traffic through the Strait of Hormuz, a key passageway for Middle Eastern oil to Asia and Europe. While both factors push up oil prices, oil and gas production in the US, the largest oil producer in 2025 (producing 13.58 million barrels or 16% of the total), was less affected by the Hormuz closing and supply chain issues, explaining the increasing price divergence mid-month.
    There was another tea leaf to read, and it came from watching oil futures prices. In the graph below, I compare the spot prices to Brent crude to June and December futures contracts prices:


While spot and futures prices have both risen in March, the latter have gone up less, indicating that, at least for the moment, the market sees the interruptions in oil supply as more temporary than permanent, though the market does see a lasting impact even in that optimistic scenario, with December futures up almost 25% over the pre-war level.

Inflation, Interest Rates and the Economy
    The creation of OPEC and the oil price embargo in the 1970s and the subsequent inflation spiral in the 1970s is now part of market legend, and the interlude in 2022, when the Russian invasion of Ukraine, and the subsequent sanctioning of Russian oil, caused a spike in inflation rates, has made investors wary. While the effects on gasoline prices are in the news, it is one item in the inflation basket, and it is unclear still how much higher oil prices will affect inflation for the rest of the year and perhaps into next year. While we wait for the actual inflation numbers to come out, markets don't have that luxury and the early and perhaps best indicator of market expectations on inflation are showing up in interest rates. The graph below looks at 3-month and 10-year US treasuries over the course of March 2026:


The 3-month treasury bill rate has barely budged over the month, moving from 3.67% on February 27, 2026 to 3.70% on March 31, 2026, but the ten-year bond rate saw a much bigger increase from 3.97% on February 27, 2026, to 4.30% on March 31, 2026. The biggest increases in rates are in the intermediate maturities, with the 2-year and 5-year rates rising by 0.41% over the course of the month. If you view interest rates, as I do, as driven by expected inflation and expected real growth, the most plausible reading is that the market sees an increase in inflation that is persistent. If you are a Fed-watcher, though, your reading may be that the rise in oil prices has tied the hands of the Fed, lowering the likelihood that the Fed Funds rate will be cut in the coming months, but that would leave you with a puzzle to resolve. Since the Fed Funds rate, an overnight bank borrowing rate, has its biggest impact on the short end of the maturity spectrum, how do you explain the fact that short term rates have not changed much?
    The increase in interest rates is not just specific to the US, with rises in rates across other currencies, as you can see in this graph of ten-year Euro, Yen and Yuan rates:

The Japanese Yen and Euro rates are up significantly over the month, but the Yuan rate has seen no change in March 2026. Staying with the market narrative, this indicates higher inflation across countries and currencies.
    While there are many who are speculating on what higher inflation and oil prices will do to the economy, and investment banks and data services (See Moody'sGoldman Sachs) have been rushing to update their forecasts for the US economy, the market has not been in as much of a rush to make the judgment. The economy was showing signs of fatigue coming into March 2026, with anemic growth and employment numbers, and it is possible that the oil price shock will tip it over into a recession.

The Price of Risk
    The heightened uncertainty generated by war and its consequences has played its way out not just in oil prices and treasury rates, but in the prices that investors charge for risk. In a month where the clash between greed and risk took front stage, with the balance shifting often on a minute-by-minute basis during the trading day, we also see increases in the price that investors charge for taking risk in both equity and bond markets. In the equity market, that price of risk is the equity risk premium, a topic that I talked about extensively in this post and paper, with the argument that a good measure of this risk premium will be forward-looking and dynamic. My implied equity risk premium estimates tried to capture the changes in equity risk premiums on a daily basis, and completing the assessments for the entire month, here is what the equity risk premiums looked like in March 2026:


The surprise here is not that the equity risk premium rose over the course of the month, expected given what was happening in the Middle East, but that it rose so modestly. In fact, over the course of March, the implied equity risk premium for the S&P 500 rose from 4.37% on February 27, 2026, to 4.77%  at close of trading on March 31, 2026, an increase of 0.40% for the month.
    In the bond market, the price of risk is the bond default spread, and in the graph below, I look at default spreads for seven bond ratings classes from AAA to C (& below):


Here again, the spreads increased over the month, but only modestly, even at the lowest ratings classes. Thus, the BBB default spread over the 10-year treasury rose only 0.08% during the month, from 1.07% on February 27, 2026, to 1.15%on March 31, 2026, and the high yield spread (for CCC and below) increased from 9.50% at the start of March 2026 to 10.10% at the end of the month.
    The third proxy for risk is the volatility index (the VIX) for US equities, and that measure rose during the course of March 2026:


During March 2026, the VIX rose from19.86 at the start of the month to 25.25 by the end of the month, an increase much smaller than the increases we saw in March 2020 (COVID) or in the first week of April 2025 (Tariff week).
    With the caveat that this is still mid-narrative, the bottom line from the movement in all of these risk measures is that while the market had a bad month, much of the marking down in equity values can be attributed to real concerns about higher inflation and economic damage, and is not the result of panic selling, at least in the aggregate. To back this up, I took a look at two collectibles - gold, which has a history of holding its value or even increasing during crises and panics in financial markets, and bitcoin, which has not had that history so far, but is marketed by its advocates as a potential hedge:

Gold was down 10.42% during March 2026, uncommon for a crisis month, but bitcoin was up 3.30% during the month, and it is entirely in keeping with bitcoin investors marching to their own music, though it will be interesting to see how this dynamic plays out, as this repricing continues.

Effect across Geographies
    The war is in the Middle East, but there is no place to hide from its effects. To see how the war has played out in different regions, I looked at the change in aggregate market cap, in US dollar terms, in March 2026:

You may be surprised to see Africa & the Middle East and Eastern Europe & Russia show up as the best performing markets, with about 2% decreases in market capitalization, but it reflects the dual impact of the war. While it has wreaked havoc across the Middle East, the higher oil prices that it has brought with it are providing upside for oil producers that offsets some of the damage.
    Since these dollar returns reflect local market performance as well as the strength/weaknesses of their currencies against the dollar, I looked at the US dollar's performance in March 2026:

I know that I am piling on at this stage, but I do compute equity risk premiums for other countries twice a year, once at the start and once mid-year. Given how much March has shaken up the status quo, I will make an exception and re-estimate equity risk premiums, by country, updating both my mature market premium (which I estimate from the S&P 500) as well as the country ratings, default spreads and country equity risk premiums for other countries. 
Download spreadsheet with country ERPs

It is worth noting that these equity risk premiums are computed based upon sovereign ratings, which are slow to change, as the world convulses. That has been an issue with my ERP computations for Russia and Ukraine, since 2022, with the rating for the former withdrawn and the rating for the latter frozen at Ca (Moody's); I have use a country risk score from PRS for the last two years to update Russia's equity risk premium, an have done the same for the Ukraine in this update. You can see the same issues now, with the war in Iran rocking the boat, and at least for the Middle East, there is reason to believe that the ratings may understate country risk. While none of the countries in the war zone have seen their sovereign rating change (yet), these countries have market estimates of sovereign default risk in the form of sovereign CDS spreads, I looked at the movement in those spreads during the course of the month:

Not surprisingly, market measures of default risk are more sensitive to war effects, and have risen for much of the Middle East, as worries have mounted, with bigger increases in Qatar, the UAE and Turkey than in Saudi Arabia and Kuwait. The United States has also seen a surge in its sovereign CDS spread, and the global sovereign CDS spreads have risen about 12% in the first quarter of 2026. Using these sovereign CDS spreads as measures of default spreads for this part of the world may yield more realistic equity risk premiums.

What now?
    I noted at the start of this post that the uncertainties that manifested during March 2026 about the direction, duration and effects of war are still unresolved and perhaps even grown as we start April. As investors try to navigate their way through this period, here are the questions that you will need to answer to decide where you fall in the continuum between complacency to full-blown panic:
In the complacency scenario, the war ends quickly (in days or weeks, rather than months), the damaged  infrastructure  is repaired quickly and the new regime in Iran is viewed favorably by the rest of the world, allowing the sanctions on the country to be removed, it is likely that oil prices will drop, perhaps even to below pre-war levels, as Russian and Iranian oil is freely bought and sold. In the full-scale panic scenario, the war continues for months, with lasting damage to infrastructure and supply chains and Iran's new government stays sanctioned, oil prices are likely to stay high and perhaps even go higher, the global economy will be kneecapped and parts of the Middle East (Dubai and Abu Dhabi) that had created a business and tourist friendly setting will struggle to find their balance. 
    In either case, the war has shaken up the status quo, and I see lasting consequences that go well beyond oil. The capital flows from the oil rich countries which has flowed generously to everything from AI start ups to Premier League clubs will shrink, creating down-market effects.  That money, and the funds that were set aside to build vanity projects, from ski resorts in the deserts to state-of-the-art cities will be redirected to building pipelines and securing the flow of oil. Global politics has also been roiled, and even if the war ends quickly,  there is damage that has been done to partnerships and security agreements that cannot be undone. 

YouTube Video

Datasets

Friday, February 16, 2024

Catastrophic Risk: Investing and Business Implications

    In the context of valuing companies, and sharing those valuations, I do get suggestions from readers on companies that I should value next. While I don't have the time or the bandwidth to value all of the suggested companies, a reader from Iceland, a couple of weeks ago, made a suggestion on a company to value that I found intriguing. He suggested Blue Lagoon, a well-regarded Icelandic Spa with a history of profitability, that was finding its existence under threat, as a result of volcanic activity in Southwest Iceland. In another story that made the rounds in recent weeks, 23andMe, a genetics testing company that offers its customers genetic and health information, based upon saliva sample, found itself facing the brink, after a hacker claimed to have hacked the site and accessed the genetic information of millions of its customers. Stepping back a bit, one claim that climate change advocates have made not just about fossil fuel companies, but about all businesses, is that investors are underestimating the effects that climate change will have on economic systems and on value. These are three very different stories, but what they share in common is a fear, imminent or expected, of a catastrophic event that may put a company's business at risk. 

Deconstructing Risk

   While we may use statistical measures like volatility or correlation to measure risk in practice, risk is not a statistical abstraction. Its impact is not just financial, but emotional and physical, and it predates markets. The risks that our ancestors faced, in the early stages of humanity, were physical, coming from natural disasters and predators, and physical risks remained the dominant form of risk that humans were exposed to, almost until the Middle Ages. In fact, the separation of risk into physical and financial risk took form just a few hundred years ago, when trade between Europe and Asia required ships to survive storms, disease and pirates to make it to their destinations; shipowners, ensconced in London and Lisbon, bore the financial risk, but the sailors bore the physical risk. It is no coincidence that the insurance business, as we know it, traces its history back to those days as well.

    I have no particular insights to offer on physical risk, other than to note that while taking on physical risks for some has become a leisure activity, I have no desire to climb Mount Everest or jump out of an aircraft. Much of the risk that I think about is related to risks that businesses face, how that risk affects their decision-making and how much it affects their value. If you start enumerating every risk a business is exposed to, you will find yourself being overwhelmed by that list, and it is for that reason that I categorize risk into the groupings that I described in an earlier post on risk. I want to focus in this post on the third distinction I drew on risk, where I grouped risk into discrete risk and continuous risk, with the later affecting businesses all the time and the former showing up infrequently, but often having much larger impact. Another, albeit closely related, distinction is between incremental risk, i.e., risk that can change earnings, growth, and thus value, by material amounts, and catastrophic risk, which is risk that can put a company's survival at risk, or alter its trajectory dramatically.

    There are a multitude of factors that can give rise to catastrophic risk, and it is worth highlighting them, and examining the variations that you will observe across different catastrophic risk. Put simply, a  volcanic eruption, a global pandemic, a hack of a company's database and the death of a key CEO are all catastrophic events, but they differ on three dimensions:

  1. Source: I started this post with a mention of a volcano eruption in Iceland put an Icelandic business at risk, and natural disasters can still be a major factor determining the success or failure of businesses. It is true that there are insurance products available to protect against some of these risks, at least in some parts of the world, and that may allow companies in Florida (California) to live through the risks from hurricanes (earthquakes), albeit at a cost.  Human beings add to nature's catastrophes with wars and terrorism wreaking havoc not just on human lives, but also on businesses that are in their crosshairs. As I noted in my post on country risk, it is difficult, and sometimes impossible, to build and preserve a business, when you operate in a part of the world where violence surrounds you. In some cases, a change in regulatory or tax law can put the business model for a company or many company at risk. I confess that the line between whether nature or man is to blame for some catastrophes is a gray one and to illustrate, consider the COVID crisis in 2020. Even if you believe you know the origins of COVID (a lab leak or a natural zoonotic spillover), it is undeniable that the choices made by governments and people exacerbated its consequences. 
  2. Locus of Damage: Some catastrophes created limited damage, perhaps isolated to a single business, but others can create damage that extends across a sector geographies or the entire economy. The reason that the volcano eruptions in Iceland are not creating market tremors is because the damage is likely to be isolated to the businesses, like Blue Lagoon, in the path of the lava, and more generally to Iceland, an astonishingly beautiful country, but one with a small economic footprint. An earthquake in California will affect a far bigger swath of companies, partly because the state is home to the fifth largest economy in the world, and the pandemic in 2020 caused an economic shutdown that had consequences across all business, and was catastrophic for the hospitality and travel businesses.
  3. Likelihood: There is a third dimension on which catastrophic risks can vary, and that is in terms of likelihood of occurrence. Most catastrophic risks are low-probability events, but those low probabilities can become high likelihood events, with the passage of time. Going back to the stories that I started this post with, Iceland has always had volcanos, as have other parts of the world, and until recently, the likelihood that those volcanos would become active was low. In a similar vein, pandemics have always been with us, with a history of wreaking havoc, but in the last few decades, with the advance of medical science, we assumed that they would stay contained. In both cases, the probabilities shifted dramatically, and with it, the expected consequences.

Business owners can try to insulate themselves from catastrophic risk, but as we will see in the next sections those protections may not exist, and even if they do, they may not be complete. In fact, as the probabilities of catastrophic risk increase, it will become more and more difficult to protect yourself against the risk.

Dealing with catastrophic risk

    It is undeniable that catastrophic risk affects the values of businesses, and their market pricing, and it is worth examining how it plays out in each domain. I will start this section with what, at least for me, I is familiar ground, and look at how to incorporate the presence of catastrophic risk, when valuing businesses and markets. I will close the section by looking at the equally interesting question of how markets price catastrophic risk, and why pricing and value can diverge (again).

Catastrophic Risk and Intrinsic Value

    Much as we like to dress up intrinsic value with models and inputs, the truth is that intrinsic valuation at its core is built around a simple proposition: the value of an asset or business is the present value of the expected cash flows on it:

That equation gives rise to what I term the "It Proposition", which is that for "it" to have value, "it" has to affect either the expected cashflows or the risk of an asset or business. This simplistic proposition has served me well when looking at everything from the value of intangibles, as you can see in this post that I had on Birkenstock, to the emptiness at the heart of the claim that ESG is good for value, in this post. Using that framework to analyze catastrophic risk, in all of its forms, its effects can show in almost every input into intrinsic value:


Looking at this picture, your first reaction might be confusion, since the practical question you will face when you value Blue Lagoon, in the face of a volcanic eruption, and 23andMe, after a data hack, is which of the different paths to incorporating catastrophic risks into value you should adopt. To address this, I created a flowchart that looks at catastrophic risk on two dimensions, with the first built around whether you can buy insurance or protection that insulates the company against its impact and the other around whether it is risk that is specific to a business or one that can spill over and affect many businesses.


As you can see from this flowchart, your adjustments to intrinsic value, to reflect catastrophic risk will vary, depending upon the risk in question, whether it is insurable and whether it will affect one/few companies or many/all companies. 

A.  Insurable Risk: Some catastrophic risks can be insured against, and even if firms choose not to avail themselves of that insurance, the presence of the insurance option can ease the intrinsic valuation process. 
  • Intrinsic Value Effect: If the catastrophic risk is fully insurable, as is sometimes the case, your intrinsic valuation became simpler, since all you have to do is bring in the insurance cost into your expenses, lowering income and cash flows, leave discount rates untouched, and let the valuation play out. Note that you can do this, even if the company does not actually buy the insurance, but you will need to find out the cost of that foregone insurance and incorporate it yourself. 
  • Pluses: Simplicity and specificity, because all this approach needs is a line item in the income statement (which will either exist already, if the company is buying insurance, or can be estimated). 
  • Minuses: You may not be able to insure against some risks, either because they are uncommon (and actuaries are unable to estimate probabilities well enough, to set premiums) or imminent (the likelihood of the event happening is so high, that the premiums become unaffordable). Thus, Blue Lagoon (the Icelandic spa that is threatened by a volcanic eruption) might have been able to buy insurance against volcanic eruption a few years ago, but will not be able to do so now, because the risk is imminent. Even when risks are insurable, there is a second potential problem. The insurance may pay off, in the event of the catastrophic event, but it may not offer complete protection. Thus, using Blue Lagoon again as an example, and assuming that the company had the foresight to buy insurance against volcanic eruptions a few years ago, all the insurance may do is rebuild the spa, but it will not compensate the company for lost revenues, as customers are scared away by the fear of  volcanic eruptions. In short, while there are exceptions, much of insurance insures assets rather than cash flow streams.
  • Applications: When valuing businesses in developed markets, we tend to assume that these businesses have insured themselves against most catastrophic risks and ignore them in valuation consequently. Thus, you see many small Florida-based resorts valued, with no consideration given to hurricanes that they will be exposed to, because you assume that they are fully insured. In the spirit of the “trust, but verity” proposition, you should probably check if that is true, and then follow up by examining how complete the insurance coverage is.
2. Uninsurable Risk, Going-concern, Company-specific: When a catastrophic risk is uninsurable, the follow up questions may lead us to decide that while the risk will do substantial damage, the injured firms will continue in existence. In addition, if the risk affects only one or a few firms, rather than wide swathes of the market, there are intrinsic value implications.
  • Intrinsic Value Effect: If the catastrophic risk is not insurable, but the business will survive its occurrence even in a vastly diminished state, you should consider doing two going-concern valuations, one with the assumption that there is no catastrophe and one without, and then attaching a probability to the catastrophic event occurring. 
    Expected Value with Catastrophe = Value without Catastrophe (1 – Probability of Catastrophe) + Value with Catastrophe (Probability of Catastrophe)
    In these intrinsic valuations, much of the change created by the catastrophe will be in the cash flows, with little or no change to costs of capital, at least in companies where investors are well diversified.

  • Pluses: By separating the catastrophic risk scenario from the more benign outcomes, you make the problem more tractable, since trying to adjust expected cash flows and discount rates for widely divergent outcomes is difficult to do.
  • Minuses: Estimating the probability of the catastrophe may require specific skills that you do not have, but consulting those who do have those skills can help, drawing on meteorologists for hurricane prediction and on seismologists for earthquakes. In addition, working through the effect on value of the business, if the catastrophe occurs, will stretch your estimation skills, but what options do you have?
  • Applications: This approach comes into play for many different catastrophic risks that businesses face, including the loss of a key employee, in a personal-service business, and I used it in my post on valuing key persons in businesses. You can also use it to assess the effect on value of a loss of a big contract for a small company, where that contract accounts for a significant portion of total revenues. It can also be used to value a company whose business models is built upon the presence or absence of a regulation or law, in which case a change in that regulation or law can change value. 

3. Uninsurable Risk. Failure Risk, Company-specific: When a risk is uninsurable and its manifestation can cause a company to fail, it poses a challenge for intrinsic value, which is, at its core, designed to value going concerns. Attempts to increase the discount rate, to bring in catastrophic risk, or applying an arbitrary discount on value almost never work.
  • Intrinsic Value Effect: If the catastrophic risk is not insurable, and the business will not survive, if the risk unfolds, the approach parallels the previous one, with the difference being that that the failure value of the business, i.e, what you will generate in cash flows, if it fails, replaces the intrinsic valuation, with catastrophic risk built in:
    Expected Value with Catastrophe = Value without Catastrophe (1 – Probability of Catastrophe) + Failure Value (Probability of Catastrophe)
    The failure value will come from liquidation the assets, or what is left of them, after the catastrophe.
  • Pluses: As with the previous approach, separating the going concern from the failure values can help in the estimation process. Trying to estimate cash flows, growth rates and cost of capital for a company across both scenarios (going concern and failure) is difficult to do, and it is easy to double count risk or miscount it. It is fanciful to assume that you can leave the expected cash flows as is, and then adjust the cost of capital upwards to reflect the default risk, because discount rates are blunt instruments, designed more to capture going-concern risk than failure risk. 
  • Minuses: As in the last approach, you still have to estimate a probability that a catastrophe will occur, and in addition, and there can be challenges in estimating the value of a business, if the company fails in the face of catastrophic risk.
  • Applications: This is the approach that I use to value highly levered., cyclical or commodity companies, that can deliver solid operating and equity values in periods where they operate as going concerns, but face distress or bankruptcy, in the face of a severe recession. And for a business like the Blue Lagoon, it may be the only pathway left to estimate the value, with the volcano active, and erupting, and it may very well be true that the failure value can be zero.
4 & 5 Uninsurable Risk. Going Concern or Failure, Market or Sector wide: If a risk can affect many or most firms, it does have a secondary impact on the returns investors expect to make, pushing up costs of capital.
  • Intrinsic Value Effect: The calculations for cashflows are identical to those done when the risks are company-specific, with cash flows estimated with and without the catastrophic risk, but since these risks are sector-wide or market-wide, there will also be an effect on discount rates. Investors will either see more relative risk (or beta) in these companies, if the risks affect an entire sector, or in equity risk premiums, if they are market-wide. Note that these higher discount rates apply in both scenarios.
  • Pluses: The risk that is being built into costs of equity is the risk that cannot be diversified away and there are pathways to estimating changes in relative risk or equity risk premiums. 
  • Minuses: The conventional approaches to estimating betas, where you run a regression of past stock returns against the market, and equity risk premiums, where you trust in historical risk premiums and history, will not work at delivering the adjustments that you need to make.
  • Applications: My argument for using implied equity risk premiums is that they are dynamic and forward-looking. Thus, during COVID, when the entire market was exposed to the economic effects of the pandemic, the implied ERP for the market jumped in the first six weeks of the pandemic, when the concerns about the after effects were greatest, and then subsided in the months after, as the fear waned:

    In a different vein, one reason that I compute betas by industry grouping, and update them every year, is in the hope that risks that cut across a sector show up as changes in the industry averages. In 2009, for instance, when banks were faced with significant regulatory changes brought about in response to the 2008 crisis, the average beta for banks jumped from 0.71 at the end of 2007 to 0.85 two years later.
Catastrophic Risk and Pricing
    The intrinsic value approach assumes that we, as business owners and investors, look at catastrophic risk rationally, and make our assessments based upon how it will play out in cashflows, growth and risk. In truth, is worth remembering key insights from psychology, on how we, as human beings, deal with threats (financial and physical) that we view as existential.
  • The first response is denial, an unwillingness to think about catastrophic risks. As someone who lives in a home close to one of California's big earthquake faults, and two blocks from the Pacific Ocean, I can attest to this response, and offer the defense that in its absence, I would wither away from anxiety and fear. 
  • The second is panic, when the catastrophic risk becomes imminent, where the response is to flee, leaving much of what you have behind. 
When looking at how the market prices in the expectation of a catstrophe occurring and its consequences, both these human emotions play out, as the overpricing of businesses that face catastrophic risk, when it is low probability and distant, and the underpricing of these same businesses when catastrophic risk looms large. 

    To see this process at work, consider again how the market initially reacted to the COVID crisis in terms of repricing companies that were at the heart of the crisis. Between February 14, 2020 and March 23, 2020, when fear peaked, the sectors most exposed to the pandemic (hospitality, airlines) saw a decimation in their market prices, during that period:


With catastrophic risk that are company-specific, you see the same phenomenon play out. The market capitalization of many young pharmaceutical company have been wiped out by the failure of blockbuster drug, in trials. PG&E, the utility company that provides power to large portions of California saw its stock price halved after wildfires swept through California, and investors worried about the culpability of the company in starting them. 
    The most fascinating twist on how markets deal with risks that are existential is their pricing of fossil fuel companies over the last two decades, as concerns about climate change have taken center stage, with fossil fuels becoming the arch villain. The expectation that many impact investors had, at least early in this game, was that relentless pressure from regulators and backlash from consumers and investors would reduce the demand for oil, reducing the profitability and expected lives of fossil fuel companies.  To examine whether markets reflect this view, I looked at the pricing of fossil fuel stocks in the aggregate, starting in 2000 and going through 2023:

In the graph to the left, I chart out the total market value for all fossil fuel companies, and note a not unsurprising link to oil prices. In fact, the one surprise is that fossil fuel stocks did not see surges in market capitalization between 2011 and 2014, even as oil prices surged.  While fossil fuel pricing multiples have gone up and down, I have computed the average on both in the 2000-2010 period and again in the 2011-2023 period. If the latter period is the one of enlightenment, at least on climate change, with warnings of climate change accompanied by trillions of dollars invested in combating it, it is striking how little impact it has had on how markets, and investors in the aggregate, view fossil fuel companies. In fact, there is evidence that the business pressure on fossil fuel companies has become less over time, with fossil fuel stocks rebounding in the last three years, and fossil fuel companies increasing investments and acquisitions in the fossil fuel space. 
    Impact investors would point to this as evidence of the market being in denial, and they may be right, but market participants may point back at impact investing, and argue that the markets may be reflecting an unpleasant reality which is that despite all of the talk of climate change being an existential problem, we are just as dependent on fossil fuels today, as we were a decade or two decades ago:

Don’t get me wrong! It is possible, perhaps even likely, that investors are not pricing in climate change not just in fossil fuel stocks, and that there is pain awaiting them down the road. It is also possible that at least in this case, that the market's assessment that doomsday is not imminent and that humanity will survive climate change, as it has other existential crises in the past. 
    
Mr. Market versus Mad Max Thunderdome
    The question posed about fossil fuel investors and whether they are pricing in the risks of gclimated change can be generalized to a whole host of other questions about investor behavior. Should buyers be paying hundreds of millions of dollars for a Manhattan office building, when all of New York may be underwater in a few decades? Lest I be accused of pointing fingers, what will happen to the value of my house that is currently two blocks from the beach, given the prediction of rising oceans. The painful truth is that if doomsday events (nuclear war, mega asteroid hitting the earth, the earth getting too hot for human existence) manifest, it is survival that becomes front and center, not how much money you have in your portfolio. Thus, ignoring Armageddon scenarios when valuing businesses and assets may be completely rational, and taking investors to task for not pricing assets correctly will do little to alter their trajectory! There is a lesson here for policy makers and advocates, which is that preaching that the planet is headed for the apocalypse, even if you believe it is true, will induce behavior that will make it more likely to happen, not less.
    On a different note, you probably know that I am deeply skeptical about sustainability, at least as preached from the Harvard Business School pulpit. It remains ill-defined, morphing into whatever its proponents want it to mean. The catastrophic risk discussion presents perhaps a version of sustainability that is defensible. To the extent that all businesses are exposed to catastrophic risks, some company-level and some having broader effects, there are actions that businesses can take to, if not protect to themselves, at least cushion the impact of these risks. A personal-service business, headed by an aging key person, will be well served designing a succession plan for someone to step in when the key person leaves (by his or her choice or an act of God). No global company was ready for COVID in 2020, but some were able to adapt much faster than others because they were built to be adaptable. Embedded in this discussion are also the limits to sustainability, since the notion of sustaining  a business at any cost is absurd. Building in adaptability and safeguards against catastrophic risk makes sense only if the costs of doing so are less than the potential benefits, a simple but powerful lesson that many sustainability advocates seem to ignore, when they make grandiose prescriptions for what businesses should and should not do to avoid the apocalypse.

YouTube


Saturday, March 19, 2022

Russia in Ukraine: Let Loose the Dogs of War!

As the world's attention is focused on the war in the Ukraine, it is the human toll, in death and injury, that should get our immediate attention, and you may find a focus on economics and markets to be callous. However, I am not a political expert, with solutions to offer that will bring the violence to an end, and I don't think that you have come here to read about my views on humanity. Consequently, I will concentrate this post on how this crisis is playing out in markets, and the effects it has had, so far, on businesses and investments, and whether these effects are likely to be transient or permanent.

The Lead In

To understand the market effects of the Russia-Ukraine conflict, we need to start with an assessment of the two countries, and their places in the global political, economic and market landscape, leading in. Russia was undoubtedly a military superpower, with its vast arsenal of nuclear weapons and army, but economically, it has never punched that weight. Ukraine, a part of the Soviet Union, has had its shares of ups and downs, and its economic footprint is even smaller. The pie chart below, provides a measure of the gross domestic product of Russia and Ukraine, relative to the rest of the world:

While Russia's share of the global economy is small, it does have a significant standing in the natural resource space, as a leading producer and exporter of oil/gas, coal and nickel, among other commodities. Ukraine is also primarily a natural resource producer, especially iron ore, albeit on a smaller scale.


Russia was also a leading exporter of these commodities, with a disproportionately large share of its oil and gas production going to Europe; in 2021, Russian gas accounted to 45% of EU gas imports.

The Market Reaction

   As the rhetoric of war has heated up in the last few months, markets were wary about the possibility of war, but as Russian troops have advanced into the Ukraine, that wariness has turned to sell off across markets. In this section, I will begin by looking at the bond market effects and then move on to equities and other asset classes, starting by looking at the localized reaction (for Ukranian and Russian securities) and then the global ripple effects.

Bond Markets and Default Risk

    In times of trouble, the first to panic are often lenders to the entities involved, and in today's markets, the extent of the reaction to country-level troubles can be captured in real time in the sovereign CDS (Credit Default Swap) markets. The graph below shows the sovereign spreads for Russia and Ukraine in the weeks leading up and including the conflict:


The sovereign CDS spread for Russia, which started the year at 1.70% soared above 25%, just after hostilities commenced, and were trading at 10.56% on March 16, after rumors that peace talks were underway brought them down. The sovereign CDS spread for the Ukraine started the year at 6.17% and climbed in the first few days of the crisis to more than 100% (effectively uninsurable) before settling in on March 16 at 28.62%. Even the ratings agencies, normally slow to act, have been moving promptly, with Moody's lowering Russia's rating from Ba2 to B3 on March 3, from B3 to Ca on March 6 and from Ca to C on March 8, and Ukraine's rating from B3 to Caa2 on March 4. Other ratings agencies have also taken similar actions.
    The worries about default have not stayed isolated to Russia and Ukraine, as ripple effects have shown up first in the countries that are geographically closest to the conflict (Eastern Europe) and more generally on sovereign CDS spreads in the rest of the world. The graph below looks at average spreads, by region, before and after the hostilities started:

Change in Sovereign CDS, by Region
There are no surprises in this table, with the effects on spreads being greatest for East European countries. Note, though, that while sovereign CDS spreads increased almost 51% between January 1, 2022 and March 16, 2022, in these countries, the overall riskiness of the region remains low, the average spread at 1.30%. The Middle East is the only region that saw a decrease in sovereign CDS spreads, as oil, the primary mechanism for monetization in this region, saw its price surge during the last few weeks. The Canadian sovereign CDS spread widened, but US and EU country spreads remained relatively stable.
    The increase in default spreads was not restricted to foreign markets, as fear also pushed up spreads in the corporate bond market. In the table below, I look at default spreads on bonds in different ratings, across US companies, on January 1, 2022 and March 16, 2022:

It is worth noting that corporate bond spreads, which were are at historic lows to start the year, were already starting to widen before Russia's military moved into the Ukraine on February 24, 2022, but the invasion has pushed the spreads further up at the lower ends of the default spectrum. The overriding message in all of this data is that Russia/Ukraine war has unleashed fears in the bond market, and once unleashed that fear has pushed up worries about default and default risk premia across the board.

Equity Markets and Equity Risk Premiums

    Lenders may be the first to worry, when there is a crisis that puts their payments at risk, but equity investors are often with them, pushing down stock prices and pushing up equity risk premiums. Again, I will start with Russian and Ukranian equities, using country indices to capture the aggregate effect on these markets, from the invasion:

Russia: RTX Russian Traded $ Index, Ukraine: Ukraine PFTS Index
Neither index is particularly representative, and currency effects contaminate both, but they tell the story of devastation in the two markets. In fact, since trading has been suspended on both indices, the extent of the damage is probably understated. To get a better sense of how Russian equities, in particular, have fared in the aftermath of the invasion, I looked at four higher profile Russian companies,:

The four Russian companies that I picked are representative of the Russian economy: Lukoil is a stand-in for Russia's oil businesses, Sberbank is Russia's most dynamic bank, a part of almost every aspect of Russian financial services, Severstal is a global steel company with roots and a significant market share in Russia and Yandex is Russia's largest technology company. In addition to being traded on the MICEX, the Russian exchange, these companies all have listings in foreign markets (Yandex has a US listing and the other three are listed on the London Exchange). The collapse in stock prices has been calamitous, with each of the four stocks losing almost all of their value, and with trading suspended since the end of February, it is still unclear whether the trading will open up, and if so at what price.
A knee-jerk contrarian strategy may indicate that you should be buying all these stocks, as soon as they open for trading, but a note of caution is needed. The price drop in these companies, especially severe at Sberbank, is not necessarily an indication that these companies will cease to exist, but that the Russian government may effectively nationalize them, leaving equity worthless.
    As Russian equities have imploded, the ripple effects again are being felt across the globe. The table below summarizes the market cap change, by region of the world:
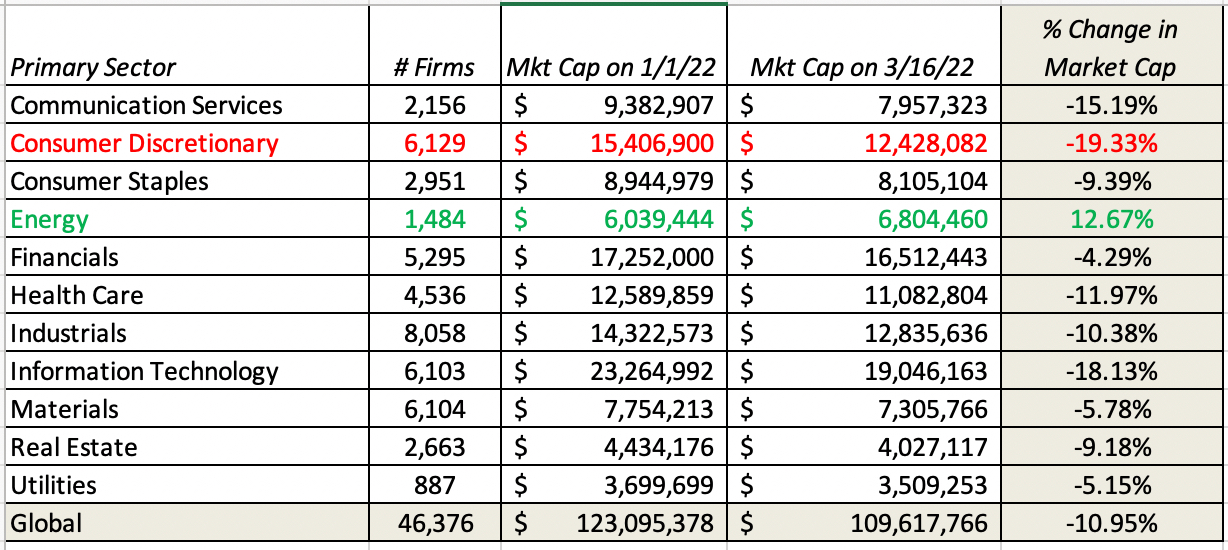
It is no surprise that Eastern Europe and Russia, which are in the eye of the hurricane, have seen the most damage to equities, but other than the Middle East, every other equity market in the world is down, with the US, EU and China shedding significant market capitalization. Slicing the data based on sector yields the following:
Against, there are no surprises, with energy being the only sector to post positive returns and with consumer discretionary and technology generating the most negative returns. Finally, I looked at firms based upon price to book ratios as of January 1, 2022, as a rough proxy for growth/maturity, and at net debt to EBITDA multiples, as a measure of indebtedness:

In this crisis, the conventional wisdom has held, at least so far, with mature companies holding their values better than growth companies. Since these mature companies tend to carry more debt, you see more indebted companies doing much better than less indebted companies. While the value crowd, bereft of victories for a long time, may be inclined to do a victory dance, it is worth noting that the same phenomenon occurred between February and March of 2020, at the start of the COVID crisis, but that growth companies quickly recouped their losses and finished ahead of mature companies by the end of 2020.
   In keeping with my belief that it is the price of risk that is changing during a crisis, causing contortions in prices, I estimated the implied equity risk premium for the S&P 500, by day, starting on January 1, 2022, going through March 16, 2022, in the graph below:
Note that equities were already under pressure in the weeks before the invasion, as inflation fears surfaced again, and then hostilities have put further pressure on them. The implied equity risk premium, which started the year at 4.24%, was  at 4.73% by March 16, and the expected return on equity, which was close to an all-time low at 5.75% at the start of the year, was now up to 6.92%, still lower than historical norms, but closer to the numbers that we have seen in the last decade.

Flight to Safety and Collectibles
    As in any crisis, there was a rush to safety, accentuated by wealthy Russians trying to move their wealth to safe havens, with safety defined not just in terms of currency, but also in terms of being beyond the reach of US and European regulators and legislators. In the graph below, I start with two traditional havens for US investors, the US dollar and treasury bonds:
Trade-weighted dollar & US 10-year T.Bond Rate
The dollar has strengthened since February 23, with the trade weighted dollar rising about 3% in value, but the ten-year treasury bond, after an initial rise in prices (and drop in yields) has reversed course, perhaps as inflation concerns overwhelm safe haven benefits. I also looked at crisis investments, starting with gold, an asset that has held this status for centuries and contrasting it with bitcoin, millennial gold:


Gold, which started the year at just above $1,800 an ounce, rose from $1,850 on February 23 to peak at $2,050/oz a few days ago, before dropping back below $2,000/oz on March 16. Bitcoin, which started the year at about $46,000, had a strong first half of November, also rose at the start of this crisis, but seems to have given back almost all of its gains. To the extent that crypto holdings may be more difficulties for authorities to trace and lay claim on, it will be interesting to see if you see a rise in the prices of crypto currencies as Russian wealth looks for sanctuary.

Economic Consequences

    It is difficult to argue that people were taken by surprise by the events unfolding in the Ukraine, since the lead in has been long and well documented. It can be traced back to 2014, when Russia annexed Crimea, setting in motion a period of uncertainty and sanctions, and the global economy and Russia seemed to have weathered those challenges well. As this crisis plays out in financial markets, roiling the price of risk in both bond and equity markets, the other question that has to be asked is about the long term economic consequences of the crisis for the global economy.

Commodity Prices and Inflation Expectations

    Given Russia's standing as a lead player in commodity markets, and its role in supplying oil and gas to Europe specifically, it should come as no surprise that the markets for the commodities that Russia produces in abundance has been the most impacted, at least in the short term:

All four commodities saw their prices soar in the aftermath of February 23, with oil rising to $130 a barrel, before falling back below $100, and trading in the nickel market suspended on March 7, after prices rose about $100,000 a ton. Even as prices rose in the spot market, the futures market indicated that many participants believed that the price rise would be temporary, with futures prices closer to $80 a barrel, for a year ahead and two year ahead futures contracts.

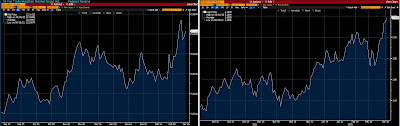
    In a market already concerned about expected inflation, the rise in commodity prices operated as fuel on fire, and pushed expectations higher. In the graph below, I list out two measures of expected inflation, one from a inflation expectations ETF (ProShares Inflation Expectation ETF) and the other from the Federal Reserve 5-year forward inflation measure, computed as the difference between treasury and TIPs rates.

Both measures indicate heightened concerns about future inflation, and these are undoubtedly also behind the increase in the US ten-year treasury bond rate from 1.51% to 2.19%, this year.

Consumer Confidence and Economic Growth

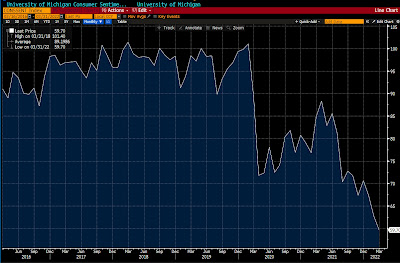
    The question that hangs over not just markets but economic policy makers is how this crisis will affect global economic growth and prospects. It is too early to pass final judgment, but the early indications are that it has dented consumer confidence, as the latest reading from the University of Michigan consumer survey indicates:

University of Michigan Consumer Sentiment

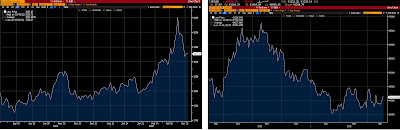
Consumer sentiment is now more negative than it was at any time during the COVID crisis in 2020, and if consumers pull back on purchases, especially of discretionary and durable goods, it will have a negative effect on the economy. While the contemporaneous numbers on the US economy on unemployment and production still look robust, worries about recession are rising, at least relative to where they were before the hostilities. The graph below looks at the median forecasts of recession probabilities for the US, on the left, and for the Eurozone, on the right (from Bloomberg):

Median forecast probability of recession, US (left) and Eurozone (right)

As a result of the events of the last three weeks, forecasters have increased the probabilities of recessions from 15% to 20% for the US and from 17.5% to 25% for the Eurozone.

Investment Implications: Asset Classes, Geographies and Companies

    The Russian invasion of Ukraine has undoubtedly increased uncertainty, affected prices for financial assets and commodities and exacerbated issues that were already roiling markets prior to the invasion. For investors trying to recapture their footing in the aftermath, there are multiple questions that need answers. The first is whether a radical shift in asset allocation is needed, given how these perturbations, across asset classes, geographies and sectors. The second is how the disparate market sell off, small in some segments and large in others, over the last few months has altered the investment potential in individual companies in these segments.  On January 1, 2022, I valued the S&P 500, building in the expectation that the economy would stay strong for the year and that interest rates would rise over the course of time from the then prevailing value (1.51%) to 2.50% over five years, and arrived at a value of 4,320 for the index, about 10.3% lower than the traded value of 4766. While that was only ten weeks ago, the index has since shed 7.03% of its value, the T.Bond rate has risen to 2.19% and Russia's invasion of the Ukraine have increased commodity prices and the likelihood of a recession. I revisited my valuation of the index, with the updated values:

Spreadsheet to value the S&P 500

There are two things to note in this valuation. The first is that I have raised the target rate for the US T.Bond to 3%, reflecting both the increase that has already occurred this year, and concerns about how current events may be adding to expected inflation. The second is that I continue to use analyst estimates of earnings, and at least as of this week (with estimates from March 14, 2022), analysts do not seem to be lowering earnings to reflect recession concerns. That may either reflect their belief that this storm will pass without affecting the US economy significantly or a delay in incorporating real world concerns. If you open the spreadsheet, I offer you the option of adjusting expected earnings, if you believe analysts are being unrealistic in their forecasts. The net effect of the changes is that my estimated value of the index is now 4197, making the index over valued by 5.6% as of March 16, 2022.
    More generally, the question that investors face as they decide whether to reallocate their portfolios is whether the market has over or under reacted to events on the ground. 
  • If you are a knee-jerk contrarian, your default belief is that markets over react, and you would be buying into the most damaged asset classes, which would include US, European and Chinese stocks (worst performing geographies), and especially those in technology and consumer discretionary spaces (worst performing sectors), and selling those investments (energy companies and commodities like oil,  that have benefited the most from the turmoil. 
  • If, on the other hand, you believe that investors are not fully incorporating the effects of the long term damage from this war, you would reverse the contrarian strategy, and buy the geographies and sectors that have benefited already and sell those that have been hurt. 
As an avowed non-market-timer, I think that both these strategies represent bludgeons in a market that needs scalpels. Rather than make broad sector or geographic bets, I would suggest making more focused bets on individual companies. In picking these companies, market corrections, painful though they have been, have opened up possibilities, for investors, though their stock picks will reflect their investment philosophies and their views on economic growth:
  1. Discounted Tech: During the course of 2022, markets have reassessed their pricing of tech stocks, and marked down their market capitalizations, for both older, and profitable tech and young, money-losing but high growth tech. A few weeks ago, I posted my valuation of the FANGAM stocks and noted that only one of them was under valued, at the prices prevailing then. In the last few days, every company on the list has dipped in price by enough to be at least fairly valued or even cheap. While there may be value in some young tech companies, any investments in these firms will be joint bets on the companies and a strong economy, and with the uncertainties about inflation and economic growth overhanging the market, I would be cautious.
  2. Safety First: If you have been spooked by market volatility and the Russian crisis, and believe that there is more volatility coming to the market in the rest of the year, your stock picks will reflect your fears. You are looking for companies with pricing power (to pass through inflation) and stable revenues, and in my view, and while you should start by looking in the conventional places (branded consumer products and food processing, pharmaceuticals), you should also take a look at some of the big names in technology.
  3. The Russia Play: For the true bargain hunters, the wipeout of market capitalization of Russian stocks (like Sberbank, Severstal, Lukoil and Yandex) will create temptation, but I would offer two notes of caution. The first is that you have to decide whether you can buy them in good conscience, and that is your judgment to make, not mine. The second is that corporate governance at Russian companies, even in their best days, is non-existent, and I do not know how this crisis will play out in the long term, at these companies. After all, your ownership stake in these companies is only as good as the legal structure backing it up, and in Russia, that your stake may be worthless, even if these companies recover. A less risky route would be to tag companies with significant exposure to Russia, such as Pepsi, McDonald's and Philip Morris, and evaluate whether the market is overreacting to that exposure. I have seen no evidence, so far, that this is the case, but that may change.
There is one final sobering note to add to this discussion, and that relates to low probability, potentially catastrophic events, and how markets deal with them. There is a worst case scenario in the Russia-Ukraine war, that few of us are willing to openly consider, where the conflagration spreads beyond the Ukraine, and nuclear and chemical weapons come into play. While the probability of this scenario may be very low, it is not zero, and to be honest, there is no investing strategy that will protect you from that scenario, but market pricing will reflect that fear. If we escape that doomsday scenario, and come back to something resembling normalcy, markets will bounce back, and in hindsight, it will look like they over reacted in the first place, even if the risk assessments were right, at the time. Put simply, assuming that crises will always end well, and that markets will inevitably bounce back, just because that is what you have observed in your lifetime, can be dangerous.

YouTube Video


Spreadsheets
Datasets