Stock markets have always rewarded winners with large capitalizations, and with each new threshold, the questions begin anew of whether animal spirits or fundamentals are driving the numbers. A few weeks ago, Nvidia seemed unstoppable as its market capitalization crested $5 trillion, and while markets have turned skeptical since, the core questions have not gone away, and the answers come from two extremes. At one end are the "realists”, who view themselves as rational, above the fray and entirely data-driven, who argue that there is no business model that can support a value this high, and that Nvidia is overvalued. At the other end are the “AI true believers”, who believe that if the market the company is going after is big enough, and they see AI as such a market, the upper bounds on value are released, the sky is the limit. As someone who entered the Nvidia sweepstakes early (in 2018) and has held it through much of its magical run, while expressing reservations about its pricing running ahead of its value, especially in the last three years, I will try to thread the needle (unsuccessfully, I am sure) in this post. In fact, rather than try to convince you that the company is under or overvalued, which is really your judgment to make, I will offer a simple model to reverse engineer from any given market capitalization, the revenues and profitability thresholds you have to meet, and allow you to come to your own conclusions.
A History of Market Cap Thresholds
In 1901, US Steel was created when Andrew Carnegie and J.P. Morgan consolidated much of the US steel business, with an eye to monopolizing the steel business, and the company became the first global firm with a market capitalization of a billion dollars, a small number in today's terms, but a number that was three times larger than the Federal budget in that year. The twentieth century was a good one for the US economy and US stocks, and the thresholds for highest market cap rose along the way:
Note the long stretch between Microsoft hitting the half-a-trillion dollar market cap in 1999, as the dot com boom peaked, and Apple doubling that threshold in 2018. Note also the quickening of the pace, as Apple hit the $2 trillion and $3 trillion market capitalization thresholds in the next four years, and Nvidia continued the streak hitting $4 trillion in 2024 and $5 trillion in 2025.
The table does provide a starting point to discussing multiple themes about how the US economy and US equities have evolved over the last century. You can see the shift away from the smokestack economy to technology , in the companies hitting the thresholds, with US Steel and GM firmly in the old economy mode, Microsoft, Apple, and Nvidia representing the new economy, and GE, with its large financial service arm, operating as a bridge. Having been in markets for all of the thresholds breached since 1981, the debate about whether the company breaking through has risen too much in too short a time period has been a recurring one.
Substance: To get a measure of operating substance, I looked at the revenues and net income in the year leading into the year in which each company broke through the threshold. As you can see, US Steel had revenues of $0.56 billion and net income of $0.13 billion in 1901, the year in which its market cap exceeded $1 billion. GM, at the time its market cap breached $10 billion, had revenues of $9.83 billion, on which it generated net income of $0.81 billion; if PE ratios are your pricing metric of choice, that would have translated into a PE ratio of 12.35. Between 2018 and 2022, as Apple's market cap tripled from $1 trillion to $3 trillion, its annual revenues increased by 72%, and its net profits almost doubled. Finally, coming to Nvidia, the surge in market cap to $4 trillion in 2024 and $5 trillion in 2025 has come on revenues and net income that are about a quarter of the size of Apple's revenues and net income.
Life cycle: Every company that climbed to the top of the market cap tables and hit a market cap threshold historically has had single-digit revenue growth in the year leading up, with two exceptions: Microsoft in 1999, which was coming off a 28% revenue growth rate in 1998, and Nvidia in both 2024 and 2025 coming off even higher growth rates. Using this revenue growth rate in conjunction with the ages of the companies involved, I think it is fair to conclude that there has been a shift across time, with the mature companies (older, lower growth) that were at the top of the list for much of the twentieth century to much younger companies with growth potential rising to the top in this one.
Investment returns: Looking at the returns in the years after these companies hit their market cap thresholds, the results are mixed. While buying Apple in 2018, 2020, or 2022 would have yielded winning returns, at least over the next year or two, buying Microsoft in 1999 would not. In some of these cases, extending the time horizon would have made a difference, for the positive with Microsoft and for the negative with GE.
From a rational perspective, you could argue that these thresholds (billion, half a billion, trillion, etc.) are arbitrary and that there is nothing gained by focusing on them, but in a post that I wrote in September 2018 on Apple and Microsoft becoming trillion-dollar companies, I argued that crossing these arbitrary thresholds can draw attention to the numbers, with the effects cutting both ways, drawing in investors who regret missing out on the rising market cap in the periods before (a positive) and causing existing investors to take a closer look at what they are getting in return (perhaps a negative).
Market Caps: Pathways to Intrinsic Value Break Even
Debates about whether a company is worth what it is trading for, whether it be a billion, ten billion, a hundred billion, or a trillion, devolve into shouting matches of "he said, she said", with each side staking out divergent perspectives on value and name-calling the other. Having been on the receiving end of some of that abuse, I decided to take a different pathway to examining this question. Rather than wonder whether Nvidia is worth five trillion or Eli Lilly is worth a trillion, I framed the question in terms of how much Nvidia or Eli Lilly would have to generate in revenues to justify their market capitalizations. The reason for my focus on revenues is simple since it is relatively unaffected by accounting games and can be compared to the total market size to gain perspective.
The tool that I plan to use to arrive at this breakeven revenue is intrinsic valuation, and I chose not to use the acronym "DCF" deliberately. A discounted cash flow valuation (DCF) sounds like an abstraction, with models driving discount rates and financial modeling driving cash flows. To me, a DCF is just a tool that allows you to assess how much you would pay for a business or the equity in the business, given its capacity to generate cash flows for its owners. Since it is easy to get lost in the labyrinth of estimates over time, I will simplify my DCF by doing two things. First, since our discussion is about market capitalization, i.e., the market's estimate of the value of equity, I will stay with an equity version of the model, where I focus on the cash flows that equity investors can get from the business and discount these cash flows back at a rate of return that they would demand for investing in that equity. In its most general form, this is what an equity valuation yields:
To simplify the assessment further, I structured this model to value equity in a mature company, i.e., one growing at or below the nominal growth rate of the economy in the very long term and again for simplicity, assumed that it could do this forever. The value of equity in this mature, long-lasting firm can be written as follows:
To put this model into use, let's take the $5 trillion dollar market capitalization that Nvidia commanded a few weeks ago and assign the following general inputs:
Cost of equity: Every month, I estimate the implied cost of equity for the S&P 500, and that number is model-agnostic and driven by what investors are willing to pay for stocks, given their fears and hopes. At the start of November 2025, that number was about 8%, with higher required returns (9-12%) for riskier stocks and lower expected returns (6-7%) for safer stocks.
Inflation rate: While inflation has come down from its 2022 highs, it has stayed stubbornly above 2%, which the Fed claims as its target, and it seems more realistic to assume that it will stay at 2.5%, which is consistent with the riskfree rate being about 4%.
Stable growth rate (nominal growth rate in the economy): This is a number that is in flux, as economists worry about recessions and economic growth, but since this is a long-term number that incorporates expected inflation, it seems reasonable to assume an expected nominal growth of 4% for the economy (about 1.5% real growth).
The net profit margin for Nvidia in the most recent twelve months has been 53.01%, an exceptionally high number, and the return on equity it has earned, on average over the last five years, is about 64.44%. I know that these numbers will come under pressure over time, as competition for AI chips picks up, and Nvidia's biggest customers (and chip maker) push for their share of the spoils, but even if you assume that Nvidia can maintain these margins, the revenue that Nvidia would have to deliver to justify its value is $483.38 billion.
Since Nvidia is still growing and you may need to wait, as equity investors, to get your cash flows, this breakeven number will get larger, the longer you have to wait and the lower the cash yield that equity investors receive during the growth period. In fact, with Nvidia, if you assume that it will take five years for them to grow to steady state, and that equity investors will receive a cash yield (cash flow as a percent of market cap) of 2% a year, the estimated breakeven revenue increases to $677.97 billion. The table below maps out the effects of waiting on breakeven revenues for a range of cash yield:
If, as seems reasonable, you assume that net margins and return on equity will decrease over time, the revenues you would need to break even will expand:
In fact, if you are a low-margin company, with net margins of 5% (as is the case with even the very best-run discount retailers) and a more modest return on equity of 10%, you will need revenues of $8 trillion or more to be able to get to a market capitalization of $5 trillion.
This framework can be used to compute breakeven revenues at other firms, and in the table below, we do so for the twelve largest market cap companies in the world, at their market capitalizations on November 20, 2025:
Note that, for simplicity, I have used a 2% cash yield and 4% growth rate in perpetuity for all of these firms, and that the breakeven revenues reflect current net margins and returns on equity at each of these firms, but with that said, there is still value in looking at differences. To allow for this comparison, I forecast out breakeven revenues five years from now, and estimated the growth that each company would need over the five years to justify its current market cap. Not surprisingly, Aramco can get to its breakeven revenues in year 5 with almost no growth (0.59% growth rate) but Tesla needs to deliver revenue growth of 86.4% to break even. Broadcom, another company that has benefited from the market's zeal for AI, has the next highest cliff to climb in terms of revenue growth. In fact, for all of the Mag Seven stocks, growth has to 15% or higher to breakeven, a challenge given their scale and size. In dollar value terms, three companies will need to get to breakeven revenues that exceed one trillion by year 5 to breakeven, Apple, Amazon and Tesla, but the first two are already more than a third of the way to their breakeven targets, but Tesla has a long, long way to go.
From Breakeven Revenues to Investment Action
While some are more comfortable replacing conventional intrinsic valuation, where you estimate value and compare it to price, with a breakeven assessment, the truth is that the two approaches are born out of the same intent.
The Economics of Breakeven Revenues
The model that I used to compute breakeven revenues is a vastly simplified version of a full equity valuation model, but even in its simplified form, you can see the drivers of breakeven revenues.
Market Capitalization: Since we work back from market capitalization to estimate breakeven revenues, the larger the market capitalization, holding all else constant, the greater the breakeven revenues will be. Using just Nvidia as an example, the company has seen its market capitalization rise from less than $400 billion in 2021, to $1 trillion in 2023, $2 trillion and $3 trillion thresholds in 2024 and crossed the $4 trillion and $ 5 trillion market cap levels in 2025. As the market cap has risen, the breakeven revenues have increased from $200 billion at the $1 trillion mark to $600 billion at the current market cap.
Operating Profitability: There are two profitability metrics in the drivers, with net margins determining how much of the revenues a company can convert to profits and the return on equity driving the reinvestment needed to sustain growth. Higher profitability will allow a company to deliver a higher market capitalization, at any given level of revenues. One reason manufacturing firms like Tesla will need higher breakeven revenues than software firms is that the unit economics are not as favorable.
Interest rates and equity risk premiums: The level of interest rates and equity risk premiums determine the cost of equity for all company, with higher values for the latter pushing up the costs of equity for riskier companies higher, relative to safer companies.
Operating and leverage risk: The riskiness in a business will push its cost of equity higher, and a higher debt load (relative to market cap) will have the same effect. A higher cost of equity will raise the breakeven revenues needed to deliver the same market capitalization.
In sum, while the breakeven revenue that you need to justify a given market cap always increases as the market cap increases, its level and rate of rise will be governed by business economics.
The 3Ps: Possible, Plausible, and Probable
Replacing a conventional intrinsic valuation with a breakeven revenue analysis still leaves open the final investment question of whether that breakeven revenue is a number that you are comfortable with, as an investor. To address this question, I will draw on a structure that I use for intrinsic valuation, where I put my assessment through what I call the 3P test.
It is possible that once you compute the breakeven revenues for a firm and measure it up against reality that it is impossible, i.e., a fairy tale. The most obvious case is when the breakeven revenues that you compute for your firm exceeds the total market for the products or services that it provides. If there is a lesson that tech companies learned in the last decade, it was in making the total addressable market (TAM) for their market into almost an art form, adding zeros and converting billion dollar markets into trillion dollar TAMs. If you pass the "it is possible" test, you enter the plausibility zone, and nuance and business economics enter the picture more fully. Thus, assuming that a luxury retailer with sky-high margins and small revenues, by staying with a niche market, can increase its revenues ten-fold, while keeping margins intact, is implausible, as is a net margin of 40% in stable growth for a company with gross margins that are barely above that number. Finally, assuming that revenues can multiply over time, without reinvesting in acquisitions or projects to deliver those revenues are also pushing the boundaries of what is plausible. Once breakeven revenues pass the possible and plausible tests, you should be on more familiar ground as you look at the entire story line for the company, and assess whether the combination of growth, profitability and reinvestment that you are assuming with your story has a reasonable probability of being delivered.
To apply these tests, consider Nvidia and Tesla. Nvidia needs about $590 billion in revenues by 2030 to break even at its current market capitalization of $4.3 trillion, requiring a growth rate in revenues of about 26% for the next five years. While that is a reach, it is both possible and plausible, with continued growth in the AI chip market and a dominant market share for Nvidia providing the pathway. It is on the probable test that you run into headwinds, since competition is heating up, and that will put pressure on both growth and margins. The problem for Tesla is that if the net margin stays low (at 5.31%), the revenues needed to breakeven exceed $2.2 trillion, and even with robotics and automated driving thrown into the business mix, you are pushing the limits of possibility. A Tesla optimist, though, would argue that these new businesses, when they arrive, will bring much higher net margins, which, in turn, will push down breakeven revenues and bring it into plausible territory.
The Aggregated 3P Test - Big Market Delusion
We tend to ask the 3P question at the company level with the companies that we choose to invest in (and like), but as we construct what look like plausible and probable stories for these companies, and invest in them accordingly, there are other investors are asking the same questions about the companies that they invest in, many of which compete in the same business as yours. That may sound unexceptional to you, but when the market that these companies are competing in is very large and still in formation, you can end up with what I described almost a decade ago as the big market delusion. In a paper on the topic, I used the dot.com boom, the cannabis stock surge and online advertising as case studies to explain how this behavior is a feature of big markets
The AI storyline clearly fits the big market delusion. There is talk of a "huge" market for AI products and services, with little to show as tangible evidence of that market’s existence right now, and that potential has drawn massive investments in AI architecture from tech companies. Along the way investors have also fallen under the spell of the big market, and have pushed up the market capitalizations of almost every company in the space. Using the language of breakeven revenues, investors in each of these companies is attributing large breakeven revenues to their chosen companies, but the delusion comes from the reality that if you aggregated these breakeven revenues across companies, the market is not big enough to sustain all of them. In short, each company passed the possible and plausible test, but in the aggregate, you are chasing an impossible target.
While the big market delusion is at play in every aspect of AI, one segment where it is most visible right now is in the Large Language Models (LLM) space, where high profile players like ChatGPT, Gemini, Grok and Claude are vying for users, and their creators are being rewarded with nosebleed pricing. OpenAI, while still unlisted, has used the early lead that ChatGPT gave it in the LLM race to attract investments from a host of big tech companies (including Nvidia and Amazon) and venture capitalists, with the most recent investors pricing it at $500 billion, an astonishing number, given that the company reported revenues of only $13 billion in the most recent twelve months. Anthropic, the creator of Claude, has seen its pricing jump in the most recent funding round (from Microsoft and Nvidia in November 2025) to $350 billion, fifty times its revenues of $7 billion in the last twelve months. Elon Musk's owners stake in xAI, Grok's originator, was estimated to be worth $230 billion in November 2025, again an immense multiple of its revenues of $3.2 billion (if you include combined revenues with X). Expanding the list to the large tech companies, it is undeniable that some of Alphabet's massive rise in market capitalization in 2025 is because of its ownership of Gemini, and that Meta (with Llama) and Amazon (with Nova) have also seen bumps in market capitalization. Finally, while Deepseek is no longer making headlines, it is also in the space, competing for business. In the aggregate, LLM ownership is being priced at $1.5 trillion or more, and the collective revenues, even generously defined, are less than $100 billion. It is entirely plausible that a big market exists for LLMs, and that one or even two of the players in this space will be winners, but in the aggregate, the market is overreaching.
The Management Effect
The mechanics of the breakeven revenue process may make it seem like managers are bystanders in the process and that investing can be on autopilot, but they are not. In fact, when market capitalizations rise, and breakeven revenues run well ahead of current revenues, I would argue that management matters more than ever. Going back to the breakeven revenues that we computed for the twelve largest market cap companies in the world, I would make the case that management matters much less (if at all) in Aramco and Berkshire Hathway, where breakeven revenues are close to current revenues, and the investments needed to deliver those revenues have already been made, that at the companies that still have steep climbs ahead of them to get to breakeven revenues.
In this context, I will reemphasize a concern that I raised at the height of Meta's metaverse investing fiasco, which is that investors at many tech companies, including most on the large cap list, have given up their corporate governance rights, often voluntarily (through the acceptance of shares with different voting rights), to founders and top management in these companies. When traditional corporate governance mechanisms break down, and top managers have unchecked power, there is an increased risk of overreach. That concern is multiplied in the LLM space, where Sam Altman (at OpenAI) and Elon Musk (at xAI) are more emperors than CEOs.
The Investing Bottomline
I started this post with mentions of market cap thresholds being breached, as the market pricing pushes up into the trillions for some of the biggest stock market winners. But what are the implications for investors?
Highly priced ≠ Overpriced: If you are an investor who considers any highly priced company to be overvalued, I hope that this post leads you to reconsider. By reframing a pricing in terms of breakeven revenues, profitability and reinvestment, it allows you to consider whether a stock, even if priced at $4 trillion, may still be a good buy.
The 3P test: Once you compute the operating metrics you need to breakeven on an investment in a highly priced company, passing those metrics through the 3P test (Is it possible? Is it plausible? Is it probable?) allows you to examine each company on its merits and potential, rather than use a broad brush or a rule of thumb (based on PE ratios or revenue multiples).
Room to disagree: I have never understood why, even if you believe strongly that a stock is over or under priced, that you need to evangelize that belief or contest people with alternate views. I think that the pathway that you would need (in terms of revenue growth and profitability) to justify Nvidia's and OpenAI's current pricing is improbable, but that is just my view, and it is entirely possible that you have an alternate perspective, leading to the conclusion that they are undervalued.
Reality checks: No matter what your view, optimistic or pessimistic, you have to be open to changing your mind, as you are faced with data. Thus, if you have priced a company to deliver 20% growth in revenues over the next five years (to break even) and actual revenues growth comes in at 10%, you have to be willing to revisit your story, admit that you were wrong, and adapt.
If you came into this post, expecting a definitive answer on whether Nvidia is overpriced, you are probably disappointed, but I hope that you use the breakeven spreadsheet to good effect to make up your own mind.
Last Wednesday (August 28), the market waited with bated breath for Nvidia’s earning call, scheduled for after the market closed. That call, at first sight, contained exceptionally good news, with revenues and earnings coming in at stratospheric levels, and above expectations, but the stock fell in the aftermath, down 8% in Thursday’s trading. That drop of more than $200 billion in market capitalization in response to what looked like good news, at least on the surface, puzzled market observers, though, as is their wont, they had found a reason by day end. This dance between companies and investors, playing out in expected and actual earnings, is a feature of every earnings season, especially so in the United States, and it has always fascinated me. In this post, I will use the Nvidia earnings release to examine what news, if any, is contained in earnings reports, and how traders and investors use that news to reframe their thinking about stocks.
Earnings Reports: The Components
When I was first exposed to financial markets in a classroom, I was taught about information being delivered to markets, where that information is processed and converted into prices. I was fascinated by the process, an interplay of accounting, finance and psychology, and it was the subject of my doctoral thesis, on how distortions in information delivery (delays, lies, mistakes) affects stock returns. In the real world, that fascination has led me to pay attention to earnings reports, which while overplayed, remain the primary mechanism for companies to convey information about their performance and prospects to markets.
The Timing
Publicly traded companies have had disclosure requirements for much of their existence, but those requirements have become formalized and more extensive over time, partly in response to investor demands for more information and partly to even the playing field between institutional and individual investors. In the aftermath of the great depression, the Securities Exchange Commission was created as part of the Securities Exchange Act, in 1934, and that act also required any company issuing securities under that act, i.e., all publicly traded firms, make annual filings (10Ks) and quarterly filings (10Qs), that would be accessible to investors.
The act also specifies that these filings be made in a timely manner, with a 1946 stipulation the annual filings being made within 90 days of the fiscal year-end, and the quarterly reports within 45 calendar days of the quarter-end. With technology speeding up the filing process, a 2002 rule changed those requirements to 60 days, for annual reports, and 40 days for quarterly reports, for companies with market capitalizations exceeding $700 million. While there are some companies that test out these limits, most companies file well within these deadlines, often within a couple of weeks of the year or quarter ending, and many of them file their reports on about the same date every year.
If you couple the timing regularity in company filings with the fact that almost 65% of listed companies have fiscal years that coincide with calendar years, it should come as no surprise that earnings reports tend to get bunched up at certain times of the year (mid-January, mid-April, mid-July and mid-October), creating “earnings seasons”. That said, there are quite a few companies, many of them high-profile, that preserve quirky fiscal years, and since Nvidia’s earnings report triggered this post, it is worth noting that Nvidia has a fiscal year that ends on January 31 of each year, with quarters ending on April 30, July 31 and October 31. In fact, the Nvidia earnings report on August 28 covered the second quarter of this fiscal year (which is Nvidia's 2025 fiscal year).
The Expectations Game
While corporate earnings reports are delivered once a quarter, the work of anticipating what you expect these reports to contain, especially in terms of earnings per share, starts almost immediately after the previous earnings report is delivered. In fact, a significant portion of sell side equity research is dedicated to this activity, with revisions made to the expected earnings, as you get closer and closer to the next earnings report. In making their earnings judgments and revisions, analysts draw on many sources, including:
The company’s history/news: With the standard caveat that the past does not guarantee future results, analysts consider a company’s historical trend lines in forecasting revenues and earnings. This can be augmented with other information that is released by the company during the course of the quarter.
Peer group reporting: To the extent that the company’s peer group is affected by common factors, it is natural to consider the positive or negative the operating results from other companies in the group, that may have reported earnings ahead of your company.
Other analysts’ estimates: Much as analysts claim to be independent thinkers, it is human nature to be affected by what others in the group are doing. Thus, an upward revision in earnings by one analyst, especially an influential one, can lead to revisions upwards on the part of other analysts.
Macro news: While macroeconomic news (about the economy, inflation or currency exchange rates) cuts across the market, in terms of impact, some companies are more exposed to macroeconomic factors than others, and analysts will have to revisit earnings estimates in light of new information.
The earnings expectations for individual companies, from sell side equity research analysts are publicly accessible, giving us a window on trend lines.
Nvidia is one of the most widely followed companies in the world, and most of the seventy plus analysts who publicly follow the firm play the estimation game, leading into the earnings reports. Ahead of the most recent second quarter earnings report, the analyst consensus was that the company would report revenues of $28.42 billion for the quarter, and fully diluted earnings per share of 64 cents; in the 30 days leading into the report, the earnings estimates had drifted up mildly (about 0.1%), with the delay in the Blackwell (NVidia’s new AI chip) talked about but not expected to affect revenue growth near term. It is worth noting that not all analysts tracking the stock forecast every metric, and that there was disagreement among them, which is also captured in the range on the estimates; on earnings per share, for instance, the estimates ranged from 60 to 68 cents, and on revenues, from $26 to $30 billion.
The pre-game show is not restricted to analysts and investors, and markets partake in the expectations game in two ways.
Stock prices adjust up or down, as earnings expectations are revised upwards or downwards, in the weeks leading up to the earnings report. Nvidia, which traded at $104 on May 23rd, right after the company reported its results for the first quarter of 2024, had its ups and down during the quarter, hitting an all-time high of $135.58 on June 18, 2024, and a low of $92.06, on August 5, before ending at $125.61 on August 28, just ahead of the earnings report:
During that period, the company also split its shares, ten to one, on June 10, a week ahead of reaching its highs.
Stock volatility can also changes, depending upon disagreements among analysts about expected earnings, and the expected market reaction to earnings surprises. That effect is visible not only in observed stock price volatility, but also in the options market, as implied volatility. For Nvidia, there was clearly much more disagreement among investors about the contents of the second quarter earnings report, with implied volatility spiking in the weeks ahead of the report:
While volatility tends to increase just ahead of earnings reports, the surge in volatility ahead of the second quarter earnings for Nvidia was unusually large, a reflection of the disagreement among investors about how the earnings report would play out in the market. Put simply, even before Nvidia reported earnings on August 28, markets were indicating more unease about both the contents of the report and the market reaction to the report, than they were with prior earnings releases.
The Event
Given the lead-in to earnings reports, what exactly do they contain as news? The SEC strictures that companies disclose both annual and quarterly results have been buffered by accounting requirements on what those disclosures should contain. In the United States, at least, quarterly reports contain almost all of the relevant information that is included in annual reports, and both have suffered from the disclosure bloat that I called attention to in my post on disclosure diarrhea. Nvidia’s second quarter earnings report, weighing in at 80 pages, was shorter than its annual report, which ran 96 pages, and both are less bloated than the filings of other large market-cap companies.
The centerpieces of the earnings report, not surprisingly, are the financial statements, as operating numbers are compared to expectations, and Nvidia’s second quarter numbers, at least at first sight, are dazzling:
The company’s astonishing run of the last few years continues, as its revenues, powered by AI chip sales, more than doubled over the same quarter last year, and profit margins came in at stratospheric levels. The problem, though, is that the company's performance over the last three quarters, in particular, have created expectations that no company can meet. While it is just one quarter, there are clear signs of more slowing to come, as scaling will continue to push revenue growth down, the unit economics will be pressured as chip manufacturers (TSMC) push for a larger slice and operating margins will decrease, as competition increases.
Over the last two decades, companies have supplemented the financial reports with guidance on key metrics, particularly revenues, margins and earnings, in future quarters. That guidance has two objectives, with the first directed at investors, with the intent of providing information, and the second at analysts, to frame expectations for the next quarter. As a company that has played the expectations game well, it should come as no surprise that Nvidia provided guidance for future quarters in its second quarter report, and here too, there were reminders that comparisons would get more challenging in future quarters, as they predicted that revenue growth rates would come back to earth, and that margins would, at best, level off or perhaps even decline.
Finally, in an overlooked news story, Nvidia announced that it would had authorized $50 billion in buybacks, over an unspecified time frame. While that cash return is not surprising for a company that has became a profit machine, it is at odds with the story that some investors were pricing into the stock of a company with almost unlimited growth opportunities in an immense new market (AI). Just as Meta and Alphabet’s dividend initiations signaled that they were approaching middle age, Nvidia’s buyback announcement may be signaling that the company is entering a new phase in the life cycle, intentionally or by accident.
The Scoring
The final piece of the earning release story, and the one that gets the most news attention, is the market reaction to the earnings reports. There is evidence in market history that earnings reports affect stock prices, with the direction of the effect depending on how actual earnings measure up to expectations. While there have been dozens of academic papers that focus on market reactions to earnings reports, their findings can be captured in a composite graph that classifies earnings reports into deciles, based upon the earnings surprise, defined as the difference between actual and predicted earnings:
As you can see, positive surprises cause stock prices to increase, whereas negative surprises lead to price drops, on the announcement date, but there is drift both before and after surprises in the same direction. The former (prices drifting up before positive and down before negative surprises) is consistent with the notion that information about earnings surprises leaks to markets in the days before the report, but the latter (prices continuing to drift up after positive or down after negative surprises) indicates a slow-learning market that can perhaps be exploited to earn excess returns. Breaking down the findings on earnings reports, there seems to be evidence that the that the earnings surprise effect has moderated over time, perhaps because there are more pathways for information to get to markets.
Nvidia is not only one of the most widely followed and talked about stocks in the market, but one that has learned to play the expectations game well, insofar as it seems to find a way to beat them consistently, as can be seen in the following table, which looks at their earnings surprises over the last 5 years:
Nvidia Earnings Surprise (%)
Barring two quarters in 2022, Nvidia has managed to beat expectations on earnings per share every quarter for the last five years. There are two interpretations of these results, and there is truth in both of them. The first is that Nvidia, as with many other technology companies, has enough discretion in both its expenditures (especially in R&D) and in its revenue recognition, that it can use it to beat what analysts expect. The second is that the speed with which the demand for AI chips has grown has surprised everyone in the space (company, analysts, investors) and that the results reflect the undershooting on forecasts.
Focusing specifically on the 2025 second quarter, Nvidia beat analyst expectations, delivering earnings per share of 68 cents (above the 64 cents forecast) and revenues of $30 billion (again higher than the $28.4 billion forecast), but the percentage by which it beat expectations was smaller than in the most recent quarters. That may sound like nitpicking, but the expectations game is an insidious one, where investors move the goal posts constantly, and more so, if you have been successful in the past. On August 28, after the earnings report, Nvidia saw share prices drop by 8% and not only did that loss persist through the next trading day, the stock has continued to lose ground, and was trading at $106 at the start of trading on September 6, 2028.
Earnings Reports: Reading the Tea Leaves
So what do you learn from earnings reports that may cause you to reassess what a stock is worth? The answer will depend upon whether you consider yourself more of a trader or primarily an investor. If that distinction is lost on you, I will start this section by drawing the contrast between the two approaches, and what each approach is looking for in an earnings report.
Value versus Price
At the risk of revisiting a theme that I have used many times before, there are key differences in philosophy and approach between valuing an asset and pricing it.
The value of an asset is determined by its fundamentals – cash flows, growth and risk, and we attempt to estimate that value by bringing in these fundamentals into a construct like discounted cash flow valuation or a DCF. Looking past the modeling and the numbers, though, the value of a business ultimately comes from the story you tell about that business, and how that story plays out in the valuation inputs.
The price of an asset is set by demand and supply, and while fundamentals play a role, five decades of behavioral finance has also taught us that momentum and mood have a much greater effect in pricing, and that the most effective approach to pricing an asset is to find out what others are paying for similar assets. Thus, determining how much to pay for a stock by using a PE ratio derived from looking its peer group is pricing the stock, not valuing it.
The difference between investing and trading stems from this distinction between value and price. Investing is about valuing an asset, buying it at a price less than value and hoping that the gap will close, whereas trading is almost entirely a pricing game, buying at a low price and selling at a higher one, taking advantage of momentum or mood shifts. Given the very different perspectives the two groups bring to markets, it should come as no surprise that what traders look for in an earnings report is very different from what investors see in that same earnings report.
Earnings Reports: The Trading Read
If prices are driven by mood and momentum, it should come as no surprise that what traders are looking for in an earnings report are clues about how whether the prevailing mood and momentum will prevail or shift. It follows that traders tend to focus on the earnings per share surprises, since its centrality to the report makes it more likely to be a momentum-driver. In addition, traders are also swayed more by the theater around how earnings news gets delivered, as evidenced, for instance, by the negative reaction to a recent earnings report from Tesla, where Elon Musk sounded downbeat, during the earnings call. Finally, there is a significant feedback loop, in pricing, where the initial reaction to an earnings report, either online or in the after market, can affect subsequent reaction. As a trader, you may learn more about how an earnings report will play out by watching social media and market reaction to it than by poring over the financial statements.
For Nvidia, the second quarter report contained good news, if good is defined as beating expectations, but the earnings beat was lower than in prior quarters. Coupled with sober guidance and a concern the stock had gone up too much and too fast, as its market cap had increased from less than half a trillion to three trillion over the course of two years, the stage was set for a mood and momentum shift, and the trading since the earnings release indicates that it has happened. Note, though, that this does not mean that something else could not cause the momentum to shift back, but before you, as an Nvidia manager or shareholder, are tempted to complain about the vagaries of momentum, recognize that for much of the last two years, no stock has benefited more from momentum than Nvidia.
The Investing Read
For investors, the takeaways from earnings reports should be very different. If value comes from key value inputs (revenues growth, profitability, reinvestment and risk), and these value inputs themselves come from your company narrative, as an investor, you are looking at the earnings reports to see if there is information in them that would change your core narrative for the company. Thus, an earnings report can have a significant effect on value, if it significantly changes the growth, profitability or risk parts of your company’s story, even though the company’s bottom line (earnings per share) might have come in at expectations. Here are a few examples:
A company reporting revenue growth, small or even negligible for the moment, but coming from a geography or product that has large market potential, can see its value jump as a consequence. In 2012, I reassessed the value of Facebook upwards, a few months after it had gone public and seen its stock price collapse, because its first earnings report, while disappointing in terms of the bottom line, contained indications that the company was starting to succeed in getting its platform working on smart phones, a historical weak spot for the firm.
You can also have a company reporting higher than expected revenue growth accompanied by lower than anticipated profit margins, suggesting a changing business model, and thus a changed story and valuation. Earlier this year, I valued Tesla, and argued that their lower margins, while bad news standing alone, was good news if your story for Tesla was that it would emerge as a mass market automobile company, capable of selling more cars than Volkswagen and Toyota. Since the only pathway to that story is with lower-priced cars, the Tesla strategy of cutting prices was in line with that story, albeit at the expense of profit margins.
A company reporting regulatory or legal actions directed against it, that make its business model more costly or more risky to operate, even though its current numbers (revenues, earnings etc.) are unscathed (so far).
In short, if you are an investor, the most interesting components of the report are not in the proverbial bottom line, i.e., whether earnings per share came in below or above expectations, but in the details. Finally, as investors, you may be interested in how earnings reports change market mood, usually a trading focus, because that mood change can operate as a catalyst that causes the price-value gap to close, enriching you in the process.
The figure below summarizes this section, by first contrasting the value and pricing processes, and then looking at how earnings releases can have different meanings to different market participants.
As in other aspects of the market, it should therefore come as no surprise that the same earnings report can have different consequences for different market participants, and it is also possible that what is good news for one group (traders) may be bad news for another group (investors).
Nvidia: Earnings and Value
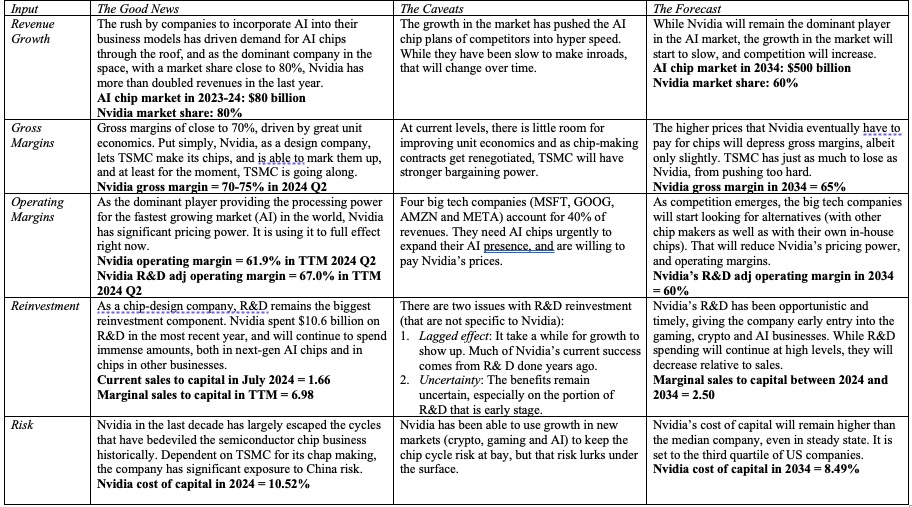
My trading skills are limited, and that I am incapable of playing the momentum game with any success. Consequently, I am not qualified to weigh in on the debate on whether the momentum shift on Nvidia is temporary or long term, but I will use the Nvidia second quarter earnings report as an opportunity to revisit my Nvidia story and to deliver a September 2024 valuation for the company. My intrinsic valuation models are parsimonious, built around revenue growth, profit margins and reinvestment, and I used the second quarter earnings report to review my story (and inputs) on each one:
Nvidia: Valuation Inputs (Sept 2024)
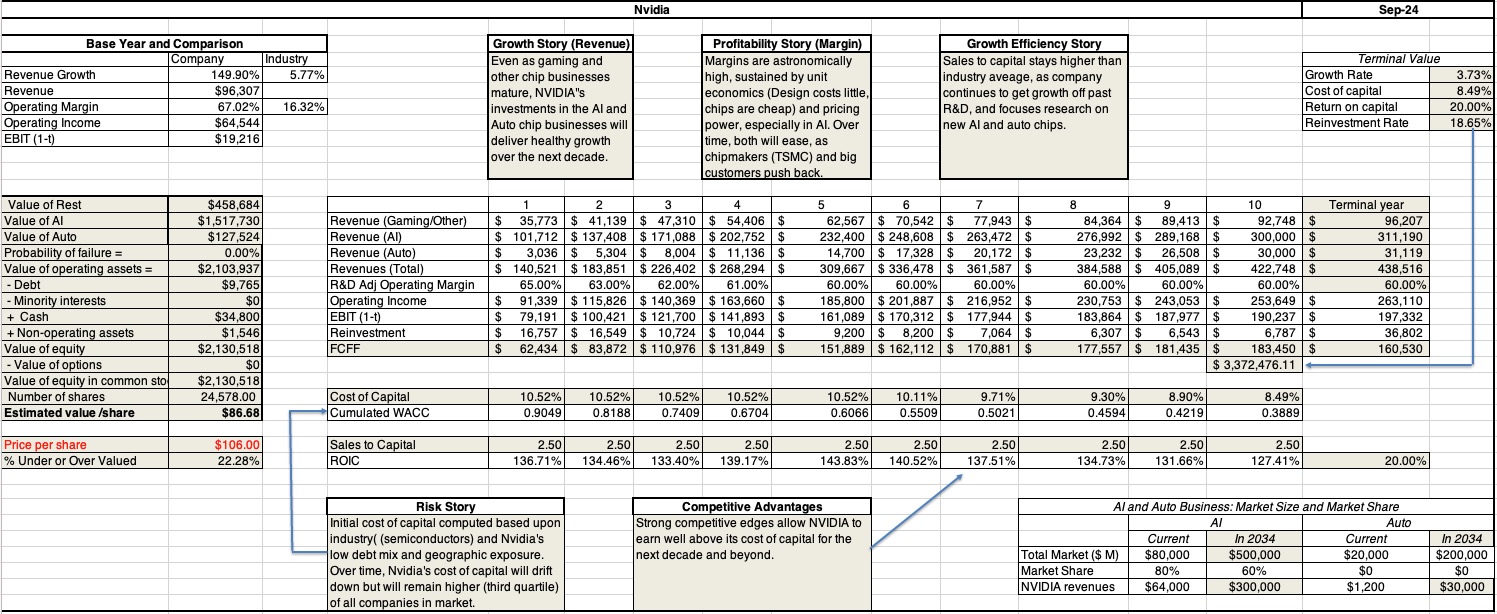
With these input changes in place, I revalued Nvidia at the start of September 2024, breaking its revenues, earnings and cash flows down into three businesses: an AI chip business that remains its central growth opportunity, and one in which it has a significant lead on the competition, an auto chip business where it is a small player in a small game, but one where there is potential coming from demand for more powerful chips in cars, and the rest, including its existing business in crypto and gaming, where growth and margins are solid, but unlikely to move dramatically. While traders may be disappointed with Nvidia’s earnings release, and wish it could keep its current pace going, I think it is both unrealistic and dangerous to expect it to do so. In fact, one reason that my story for Nvidia has become more expansive, relative to my assessment in June 2023, is that the speed with which AI architecture is being put in place is allowing the total market to grow at a rate far faster than I had forecast last year. In short, relative to where I was about a year ago, the last four earnings reports from the company indicate that the company can scale up more than I thought it could, has higher and more sustainable margins than I predicted and is perhaps less exposed to the cycles that the chip business has historically been victimized by. With those changes in place, my value per share for Nvidia in is about $87, still about 22% below the stock price of $106 that the stock was trading at on September 5, 2024, a significant difference but one that is far smaller than the divergence that I noted last year.
As always, the normal caveats apply. The first is that I value companies for myself, and while my valuations drive my decisions to buy or sell stocks, they should not determine your choices. That is why my Nvidia valuation spreadsheet is available not just for download, but for modification, to allow you to tell your own story for Nvidia, yielding a different value and decision. The second is that this is a tool for investors, not traders, and if you are playing the trading game, you will have to reframe the analysis and think in terms of mood and momentum. Looking back, I am at peace with the decision made in the summer of 2023 to shed half my Nvidia shares, and hold on to half. While I left money on the table, with the half that I sold, I have been richly compensated for holding on to the other half. I am going to count that as a win and move on!