Showing posts with label Interest Rates. Show all posts

Tuesday, January 28, 2025

Data Update 4 for 2025: Interest Rates, Inflation and Central Banks!

It was an interesting year for interest rates in the United States, one in which we got more evidence on the limited power that central banks have to alter the trajectory of market interest rates. We started 2024 with the consensus wisdom that rates would drop during the year, driven by expectations of rate cuts from the Fed. The Fed did keep its end of the bargain, cutting the Fed Funds rate three times during the course of 2024, but the bond markets did not stick with the script, and market interest rates rose during the course of the year. In this post, I will begin by looking at movements in treasury rates, across maturities, during 2024, and the resultant shifts in yield curves. I will follow up by examining changes in corporate bond rates, across the default ratings spectrum, trying to get a measure of how the price of risk in bond markets changed during 2024.

Treasury Rates in 2024

    Coming into 2024, interest rates had taken a rollicking ride, surging in 2022, as inflation made its come back, before settling in 2023. At the start of 2024, the ten-year treasury rate stood at 3.88%, unchanged from its level a year prior, but the 3-month treasury bill rate had climbed to 5.40%. In the chart below, we look the movement of treasury rates (across maturities) during the course of 2024:

Download daily data

During the course of 2024, long term treasury rates climbed in the first half of the year, and dropped in the third quarter, before reversing course and increasing in the fourth quarter, with the 10-year rate ending  the year at 4.58%, 0.70% higher than at the start of the year. The 3-month treasury barely budged in the first half of 2024, declined in the third quarter, and diverged from long term rates and continued its decline in the last quarter, to end the year at 4.37%, down 1.03% from the start of the year. I have highlighted the three Fed rate actions, all cuts to the Fed Funds rate, on the chart, and while I will come back to this later in this post, market rates rose after all three.

    The divergence between short term and long term rates played out in the yield curve, which started 2024, with a downward slope, but flattened out over the course of the year:

Download daily data

Writing last year about the yield curve, which was then downward sloping, I argued that notwithstanding prognostications of doom,  it was a poor prediction of recessions. This year, my caution would be to not read too much, at least in terms of forecasted economic growth, into the flattening or even mildly upward sloping yield curve. 
    The increase in long term  treasury rates during the course of the year was bad news for treasury bond investors, and the increase in the 10-year treasury bond rate during the course of the year translated into an annual return of -1.64% for 2024:

With the inflation of 2.75% in 2024 factored in, the real return on the 10-year bond is -4.27%. With the 20-year and 30-year bonds, the losses become larger, as time value works its magic. It is one reason that I argue that any discussion of riskfree rates that does not mention a time horizon is devoid of a key element. Even assuming away default risk, a ten-year treasury is not risk free, with a one time horizon, and a 3-month treasury is definitely not riskfree, if you have a 10-year time horizon.

The Drivers of Interest Rates

    Over the last two decades, for better or worse, we (as investors, consumers and even economics) seem to have come to accept as a truism the notion that central banks set interest rates. Thus, the answer to questions about past interest rate movements (the low rates between 2008 and 2021, the spike in rates in 2022) as well as to where interest rates will go in the future has been to look to central banking smoke signals and guidance. In this section, I will argue that the interest rates ultimately are driven by macro fundamentals, and that the power of central banks comes from preferential access to data about these fundamentals, their capacity to alter those fundamentals (in good and bad ways) and the credibility that they have to stay the course.

Inflation, Real Growth and Intrinsic Riskfree Rates

    It is worth noting at the outset that interest rates on borrowing pre-date central banks (the Fed came into being in 1913, whereas bond markets trace their history back to the 1600s), and that lenders and borrowers set rates based upon fundamentals that relate specifically to what the former need to earn to cover  expected inflation and default risk, while earning a rate of return for deferring current consumption (a real interest rate). If you set the abstractions aside, and remove default risk from consideration (because the borrower is default-free), a riskfree interest rate in nominal terms can be viewed, in its simplified form, as the sum of the expected inflation rate and an expected real interest rate:

Nominal interest rate = Expected inflation + Expected real interest rate

This equation, titled the Fisher Equation, is often part of an introductory economics class, and is often quickly forgotten as you get introduced to more complex (and seemingly powerful) monetary economics lessons. That is a pity, since so much of misunderstanding of interest rates stems from forgetting this equation. I use this equation to derive what I call an "intrinsic riskfree rate", with two simplifying assumptions:

  1. Expected inflation: I use the current year's inflation rate as a proxy for expected inflation. Clearly, this is simplistic, since you can have unusual events during a year that cause inflation in that year to spike. (In an alternate calculation, I use an average inflation rate over the last ten years as the expected inflation rate.)
  2. Expected real interest rate: In the last two decades, we have been able to observe a real interest rate, at least in the US, using inflation-protected treasury bonds(TIPs). Since I am trying to estimate an intrinsic real interest rate, I use the growth rate in real GDP as my proxy for the real interest rate. That is clearly a stretch when it comes to year-to-year movements, but in the long term, the two should converge.
With those simplistic proxies in place, my intrinsic riskfree rate can be computed as follows:
Intrinsic riskfree rate = Inflation rate in period t + Real GDP growth rate in period t
In the chart below, I compare my estimates of the intrinsic riskfree rate to the observed ten-year treasury bond rate each year:

Download data

While the match is not perfect, the link between the two is undeniable, and the intrinsic riskfree rate calculations yield results that help counter the stories about how it is the Fed that kept rates low between 2008 and 2021, and caused them to spike in 2022. 

  • While it is true that the Fed became more active (in terms of bond buying, in their quantitative easing phase) in the bond market in the last decade, the low treasury rates between 2009 and 2020 were driven primarily by low inflation and anemic real growth. Put simply, with or without the Fed, rates would have been low during the period.
  • In 2022, the rise in rates was almost entirely driven by rising inflation expectations, with the Fed racing to keep up with that market sentiment. In fact, since 2022, it is the market that seems to be leading the Fed, not the other way around.
Entering 2025, the gap between intrinsic and treasury rates has narrowed, as the market consensus settles in on expectations that inflation will stay about the Fed-targeted 2% and that economic activity will be boosted by tax cuts and a business-friendly administration.

The Fed Effect

    I am not suggesting that central banks don't matter or that they do not affect interest rates, because that would be an overreach, but the questions that I would like to address are about how much of an impact central banks have, and through what channels. To the first question of how much of an impact, I started by looking at the one rate that the Fed does control, the Fed Funds rate, an overnight interbank borrowing rate that nevertheless has resonance for the rest of the market. To get a measure of how the Fed Funds rate has evolved over time, take a look at what the rate has done between 1954 and 2024:

As you can see the Fed Funds was effectively zero for a long stretch in the last decade, but has clearly spiked in the last two years. If the Fed sets rates story is right, changes in these rates should cause market set rates to change in the aftermath, and in the graph below, I look at monthly movements in the Fed Funds rate and two treasury rates - the 3-month T.Bill rate and the 10-year T.Bond rate.


The good news for the "Fed did it" story is that the Fed rates and treasury rates clearly move in unison, but all this chart shows is that Fed Funds rate move with treasury rates contemporaneously, with no clear indication of whether market rates lead to Fed Funds rates changing, or vice versa. To look at whether the Fed funds leads the rest of the market, I look at the correlation between changes in the Fed Funds rate and changes in treasury rates in subsequent months. 


As you can see from this table, the effects of changes in the Fed Funds rate on short term treasuries is positive, and statistically significant, but the relationship between the Fed Funds rate and 10-year treasuries is only 0.08, and barely meets the statistical significance test. In summary, if there is a case to be made that Fed actions move rates, it is far stronger at the short end of the treasury spectrum than at the long end, and with substantial noise in predictive effects. Just as an add on, I reversed the process and looked to see if the change in treasury rates is a good predictor of change in the Fed Funds rate and obtained correlations that look very similar. 

In short, the evidence is just as strong for the hypothesis that market interest rates lead the Fed to act, as they are for "Fed as a leader" hypothesis.
    As to why the Fed's actions affect market interest rates, it has less to do with the level of the Fed Funds rate and more to do with the market reads into the Fed's actions. Ultimately, a central bank's effect on market interest rates stems from three factors:
  1. Information: It is true that the Fed collects substantial data on consumer and business behavior that it can use to make more reasoned judgments about where inflation and real growth are headed than the rest of the market, and its actions often are viewed as a signal of that information. Thus, an unexpected increase in the Fed Funds rate may signal that the Fed sees higher inflation  than the market perceives at the moment, and a big drop in the Fed Funds rates may indicate that it sees the economy weakening at a time when the market may be unaware.
  2. Central bank credibility: Implicit in the signaling argument is the belief that the central bank is serious in its intent to keep inflation in check, and that is has enough independence from the government to be able to act accordingly. A central bank that is viewed as a tool for the government will very quickly lose its capacity to affect interest rates, since the market will tend to assume other motives (than fighting inflation) for rate cuts or raises. In fact, a central bank that lowers rates, in the face of high and rising inflation, because it is the politically expedient thing to do may find that market interest move up in response, rather than down.
  3. Interest rate level: If the primary mechanism for central banks signaling intent remains the Fed Funds rate (or its equivalent in other markets), with rate rises indicating that the economy/inflation is overheating and rate cuts suggesting the opposite, there is an inherent problem that central banks face, if interest rates fall towards zero. The signaling becomes one sided i.e., rates can be raised to put the economy in check, but there is not much room to cut rates. This, of course, is exactly what the Japanese central bank has faced for three decades, and European and US banks in the last decade, reducing their signal power.
The most credible central banks in history, from the Bundesbank in Deutsche Mark Germany to the Fed, after the Volcker years, earned their credibility by sticking with their choices, even in the face of economic disruption and political pushback. That said, in both these instances, central bankers chose to stay in the background, and let their actions speak for themselves. Since 2008, central bankers, perhaps egged on by investors and governments, have become more visible, more active and, in my view, more arrogant, and that, in a strange way, has made their actions less consequential. Put simply, the more the investing world revolves around FOMC meetings and the smoke signals that come out of them, the less these meetings matter to markets. 

Forecasting Rates
    I am wary of Fed watchers and interest rate savants, who claim to be able to sense movements in rates before they happen for two reasons. First, their track records are so awful that they make soothsayers and tarot card readers look good. Second, unlike a company's earnings or risk, where you can claim to have a differential advantage in estimating it, it is unclear to me what any expert, no matter how credentialed, can bring to the table that gives them an edge in forecasting interest rates. In my valuations, this skepticism about interest rate forecasting plays out in an assumption where I do not try to second guess the bond market and replace current treasury bond rates with fanciful estimates of normalized or forecasted rates. If you look back at my S&P 500 valuation in my second data post for this year, you will see that I left the treasury bond rate at 4.58% (its level at the start of 2025) unchanged through time.
     If you feel the urge to play interest forecaster, I do think that it is good practice to make sure that your views on the direction of interest rates are are consistent with the views of inflation and growth you are building into your cash flows. If you buy into my thesis that it is changes in expected inflation and real growth that causes rates to change in interest rates, any forecast of interest rates has be backed up by a story about changing inflation or real growth. Thus, if you forecast that the ten-year treasury rate will rise to 6% over the next two years, you have to follow through and explain whether rising inflation or higher real growth (or both) that is triggering this surge, since that diagnosis have different consequences for value. Higher interest rates driven by higher inflation will generally have neutral effects on value, for companies with pricing power, and negative effects for companies that do not. Higher interest rates precipitated by stronger real growth is more likely to be neutral for the market, since higher earnings (from the stronger economy) can offset the higher rates. The most empty forecasts of interest rates are the ones where the forecaster's only reason for predicting higher or lower rates is central banks, and I am afraid that the discussion of interest rates has become vacuous over the last two decades, as the delusion that the Fed sets interest rates becomes deeply engrained.

Corporate Bond Rates in 2024

    The corporate bond market gets less attention that the treasury bond market, partly because rates in that market are very much driven by what happens in the treasury market. Last year, as the treasury bond rate rose from 3.88% to 4.58%, it should come as no surprise that corporate bond rates rose as well, but there is information in the rate differences between the two markets. That rate difference, of course, is the default spread, and it will vary across different corporate bonds, based almost entirely on perceived default risk. 

Default spread = Corporate bond rate - Treasury bond rate on bond of equal maturity

Using bond ratings as measures of default risk, and computing the default spreads for each ratings class, I captured the journey of default spreads during 2024:


During 2024, default spreads decreased over the course of the year, for all ratings classes, albeit more for the lowest rated bonds. Using a different lexicon, the price of risk in the bond market decreased during the course of the year, and if you relate that back to my second data update, where I computed a price of risk for equity markets (the equity risk premium), you can see the parallels. In fact, in the graph below, I compare the price of risk in both the equity and bond markets across time:


In most years, equity risk premiums and bond default spreads move in the same direction, as was the case in 2024. That should come as little surprise, since the forces that cause investors to spike up premiums (fear) or bid them down (hope and greed) cut across both markets. In fact, lookin a the ratio of the equity risk premium to the default spread, you could argue that equity risk premiums are too high, relative to bond default spreads, and that you should see a narrowing of the difference, either with a lower equity premium (higher stock prices) or a higher default spread on bonds.

    The decline of fear in corporate bond markets can be captured on another dimension as well, which is in bond issuances, especially by companies that face high default risk. In the graph below, I look at corporate bond issuance in 2024, broken down into investment grade (BBB or higher) and high yield (less than BBB). 


Note that high yield issuances which spiked in 2020 and 2021, peak greed years, almost disappeared in 2022. They made a mild comeback in 2023 and that recovery continued in 2024. 

    Finally, as companies adjust to a new interest rate environment, where short terms rates are no longer close to zero and long term rates have moved up significantly from the lows they hit before 2022, there are two other big shifts that have occurred, and the table below captures those shifts:


First, you will note that after a long stretch, where the percent of bond that were callable declined, they have spiked again. That should come as no surprise, since the option, for a company, to call back a bond is most valuable, when you believe that there is a healthy chance that rates will go down in the future. When corporates could borrow money at 3%, long term, they clearly attached a lower likelihood to a rate decline, but as rates have risen, companies are rediscovering the value of having a  calculability option. Second, the percent of bond issuances with floating rate debt has also surged over the last three years, again indicating that when rates are low, companies were inclined to lock them in for the long term with fixed rate issuances, but at the higher rates of today,  they are more willing to let those rates float, hoping for lower rates in future years.

In Conclusion
    I spend much of my time in the equity market, valuing companies and assessing risk. I must confess that I find the bond market far less interesting, since so much of the focus is on the downside, and while I am glad that there are other people who care about that, I prefer to operate in a space where there there is more uncertainty. That said, though, I dabble in bond markets because what happens in those markets, unlike what happens in Las Vegas, does not stay in bond markets. The spillover effects into equity markets can be substantial, and in some cases, devastating. In my posts looking back at 2022, I noted how a record bad year for bond markets, as both treasury and corporate bonds took a beating for the ages, very quickly found its ways into stocks, dragging the market down. On that count, bond markets had a quiet year in 2024, but they may be overdue for a clean up.

YouTube


Data Links

  1. Intrinsic risk free rates and Nominal interest rates
  2. Bond Default Spreads and Equity Risk Premiums

Friday, September 20, 2024

Fed up with Fed Talk? Fact-checking Central Banking Fairy Tales!

     The big story on Wednesday, September 18, was that the Federal Reserve’s open market committee finally got around to “cutting rates”, and doing so by more than expected. This action, much debated and discussed during all of 2024, was greeted as "big" news, and market prognosticators argued that it was a harbinger of market moves, both in interest rates and stock prices. The market seemed to initially be disappointed in the action, dropping after the Fed’s announcement on Wednesday, but it did climb on Thursday. Overall, though, and this is my view, this was about as anticlimactic as a climactic event gets, akin to watching an elephant in labor deliver a mouse.  As a long-time skeptic about the Fed’s (or any Central Bank’s) capacity to alter much in markets or the economy, I decided now would be as good a time as any to confront some widely held beliefs about central banking powers, and counter them with data. In particular, I want to start with the myth that central banks set interest rates, or at least the interest rates that you and I may face in our day-to-day lives, move on to the slightly lesser myth that the Fed's move lead market interest rates, then examine the signals that emanate supposedly from Fed actions, and finish off by evaluating how the Fed's actions affect stock prices.

The Fed as Rate Setter

      As I drove to the grocery story on Fed Cut Wednesday, I had the radio on, and in the news at the top of the hour, I was told that the Fed had just cut interest rates, and that consumers would soon see lower rates on their mortgages and businesses on their loans. That delusion is not restricted to newscasters, since it seems to be widely held among politicians, economists and even market watchers. The truth, though, is that the Fed sets only one interest rate, the Fed Funds rate, and that none of the rates that we face in our lives, either as consumers (on mortgages, credit cards or fixed deposits) or businesses (business loans and bonds),  are set by or even indexed to the Fed Funds Rate. 

    The place to start to dispel the “Fed sets rates” myth is with an understanding of the Fed Funds rate, an overnight intra-bank borrowing rate is one that most of us will never ever encounter in our lives. The Federal Open Market Committee (FOMC) has the power to change this rate, which it uses at irregular intervals, in response to economic, market and political developments. The table below lists the rate changes made by the Fed in this century:

Note that while most of these changes were made at regularly scheduled meetings, a few (eleven in the last three decades) were made at emergency meetings, called in response to market crises. As you can see from this table, the Federal Reserve goes through periods of Fed Funds rate activism, interspersed with periods of inactivity. Since the Fed Funds rate is specified as a range, there are periods where the effective Fed Funds rate may go up or down, albeit within small bounds. To gain perspective on how the Fed Funds rate has been changed over time, consider the following graph, where the effective fed funds rate is shown from 1954 to 2024:

Download data

In addition to revealing how much the Fed Funds rate has varied over time, there are two periods that stand out. The first is the spike in the Fed Funds rate to more than 20% between 1979 and 1982, when Paul Volcker was Fed Chair, and represented his attempt to break the cycle of high inflation that had entrapped the US economy. The second was the drop in the Fed Funds rate to close to zero percent, first after the 2008 crisis and then again after the COVID shock in the first quarter of 2020. In fact, coming into 2022, the Fed had kept the Fed Funds rates at or near zero for most of the previous 14 years, making the surge in rates in 2022, in response to inflation, shock therapy for markets unused to a rate-raising Fed.

    While the Federal Open Market Committee controls the Fed Funds rate, there are a whole host of rates set by buyer and sellers in bond markets. These rates are dynamic and volatile, and you can see them play out in the movements of US treasury rates (with the 3-month and 10-year rates highlighted) and in corporate bond rates (with the Baa corporate bond rate shown).

Download data

There is a final set of rates, set by institutions, and sometimes indexed to market-set rates, and these are the rates that consumers are most likely to confront in their day-to-day lives. They include mortgage rates, set by lenders, credit card rates, specified by the credit card issuers, and fixed deposit rates on safety deposits at banks.  They are not as dynamic as market-set rates, but they change more often than the Fed Funds rate.

Download data

There are undoubtedly other interest rates you will encounter, as a consumer or a business, either in the course of borrowing money or investing it, but all of these rates will fall into one of three buckets - market-set interest rates, rates indexed to market-set rates and institutionally-set rates. None of these rates are set by the Federal Reserve, thus rendering the "Fed sets interest rates" as myth.

Response to comments: It is true that the prime rate remains one of the few that is tied to the Fed Funds rate, and that there is subset of business loans, whose rates are tied to the prime rate. That said, the portion of overall business debt that is tied to the prime rate has declined significantly over time, as variable rate loans have switched to treasury rates as indices, because they tend to be updated and dynamic. It is also true that central-bank set rates can affect a larger subset of rates in some countries, for one of two reasons. The first is that the country has poorly functioning or no bond markets, making market-set rates a non-starter. The second is if the government or central bank can force banks to lend at rates tied to the central bank rate. In both cases, though, the central banking power works only if it is restrained by reality, i.e., the central bank rate reflects the inflation and real growth in the economy. Thus, if inflation is 20%, a central bank that forces lenders to lend at 12% will accomplish one of two objectives - driving lending banks to calamity or drying up the market for business loans.

The Fed as Rate Leader

    Even if you accept that the Fed does not set the interest rates that we face as consumers and businesses, you may still believe that the Fed influences these rates with changes it makes to the Fed Funds rate. Thus, you are arguing that a rise (fall) in the Fed Funds rate can trigger subsequent rises (falls) in both market-set and institution-set rates. At least superficially, this hypothesis is backed up in the chart below, where I brings all the rates together into one figure:

Download data

As you can see, the rates all seem to move in sync, though market-set rates move more than institution-set rates, which, in turn, are more volatile than the Fed Funds rate. The reason that this is a superficial test is because these rates all move contemporaneously, and there is nothing in this graph that supports the notion that it is the Fed that is leading the change. In fact, it is entirely possible, perhaps even plausible, that the Fed's actions on the Fed Funds rate are in response to changes in market rates, rather than the other way around.

    To test whether changes in the Fed Funds rate are a precursor for shifts in market interest rates, I ran a simple (perhaps even simplistic) test. I looked at the 249 quarters that compose the 1962- 2024 time period, breaking down each quarter into whether the effective Fed Funds rate increased, decreased or remained unchanged during the quarter. I followed up by looking at the change in the 3-month and 10-year US treasury rates in the following quarter:

Download data

Looking at the key distributional metrics (the first quartile, the median, the third quartile), it seems undeniable that the "Fed as leader" hypothesis falls apart. In fact, in the quarters after the  Fed Funds rate increases, US treasury rates (short and long term) are more likely to decrease than increase, and the median change in rates is negative. In contrast, in the periods after the Fed Fund decreases, treasury rates are more likely to increase than decrease, and post small median increases. 
    Expanding this assessment to the interest rates that consumers face, and in particular mortgage rates at which they borrow and fixed deposit rates at which they can invest, the results are just as stark.
Download data

In the quarter after the Fed Funds rate increase, mortgage rates and fixed deposit rates are more likely to fall than rise, with the median change in the 15-year mortgage rate being -0.13% and the median change in the fixed deposit rate at -0.05%. In the quarter after the Fed Funds rate decreases, the mortgage rate does drop, but by less than it did during the Fed rate raising quarters. In short, those of us expecting our mortgage rates to decline in the next few months, just because the Fed lowered rates on Wednesday, are being set up for disappointment. If you are wondering why I did not check to see what credit card interest rates do in response to Fed Funds rate changes, even a casual perusal of those rates suggests that they are unmoored from any market numbers.
    You may still be skeptical about my argument that the Fed is more follower than leader, when it comes to interest rates. After all, you may say, how else can you explain why interest rates remained low for the last decades, other than the Fed? The answer is recognizing that market-set rates ultimately are composed of two elements: an expected inflation rate and an expected real interest rate, reflecting real economic growth. In the graph below, which I have used multiple times in prior posts, I compute an intrinsic risk free rate by just adding inflation rate and real GDP growth each year:
Interest rates were low in the last decade primarily because inflation stayed low (the lowest inflation decade in a century) and real growth was anemic. Interest rates rose in 2022, because inflation made a come back, and the Fed scrambled to catch up to markets, and most interesting, interest are down this year, because inflation is down and real growth has dropped. As you can see, in September 2024, the intrinsic riskfree rate is still higher than the 10-year treasury bond rate, suggesting that there will be no precipitous drop in interest rates in the coming months.

Response to comments: Some readers are suggesting a plausible, albeit convoluted, rationale for this result that preserves the Fed Delusion. In a version of 4D chess, they argue that investors in bond markets are largely in the business of forecasting what the Fed will do and that market rates move ahead of Fed actions. Besides being extraordinarily unhealthy for bond investing, if this is in fact what it is happening, there are four problems with this reasoning, First, bond markets pre-date central banks setting rates, and they seemed to do a reasonably good job before the Fed Funds rate was around. In fact, I started in investing in the 1980s, when the Fed went into hibernation on the Fed Funds rate, and trust me when I say the bond market did not miss a beat. Second, if the entire point of bond investing is forecasting what the Fed will do, how would you explain the rise in treasury bill and bond rates in the first half of 2024 (just to give one instance), when all the talk was about the Fed cutting rates, not raising them? Third, if bond markets exist to bet on Fed movements, when the Fed moves unexpectedly (by raising or lowering rates more than expected), there should be an immediate adjustment in the bond market? Thus, last week, when the consensus was that a 25 basis point cut was more likely than a 50 basis point one, there should be have a significant drop in treasury rates in the days after, and there was not. 

The Fed as Signalman

    If you are willing to accept that the Fed does not set rates, and that it does not lead the market on interest rates, you may still argue that Fed rate changes convey information to markets, leading them to reprice bonds and stocks. That argument is built on the fact that the Fed has access to data about the economy that the rest of us don't have, and that its actions tell you implicitly what it is seeing in that data. 

    It is undeniable that the Federal Reserve, with its twelve regional districts acting as outposts, collects information about the economy that become an input into its decision making. Thus, the argument that Fed actions send signals to the markets has basis, but signaling arguments come with a caveat, which is that the signals can be tough to gauge. In particular, there are two major macroeconomic dimensions on which the Fed collects data, with the first being real economic growth (how robust it is, and whether there are changes happening) and inflation (how high it is and whether it too is changing). The Fed's major signaling device remains the changes in the Fed Funds rate, and it is worth pondering what the signal the Fed is sending when it raises or lowers the Fed Funds rate. On the inflation front, an increase or decrease in the Fed Funds rate can be viewed as a signal that the Fed sees inflationary pressures picking up, with an increase, or declining, with a decrease. On the economic growth front, an increase or decrease in the Fed Funds rate, can be viewed as a signal that the Fed sees the economy growing too fast, with an increase, or slowing down too much, with a decrease. These signals get amplified with the size of the cut, with larger cuts representing bigger signals.

    Viewed through this mix, you can see that there are two contrary reads of the Fed Funds rate cut of 50 basis points on Wednesdays. If you are an optimist, you could take the action to mean that the Fed is finally convinced that inflation has been vanquished, and that lower inflation is here to stay. If you are a pessimist, the fact that it was a fifty basis point decrease, rather than the expected twenty five basis points, can be construed as a sign that the Fed is seeing more worrying signs of an economic slowdown than have shown up in the public data on employment and growth. There is of course the cynical third perspective, which is that the Fed rate cut has little to do with inflation and real growth, and more to do with an election that is less than fifty days away. In sum, signaling stories are alluring, and you will hear them in the coming days, from all sides of the spectrum (optimists, pessimists and cynics), but the truth lies in  the middle, where this rate cut is good news, bad news and no news at the same time, albeit to different groups.

Response to comments: Fed rate change signals, as I mentioned, are tough to read. If you have strong priors on the Fed having power to drive markets, you can always the benefit of hindsight to bend the signal to match your priors. 

The Fed as Equity Market Whisperer

    It is entirely possible that you are with me so far, in my arguments that the Fed's capacity to influence the interest rates that matter is limited, but you may still hold on to the belief that the Fed's actions have consequences for stock returns. In fact, Wall Street has its share of investing mantras, including "Don't fight the Fed", where the implicit argument is that the direction of the stock market can be altered by Fed actions. 

    There is some basis for this argument, and especially during market crises, where timely actions by the Fed may alter market mood and momentum. During the COVID crisis, I complimented the Fed for playing its cards right, especially so towards the end of March 2020, when markets were melting down, and argued that one reason that market came back as quickly as they did was because of the Fed. That said, it was not so much the 100 basis point drop in the Fed Funds rate that turned the tide, but the accompanying message that the Federal Reserve would become a backstop for lenders to companies that were rocked by the COVID shutdown, and were teetering on the edge. While the Fed did not have to commit much in capital to back up this pledge, that decision seemed to provide enough reassurance to lenders and prevent a host of bankruptcies at the time.

    If you remove the Fed's role in crisis, and focus on the effects of just its actions on the Fed Funds rate, the effect of the Fed on equity market becomes murkier. I extended the analysis that I did with interest rates to stocks, and looked at the change in the S&P 500 in the quarter after Fed Funds rates were increased, decreased or left unchanged:

Download data
The S&P 500 did slightly better in quarters after the Fed Funds rate decreased than when the rate increased, but reserved its best performance for quarters after those where there was no change in the Fed Funds rate. At the risk of disagreeing with much of conventional wisdom, is it possible that the less activity there is on the part of the Fed, the better stocks do? I think so, and stock markets will be better served with fewer interviews and speeches from members of the FOMC and less political grandstanding (from senators, congresspeople and presidential candidates) on what the Federal Reserve should or should not do.

Response to comments: Here again, the 4D chess argument comes out, where equity markets are so clever and forward-looking, they already incorporate what the Fed will do. Without realizing it, you are making my case that when discussing equity markets and where they will go in the future, we should spend less time talking about what the Fed will do, might do or has not done, since if your premise about markets as forecasting machines is right, it is already in prices.

The Fed as Chanticleer

    If the Fed does not set rates, is not a interest rate driver, sends out murky signals about the economy and has little effect on how stocks move, you are probably wondering why we have central banks in the first place. To answer, I am going to digress, and repeat an ancient story about Chanticleer, a rooster that was anointed the ruler of the farmyard that he lived in, because the other barnyard animals believed that it was his crowing every morning that caused the sun to rise, and that without him, they would be destined for a lifetime of darkness. That belief came from the undeniable fact that every morning, Chanticleer's crowing coincided with sun rise and daylight. The story now takes a dark turn, when one day, Chanticleer sleeps in and the sun rises anyway, revealing his absence of power, and he loses his place at the top of the barnyard hierarchy. 

    The Fed (and every other central bank) in my view is like Chanticleer, with investors endowing it with powers to set interest rates and drive stock prices, since the Fed's actions and market movements seem synchronized. As with Chanticleer, the truth is that the Fed is acting in response to changes in markets rather than driving those actions, and it is thus more follower than leader. That said, there is the very real possibility that the Fed may start to believe its own hype, and that hubristic central bankers may decide that they set rates and drive stock markets, rather than the other way around. That would be disastrous, since the power of the Fed comes from the perception that it has power, and an over reach can lay bare the truth. 

Response to comments: My comments about the Fed being Chanticleer have been misread by some to imply that central banks do not matter, and Turkey (the country, not the Thanksgiving bird) seems to constantly come up constantly as an example of why central banks matter. Again, you are making my case for me. There is nothing more dangerous to an economy than a central bank that thinks it has the power to override fundamentals and impose its preferred interest rates in the economy. The Turkish central bank, perhaps driven by politics, seems to think that the solution to high interest rates (which are being driven by inflation) is to lower the rates that it controls. Not surprisingly, those actions increase expected inflation, and drive rates higher.... (see definition of insanity..)

Conclusion

    I know that this post cuts against the grain, since the notion that the Fed has superpowers has only become stronger over the last two decades. Pushed to explain why interest rates were at historic lows for much of the last decade, the response you often heard was "the Fed did it". Active investors, when asked why active investing had its worst decade in history, losing out to index funds and to passive investors, pointed fingers at the Fed. Market timers, who had built their reputations around using metrics like the Shiller PE, defended their failure to call market moves in the last fifteen years, by pointing to the Fed. Economists who argued that inverted yield curves were a surefire predictor of recessions blamed the Fed for the absence of a recession, after years of two years plus of the phenomena. 

    I believe that it is time for us to put the Fed delusion to rest. It has distracted us from talking about things that truly matter, which include growing government debt, inflation, growth and how globalization may be feeding into risk, and allowed us to believe that central bankers have the power to rescue us from whatever mistakes we may be making. I am a realist, though, and I am afraid that the Fed Delusion has destroyed enough investing brain cells, that those who holding on to the delusion cannot let go. I am already hearing talk among this group about what the FOMC may or may not do at its next meeting (and the meeting after that), and what this may mean for markets, restarting the Fed Watch. The insanity of it all! 

YouTube Video

Data

  1. Fed Funds Rates, Treasury Rates and Other Market Interest rates - Historical
  2. Intrinsic treasury bond rates


Monday, January 30, 2023

Data Update 3 for 2023: Inflation and Interest Rates

If 2022 was an unsettling year for equities, as I noted in my second data post, it was an even more tumultuous year for the bond market. The US treasury market, considered by some still as a safe haven, was anything but safe or a haven, especially at the long maturities, as long term rates soared, with inflation (not the Fed) being the key driver. As a result, treasury bond investors faced one of their worst years in history, losing close to a fifth of their principal, as bonds were repriced. The rise in rates transmitted to corporate bond market rates, with a concurrent rise in default spreads exacerbating the damage to investors. Just as rising equity risk premiums push up the cost of equity, rising default spreads push up the cost of debt of companies, with the added complication of higher default risk for those companies that had pushed to the limits of their borrowing capacity in a low interest-rate environment.  

US Treasuries: Risk and Time Horizon

In classrooms and in wealth managers’ offices, it has been standard practice to push US treasuries and highly rated corporate bonds as safe, and even with price changes factored in, as a portfolio stabilizer, with a mix of stocks and bonds forming a “balanced” portfolio. That is good advice in most years, but 2022 was not one of those years.

US Treasury Rates and Returns in 2022

   To say that 2022 was an eventful year for US treasuries is an understatement, as treasury rates, which started the year close to historic lows, soared during the course of the year. 

Download data
US Treasury rates rose across all maturities, but more so at the short end of the term structure (3 months, 1 year and 2 year) than at the long end (10 year or 30 year). The magnitude of the rises were also of historic proportions, with long term rates more than doubling, and short term rates climbing above the 4% mark. As a result of these rate changes, the term structure which started the year as upward sloping, ended the year downward sloping, giving rise to the usual talk of an imminent recession. As I have argued in prior posts, I believe too much is made of this indicator, but that is a subject for a different time.

Returns in 2022

    In my first classes in finance, as a student, I was taught that the US treasury rate was a risk free rate, with the logic being that since the US treasury could always print money, it would not default. Whether that is true is a debate with having, but even if you believe that there is no default risk in a US treasury, there is price risk, insofar as the price of a bond can and will move as interest changes change. In normal years, those price changes are small, and the return on a T.Bond, with coupons counted in will tend to be positive, but in years when rates move a lot, the price change effect can be considerable, with prices dropping (rising) as rates increase (decrease). Note also that the percentage price change for a given change in interest rates will be greater, for lower starting rates; an increase in the T.Bond rate from 2% to 3% will create a  more negative percentage price change than an increase the T.Bond rate from 5% to 6%. 

    With this context, it is easy to see why US treasury bonds were hit by the perfect storm in 2022, starting the year at a historically low level (1.51%) and going up by a historically high amount (up from 1.51% to 3.88%, an increase of 2.37%). The resulting price change and total return are shown below:

For simplicity, I have assumed annual rather than semi-annual coupons and for consistency, I have kept the maturity of the bond constant at ten years rather than drop it to nine years, after a year.

The total return on a ten-year T.Bond in 2022 was -17.83%, putting it almost on par with the negative returns on stocks in 2022 (-18.01%). Since inflation was 6.42% in 2022, the real return on a US 10-year treasury bond was -22.79%.

Historical Context

    In my earlier post, I noted that US equity market performance in 2022 made it the seventh worst year in stock market history, if you go back to 1928. The T.bond market performance put equities to shame, as it delivered the worst annual returns, in both nominal and real terms, in the 1928-2022 time period:


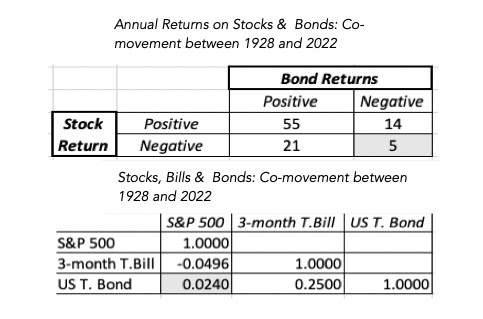
There were other measures on which the market set historical records, especially if you consider the co-performance of equity and bond markets. By themselves, stocks have had 26 negative return years in the last 95 years and, by themselves, bonds have had 19 negative returns over that period. That said, it is seldom that they have both delivered negative returns in the same year, as can be seen in the table below:

Over the 95-year period, there have been only five years where stocks and bonds have delivered negative returns in the same year, and of those five years, there has bee only one year where there were negative returns exceeding -10% in both markets, and that was 2022
    Investing is full of rules of thumb, and one of those rules that wealth managers have faithfully transmitted to their clients is the notion of a 60:40 mix in asset allocation, with 60% in stocks and 40% in bonds, backed up by the logic that this mix would deliver a more stable measure of returns over time. I will not take issue with that advice, though I find it far too rigid to work for all investor groupings, but in 2022, a 60:40 portfolio would have done little to insulate investors against risk, since stocks and bonds both delivered roughly the same returns (about -18%). 

The Drivers of Interest Rates

    It the question is why interest rates rose a lot in 2022, and if your answer to that question is the Fed, you have, in my view, lost the script. I know that in the last decade, it has become fashionable to attribute powers to the Fed that it does not have and view it as the ultimate arbiter of rates. That view has never made sense, because central banking power over rates is at the margin, and the key fundamental drivers of rates are expected inflation and real growth. 

    To immunize yourself against the Fed story, start with his graph, where I look at T.Bond rates over time, and compare them to what I term an intrinsic risk free rate, a simplistic measure obtained by adding the actual inflation rate each year to real GDP growth that year, in the US:

Download data
The mythology that it was that the Fed that kept rates low in the last decade (2011-2020) with quantitative easing and other rate gymnastics is quickly dispelled by this graph. It was the combination of low inflation and anemic growth that was at the heart of low rates, though the Fed did influence rates at the margin, perhaps pushing them down below their intrinsic levels with its machinations. As inflation has surged in the last two years, treasury bond rates have climbed, albeit at a much slower pace than inflation. That can be explained by the simple truth that it is expected inflation that is incorporated into interest rates, not actual inflation, and that expected inflation has been slow to change in the face of the inflation surprises of the last two years. In the graph below, I present one measure of expected inflation, obtained by taking the difference between the ten-year T.Bond rate and ten-year TIPs (inflation-protected treasury rate):

Download data

This "market-imputed" inflation rate has leveled out between 2-2.5% in 2022, higher than the 1- 1.5% imputed inflation of the prior decade. 

If you still insist claiming that the Fed sets interest rates, it is time to face up to reality. There is no "interest rate room" in the Fed, where the Fed chair or FOMC committee, move the levers to set treasury or mortgage rates. The only rate that the Fed does set is the Fed Funds rate, and it is true that you have seen that rate jump from close to zero to just above 4% in 2022. Before you feel the urge to say "I told you so", take a look at US treasury rates (3-month and 10-year) on this graph, in relation to the Fed Funds rate, and make your own judgment on whether the rates climb after the Fed hikes the Fed Funds rate (which would you be your working hypothesis if the Fed sets rates) or if the Fed hikes rates in response to market rates going up:

Download data

You may come to a different conclusion that I do, but to me, it seems clear that the Fed (and other central banks) are following the market, not leading it, and that inflation is driving both. Just as a thought experiment, consider a world where there was no central bank or Fed, and ask yourself what would have happened to treasury bond rates in 2022, with the inflation news that was hitting markets. I will wager that you would have seen rates go up, with or without the Fed.
    I do think that the Fed and other Central Banks, in the aftermath of the 2008 crisis, overcorrected and misread their mission as keeping economies afloat and financial markets booming, and in the process, they gave risk capital a false sense that it could take huge risks, without demanding sufficient premiums, and come in for soft landings. Much as we bemoan our portfolio performance during 2022, the market developments of the year are, on balance, healthy insofar as they bring risk capital back to earth. That said, I think that the fixation with the Fed is both unhealthy and counter productive. It has not only made investors passive bystanders in the great interest rate resetting, but has also given poorly performing active investors, individual and institutional, an easy excuse for their underperformance.

Corporate Bonds: Risk Plus!

As treasury bonds went on their roller coaster ride in 2022, corporate bonds could not escape the excitement, first because the rising rates on treasuries transmitted into rising corporate bond rates, and second, because default spreads, i.e., the added premium added to treasury rates when lending to riskier entities also exploded during the year.

Default Risk and Spreads

    There is default risk, when companies borrow either from banks or by issuing bonds, and lenders try, sometimes well and sometimes badly, to incorporate that default risk when setting interest rates on bonds. Thus, at least in the corporate bond market, the default spread(s) become the market price of risk or risk premium for debt markets. To set the stage for what 2022 delivered in this market, it is worth noting that default spreads have been low for much of the last decade, and after a brief bout of fear in the first half of 2020, when COVID hit, approached historical lows in 2021. In short, lenders (banks and bond investors) seemed to have decided that the risk of corporate defaults had dropped and priced bonds accordingly. In 2022, that perception changed and corporate default spreads moved up during of the year:

Download data

Note again that the increase in spreads diverged across the ratings classes, in 2022, nudging up only a little across the highest ratings classes (AAA, AA), but jumping dramatically in the lower ratings (BB and below). While we have seen other years, such as 2008, where default spreads have spiked, the effect on corporate bond rates in 2022 was exaggerated  by the increase in treasury rates that we pointed to in the last section. Thus, a company with an investment-grade rating (say BBB), that issued ten-year bonds would have seen the interest rate on these bonds spike from 2.71% at the start of 2022 to 5.60% at the start of 2023.


    As with treasury rates, the best way to see how increasing rates affect investors is to estimate the return that investors in corporate bonds would have made, as corporate bonds rates doubled or more, during the year:

For simplicity, I have assumed annual rather than semi-annual coupons and for consistency, I have kept the maturity of the bond constant at ten years rather than drop it to nine years, after a year.

The return on a ten-year, Baa corporate bond in 2022, with the price change included would have been -23.99% in nominal terms and -31.12% in real terms, making it the worst year in at least my version of recorded history (1928- 2022) for the corporate bond market. The carnage clearly gets worse as you move to high yield bonds, where rising rates pushed down the prices of some of these bonds by 50% or more. Note that all of these calculations keep the bond rating for the company intact, as you move through 2022, but higher inflation and concerns about the economy caused some companies to be downgraded, exacerbating the damage.

Consequences for Companies

In my second post, from a little more a week ago, on my data updates for 2023, I noted that rising riskfree rates and equity risk premiums have pushed up the costs of equity for companies significantly in 2022. As the discussion in the last section should make clear, those rising rates were not restricted to equity, but also to debt, as companies ended 2023 with significantly higher costs of debt than at the start of the year. Bringing in the changes in both components, debt and equity, into the assessment, we computed the costs of capital for US and global companies in US dollar terms, in the graph below:


Just as a comparison, take a look at the equivalent table from the start of 2022:


The cost of capital for a median US (global) company rose from 5.77% (6.33%) at the start of 2022 to 9.63% (10.60%) at the start of 2023. To understand the implications of a rising cost of capital, it is worth remembering that the cost of capital is the Swiss Army knife of corporate finance, affecting almost every decision within a business, and in the graph below, I look at the implications:

Higher costs of capital, in addition to making it more difficult for companies to find new investments (projects, acquisitions), also have unpredictable effects on the mix of debt and equity used in funding (with the effect depending on whether the equity risk premiums rise more or less than default spreads) and increase the propensity of companies to return cash.

Interest Rates in 2023: Playing Prognosticator

    Now that 2022 is behind us, the question that you undoubtedly have is where rates are going in 2023, and as with equity returns, I will argue that it rests almost entirely on how inflation evolves over the course of the year. If inflation stays stubbornly high, rates will stay high as well, and inflation drops precipitously, expect rates to follow them down. On the corporate bond front, the real economy will come into play. If the economy weakens, and that weakness plays out as lower earnings, there will be defaults, as companies that borrowed to the hilt, when rates were low, will now find themselves facing higher interest payments on that debt, that they may not be able to make. That will keep default spreads high, and keep corporate bond rates at their elevated levels. If the economy manages to dodge a recession, there is a strong chance that default spreads will start to drift down, especially in the low-inflation scenario,

    Borrowing on the inflation/economy matrix that I used in my post on equities, here is how I see the combination of inflation and the real economy playing out in interest rates. 
The Fed will spend the entire year chasing market interest rates, and market experts will spend their time watching the Federal Open Market Committee, and telling the rest of us that it is the Fed that is in charge of where rates go next. As in my assessment of equities, I believe that the Fed will add more smoke than fire to this mix, and my advice to you would be to sleep through every FOMC meeting this year and focus instead on the numbers on inflation and the real economy. 

YouTube Video


Datasets