My not-so-profound thoughts about valuation, corporate finance and the news of the day!
Monday, January 30, 2023
Data Update 3 for 2023: Inflation and Interest Rates
If 2022 was an unsettling year for equities, as I noted in my second data post, it was an even more tumultuous year for the bond market. The US treasury market, considered by some still as a safe haven, was anything but safe or a haven, especially at the long maturities, as long term rates soared, with inflation (not the Fed) being the key driver. As a result, treasury bond investors faced one of their worst years in history, losing close to a fifth of their principal, as bonds were repriced. The rise in rates transmitted to corporate bond market rates, with a concurrent rise in default spreads exacerbating the damage to investors. Just as rising equity risk premiums push up the cost of equity, rising default spreads push up the cost of debt of companies, with the added complication of higher default risk for those companies that had pushed to the limits of their borrowing capacity in a low interest-rate environment.
US Treasuries: Risk and Time Horizon
In classrooms and in wealth managers’ offices, it has been standard practice to push US treasuries and highly rated corporate bonds as safe, and even with price changes factored in, as a portfolio stabilizer, with a mix of stocks and bonds forming a “balanced” portfolio. That is good advice in most years, but 2022 was not one of those years.
US Treasury Rates and Returns in 2022
To say that 2022 was an eventful year for US treasuries is an understatement, as treasury rates, which started the year close to historic lows, soared during the course of the year.
US Treasury rates rose across all maturities, but more so at the short end of the term structure (3 months, 1 year and 2 year) than at the long end (10 year or 30 year). The magnitude of the rises were also of historic proportions, with long term rates more than doubling, and short term rates climbing above the 4% mark. As a result of these rate changes, the term structure which started the year as upward sloping, ended the year downward sloping, giving rise to the usual talk of an imminent recession. As I have argued in prior posts, I believe too much is made of this indicator, but that is a subject for a different time.
Returns in 2022
In my first classes in finance, as a student, I was taught that the US treasury rate was a risk free rate, with the logic being that since the US treasury could always print money, it would not default. Whether that is true is a debate with having, but even if you believe that there is no default risk in a US treasury, there is price risk, insofar as the price of a bond can and will move as interest changes change. In normal years, those price changes are small, and the return on a T.Bond, with coupons counted in will tend to be positive, but in years when rates move a lot, the price change effect can be considerable, with prices dropping (rising) as rates increase (decrease). Note also that the percentage price change for a given change in interest rates will be greater, for lower starting rates; an increase in the T.Bond rate from 2% to 3% will create a more negative percentage price change than an increase the T.Bond rate from 5% to 6%.
With this context, it is easy to see why US treasury bonds were hit by the perfect storm in 2022, starting the year at a historically low level (1.51%) and going up by a historically high amount (up from 1.51% to 3.88%, an increase of 2.37%). The resulting price change and total return are shown below:
For simplicity, I have assumed annual rather than semi-annual coupons and for consistency, I have kept the maturity of the bond constant at ten years rather than drop it to nine years, after a year.
The total return on a ten-year T.Bond in 2022 was -17.83%, putting it almost on par with the negative returns on stocks in 2022 (-18.01%). Since inflation was 6.42% in 2022, the real return on a US 10-year treasury bond was -22.79%.
Historical Context
In my earlier post, I noted that US equity market performance in 2022 made it the seventh worst year in stock market history, if you go back to 1928. The T.bond market performance put equities to shame, as it delivered the worst annual returns, in both nominal and real terms, in the 1928-2022 time period:
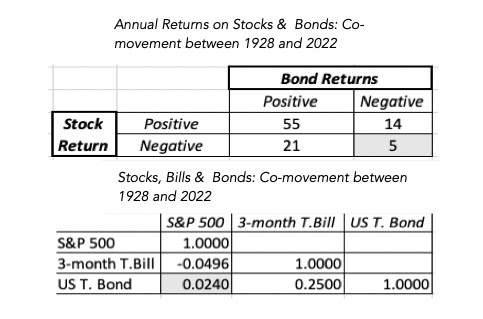
There were other measures on which the market set historical records, especially if you consider the co-performance of equity and bond markets. By themselves, stocks have had 26 negative return years in the last 95 years and, by themselves, bonds have had 19 negative returns over that period. That said, it is seldom that they have both delivered negative returns in the same year, as can be seen in the table below:
Over the 95-year period, there have been only five years where stocks and bonds have delivered negative returns in the same year, and of those five years, there has bee only one year where there were negative returns exceeding -10% in both markets, and that was 2022.
Investing is full of rules of thumb, and one of those rules that wealth managers have faithfully transmitted to their clients is the notion of a 60:40 mix in asset allocation, with 60% in stocks and 40% in bonds, backed up by the logic that this mix would deliver a more stable measure of returns over time. I will not take issue with that advice, though I find it far too rigid to work for all investor groupings, but in 2022, a 60:40 portfolio would have done little to insulate investors against risk, since stocks and bonds both delivered roughly the same returns (about -18%).
The Drivers of Interest Rates
It the question is why interest rates rose a lot in 2022, and if your answer to that question is the Fed, you have, in my view, lost the script. I know that in the last decade, it has become fashionable to attribute powers to the Fed that it does not have and view it as the ultimate arbiter of rates. That view has never made sense, because central banking power over rates is at the margin, and the key fundamental drivers of rates are expected inflation and real growth.
To immunize yourself against the Fed story, start with his graph, where I look at T.Bond rates over time, and compare them to what I term an intrinsic risk free rate, a simplistic measure obtained by adding the actual inflation rate each year to real GDP growth that year, in the US:
The mythology that it was that the Fed that kept rates low in the last decade (2011-2020) with quantitative easing and other rate gymnastics is quickly dispelled by this graph. It was the combination of low inflation and anemic growth that was at the heart of low rates, though the Fed did influence rates at the margin, perhaps pushing them down below their intrinsic levels with its machinations. As inflation has surged in the last two years, treasury bond rates have climbed, albeit at a much slower pace than inflation. That can be explained by the simple truth that it is expected inflation that is incorporated into interest rates, not actual inflation, and that expected inflation has been slow to change in the face of the inflation surprises of the last two years. In the graph below, I present one measure of expected inflation, obtained by taking the difference between the ten-year T.Bond rate and ten-year TIPs (inflation-protected treasury rate):
This "market-imputed" inflation rate has leveled out between 2-2.5% in 2022, higher than the 1- 1.5% imputed inflation of the prior decade.
If you still insist claiming that the Fed sets interest rates, it is time to face up to reality. There is no "interest rate room" in the Fed, where the Fed chair or FOMC committee, move the levers to set treasury or mortgage rates. The only rate that the Fed does set is the Fed Funds rate, and it is true that you have seen that rate jump from close to zero to just above 4% in 2022. Before you feel the urge to say "I told you so", take a look at US treasury rates (3-month and 10-year) on this graph, in relation to the Fed Funds rate, and make your own judgment on whether the rates climb after the Fed hikes the Fed Funds rate (which would you be your working hypothesis if the Fed sets rates) or if the Fed hikes rates in response to market rates going up:
You may come to a different conclusion that I do, but to me, it seems clear that the Fed (and other central banks) are following the market, not leading it, and that inflation is driving both. Just as a thought experiment, consider a world where there was no central bank or Fed, and ask yourself what would have happened to treasury bond rates in 2022, with the inflation news that was hitting markets. I will wager that you would have seen rates go up, with or without the Fed.
I do think that the Fed and other Central Banks, in the aftermath of the 2008 crisis, overcorrected and misread their mission as keeping economies afloat and financial markets booming, and in the process, they gave risk capital a false sense that it could take huge risks, without demanding sufficient premiums, and come in for soft landings. Much as we bemoan our portfolio performance during 2022, the market developments of the year are, on balance, healthy insofar as they bring risk capital back to earth. That said, I think that the fixation with the Fed is both unhealthy and counter productive. It has not only made investors passive bystanders in the great interest rate resetting, but has also given poorly performing active investors, individual and institutional, an easy excuse for their underperformance.
Corporate Bonds: Risk Plus!
As treasury bonds went on their roller coaster ride in 2022, corporate bonds could not escape the excitement, first because the rising rates on treasuries transmitted into rising corporate bond rates, and second, because default spreads, i.e., the added premium added to treasury rates when lending to riskier entities also exploded during the year.
Default Risk and Spreads
There is default risk, when companies borrow either from banks or by issuing bonds, and lenders try, sometimes well and sometimes badly, to incorporate that default risk when setting interest rates on bonds. Thus, at least in the corporate bond market, the default spread(s) become the market price of risk or risk premium for debt markets. To set the stage for what 2022 delivered in this market, it is worth noting that default spreads have been low for much of the last decade, and after a brief bout of fear in the first half of 2020, when COVID hit, approached historical lows in 2021. In short, lenders (banks and bond investors) seemed to have decided that the risk of corporate defaults had dropped and priced bonds accordingly. In 2022, that perception changed and corporate default spreads moved up during of the year:
Note again that the increase in spreads diverged across the ratings classes, in 2022, nudging up only a little across the highest ratings classes (AAA, AA), but jumping dramatically in the lower ratings (BB and below). While we have seen other years, such as 2008, where default spreads have spiked, the effect on corporate bond rates in 2022 was exaggerated by the increase in treasury rates that we pointed to in the last section. Thus, a company with an investment-grade rating (say BBB), that issued ten-year bonds would have seen the interest rate on these bonds spike from 2.71% at the start of 2022 to 5.60% at the start of 2023.
As with treasury rates, the best way to see how increasing rates affect investors is to estimate the return that investors in corporate bonds would have made, as corporate bonds rates doubled or more, during the year:
For simplicity, I have assumed annual rather than semi-annual coupons and for consistency, I have kept the maturity of the bond constant at ten years rather than drop it to nine years, after a year.
The return on a ten-year, Baa corporate bond in 2022, with the price change included would have been -23.99% in nominal terms and -31.12% in real terms, making it the worst year in at least my version of recorded history (1928- 2022) for the corporate bond market. The carnage clearly gets worse as you move to high yield bonds, where rising rates pushed down the prices of some of these bonds by 50% or more. Note that all of these calculations keep the bond rating for the company intact, as you move through 2022, but higher inflation and concerns about the economy caused some companies to be downgraded, exacerbating the damage.
Consequences for Companies
In my second post, from a little more a week ago, on my data updates for 2023, I noted that rising riskfree rates and equity risk premiums have pushed up the costs of equity for companies significantly in 2022. As the discussion in the last section should make clear, those rising rates were not restricted to equity, but also to debt, as companies ended 2023 with significantly higher costs of debt than at the start of the year. Bringing in the changes in both components, debt and equity, into the assessment, we computed the costs of capital for US and global companies in US dollar terms, in the graph below:
Just as a comparison, take a look at the equivalent table from the start of 2022:
The cost of capital for a median US (global) company rose from 5.77% (6.33%) at the start of 2022 to 9.63% (10.60%) at the start of 2023. To understand the implications of a rising cost of capital, it is worth remembering that the cost of capital is the Swiss Army knife of corporate finance, affecting almost every decision within a business, and in the graph below, I look at the implications:
Higher costs of capital, in addition to making it more difficult for companies to find new investments (projects, acquisitions), also have unpredictable effects on the mix of debt and equity used in funding (with the effect depending on whether the equity risk premiums rise more or less than default spreads) and increase the propensity of companies to return cash.
Interest Rates in 2023: Playing Prognosticator
Now that 2022 is behind us, the question that you undoubtedly have is where rates are going in 2023, and as with equity returns, I will argue that it rests almost entirely on how inflation evolves over the course of the year. If inflation stays stubbornly high, rates will stay high as well, and inflation drops precipitously, expect rates to follow them down. On the corporate bond front, the real economy will come into play. If the economy weakens, and that weakness plays out as lower earnings, there will be defaults, as companies that borrowed to the hilt, when rates were low, will now find themselves facing higher interest payments on that debt, that they may not be able to make. That will keep default spreads high, and keep corporate bond rates at their elevated levels. If the economy manages to dodge a recession, there is a strong chance that default spreads will start to drift down, especially in the low-inflation scenario,
Borrowing on the inflation/economy matrix that I used in my post on equities, here is how I see the combination of inflation and the real economy playing out in interest rates.
The Fed will spend the entire year chasing market interest rates, and market experts will spend their time watching the Federal Open Market Committee, and telling the rest of us that it is the Fed that is in charge of where rates go next. As in my assessment of equities, I believe that the Fed will add more smoke than fire to this mix, and my advice to you would be to sleep through every FOMC meeting this year and focus instead on the numbers on inflation and the real economy.


No comments:
Post a Comment