Showing posts with label Cash. Show all posts

Friday, July 18, 2025

To Bitcoin or not to Bitcoin? A Corporate Cash Question!

    In this post, I will bring together two disparate and very different topics that I have written about in the past. The first is the role that cash holdings play in a business, an extension of the dividend policy question, with an examination of why businesses often should not pay out what they have available to shareholders. In my classes and writing on corporate finance, I look at the motives for businesses retaining cash, as well as how much cash is too much cash. The second is bitcoin, which can be viewed as either a currency or a collectible, and in a series of posts, I argued that bitcoin can only be priced, not valued, making debates about whether to buy or not to buy entirely a function of perception. In fact, I have steered away from saying much about bitcoin in recent years, though I did mention it in my post on alternative investments as a collectible (like gold) that can be added to the choice mix. While there may be little that seemingly connects the two topics (cash and bitcoin), I was drawn to write this post because of a debate that seems to be heating up on whether companies should put some or a large portion of their cash balances into bitcoin, with the success of MicroStrategy, a high-profile beneficiary of this action, driving some of this push. I believe that it is a terrible idea for most companies, and before Bitcoin believers get riled up, my reasoning has absolutely nothing to do with what I think of bitcoin as an investment and more to do with how little I trust corporate managers to time trades right. That said, I do see a small subset of companies, where the holding bitcoin strategy makes sense, as long as there are guardrails on disclosure and governance.

Cash in a Going Concern

    In a world where businesses can raise capital (equity or debt) at fair prices and in a timely manner, there is little need to hold cash, but that is not the world we live in. For a variety of reasons, some internal and some external, companies are often unable or unwilling to raise capital from markets, and with that constraint in place, it is logical to hold cash to meet unforeseen needs. In this section, I will start by laying out the role that cash holdings play in any business, and examine how much cash is held by companies, broken down by groupings (regional, size, industry). 

A Financial Balance Sheet

    To understand the place of cash in a business, I will start with a  financial balance sheet, a structure for breaking down a business, public or private:

On the asset side of the balance sheet, you start with the operating business or businesses that a company is in, with a bifurcation of value into value from investments already made (assets-in-place) and value from investments that the company expects to make in the future (growth assets). The second asset grouping, non-operating assets, includes a range of investments that a company may make, sometimes to augment its core businesses (strategic investments), and sometimes as side investments, and thus include minority holdings in other companies (cross holdings) and even investments in financial assets. Sometimes, as is the case with family group companies, these cross holdings may be a reflection of the company's history as part of the group, with investments in other group companies for either capital or corporate control reasons. The third grouping is for cash and marketable securities, and this is meant specifically for investments that share two common characteristics - they are riskless or close to riskless insofar as holding their value over time and they are liquid in the sense that they can be converted to cash quickly and with no penalty. For most companies, this has meant investing cash in short-term bonds or bills, issued by either governments (assuming that they have little default risk) or by large, safe companies (in the form of commercial paper issued by highly rated firms). 

    Note that there are two sources of capital for any business, debt or equity, and in assessing how levered a firm is, investors look at the proportion of the capital that comes from each:

  • Debt to Equity = Debt/ Equity
  • Debt to Capital = Debt/ (Debt + Equity)

In fact, there are many analysts and investors who estimate these debt ratios, using net debt, where they net the cash holdings of a company against the debt, with the rationale, merited or not, that cash can be used to pay down debt.

  • Net Debt to Equity = (Debt-Cash)/ Equity
  • Debt to Capital = (Debt-Cash)/ (Debt + Equity)
All of these ratios can be computed using accounting book value numbers for debt and equity or with market value numbers for both. 

The Motives for holding Cash

    In my introductory finance classes, there was little discussion of cash holdings in companies, outside of the sessions on working capital. In those sessions, cash was introduced as a lubricant for businesses, necessary for day-to-day operations. Thus, a retail store that had scores of cash customers, it was argued, needed to hold more cash, often in the form of currency, to meet its transactional needs, than a company with corporate suppliers and business customers, with predictable patterns in operations. In fact, there were rules of thumb that were developed on how much cash a company needed to have for its operations. As the world shifts away from cash to digital and online payments, this need for cash has decreased, but clearly not disappeared. The one carve out is the financial services sector, where the nature of the business (banking, trading, brokerage) requires companies in the sector to hold cash and marketable securities as part of their operating businesses.

    If the only reason for holding cash was to cover operating needs, there would be no way to justify the tens of billions of dollars that many companies hold; Apple alone has often had cash balances that exceeded $200 billion, and the other tech giants are not far behind. For some companies, at least, the rationale for holding far more cash than justified by their operating needs is that it can operate as a shock absorber, something that they can fall back on during periods of crisis or to cover unexpected expenses. That is the reason that cyclical and commodity firms have often offered for holding large cash balances (as a percent of their overall firm value), since a recession or a commodity price downturn can quickly turn profits to losses.

   Using the corporate life cycle structure can also provide insight into how the motives for holding cash can change as a company ages.  

For start-ups, that are either pre-revenue or have very low revenues, cash is needed to keep the business operating, since employees have to be paid and expenses covered. Young firms that are money-losing and with large negative cash flows, hold cash to cover future cash flow needs and to fend off the risk of failure. In effect, these firms are using cash as life preservers, where they can make it through periods where external capital (venture capital, in particular) dries up, without having to sell their growth potential at bargain basement prices. As firms start to make money, and enter high growth, cash has use as a business scalar, for firms that want to scale up quickly. In mature growth, cash acquires optionality, useful in allowing the business to find new markets for its products or product extensions.  Mature firms sometimes hold cash as youth serum, hoping that  it can be used to make once-in-a-lifetime investments that may take them back to their growth days, and for declining firms, cash becomes a liquidation manager, allowing for the orderly repayment of debt and sale of assets.

    There is a final rationale for holding cash that is rooted in corporate governance and the control and power that comes from holding cash. I have long argued that absent pressure from shareholders, managers at most publicly traded firms would choose to return very little of the cash that they generate, since that cash balance not only makes them more sought after (by bankers and consultants who are endlessly inventive about uses that the cash can be put to) but also gives them the power to build corporate empires and create personal legacies.

Corporate Cash Holdings

    Given the multitude of reasons for holding cash, it should come as no surprise that publicly traded companies around the world have significant cash balances. Leading into July 2025, for instance, global non-financial-service firms held almost $11.4 trillion in cash and marketable securities; financial service firms held even more in cash and marketable securities, but those holdings, as we noted earlier, can represent their business needs. Using our earlier breakdown of the asset side of the balance sheet into cash, non-operating and operating assets, this is what non-financial service firms in the aggregate looked like in book value terms (global and just US firms):


Note that cash is about 11% of the book value of total assets, in the aggregate, for global firms, and about 9% of the book value of total assets, for US firms. Global firms do hold a higher percentage of their value in non-operating assets, but US firms are more active on the acquisition front, explaining why goodwill (which is triggered almost entirely by acquisitions) is greater at US firms.

    The typical publicly traded firm holds a large cash balance, but there are significant differences in cash holdings, by sector. In the table below, I look at cash as a percent of total assets, a book value measure, as well as cash as a percent of firm value, computed by aggregating market values:


As you can see, technology firms, which presumably face more uncertainty about their future hold far more cash as a percent of book value, but the value that the market attaches to their growth brings down cash as a percent of firm value. Utilities, regulated and often stable businesses, tend to hold the least cash, 
both in book and market terms. 

    Breaking down the sample by region, I look at cash holdings, as a percent of total assets and firms, across the globe:


The differences across the globe can be explained by a mix of market access, with countries in parts of the world where it can be difficult to access capital (Latin America, Eastern Europe, Africa) holding more cash. In addition, and corporate governance, with cash holdings being greater in parts of the world (China, Russia) where shareholders have less power over managers. 

    Given the earlier discussion of how the motives for holding cash can vary across the life cycle, I broke the sample down by age decile, with age measured from the year of founding, and looked at cash holdings, by decile:


The results are mixed, with cash holdings as a percent of total assets being higher for the younger half of the sample (the top five deciles) than for the older half, but the is no discernible pattern, when cash is measured as a percent of firm value (market). Put simple, companies across the life cycle hold cash, though with different motives, with the youngest firms holding on to cash as lifesavers (and for survival) and the older firms keeping cash in the hopes that they can use it to rediscover their youth.

The Magic of Bitcoin

    I have been teaching and working with investments now for four decades, and there has been no investment that has received as much attention from both investors and the financial press, relative to its actual value, as has bitcoin. Some of the draw has come from its connections to the digital age, but much of it has come from its rapid rise in price that has made many rich, with intermittent collapses that have made just as many poor. I am a novice when it comes to crypto, and while I have been open about the fact that it is not my investment preference, I understand its draw, especially for younger investors.

The Short, Eventful History of Bitcoin

    The origin story for Bitcoin matters since it helps us understand both its appeal and its structure. It was born in November 2008, two months into one of the worst financial crises of the last century, with banks and governments viewed as largely responsible for the mess. Not surprisingly, Bitcoin was built on the presumption that you cannot trust these institutions, and its biggest innovation was the blockchain, designed as a way of crowd-checking transactions and preserving transaction integrity. I have long described Bitcoin as a currency designed by the paranoid for the paranoid, and I have never meant that as a critique, since in the  untrustworthy world that we live in, paranoia is a justifiable posture.

    From its humble beginnings, where only a few (mostly tech geeks) were aware of its existence, Bitcoin has accumulated evangelists, who argue that it is the currency of the future, and speculators who have used its wild price swings to make and lose tens of millions of dollars. In the chart below, I look at the price of bitcoin over the last decade, as its price has increased from less than $400 in September 2014 to more than $110,000 in June 2025:

Along the way, Bitcoin has also found some acceptance as a currency, first for illegal activities (drugs on the Silk Road) and then as the currency for countries with failed fiat currencies (like El Salvador), but even Bitcoin advocates will agree that its use in transactions (as the medium of exchange) has not kept pace with its growth as a speculative trade. 

Pricing Bitcoin

    In a post in 2017,  I divided investments into four groups - assets that generate cash flows (stocks, bonds, private businesses), commodities that can be used to produce other goods  (oil, iron ore etc), currencies that act as mediums of exchange and stores of value and collectibles that are priced based on demand and supply:


You may disagree with my categorization, and there are shades of gray, where an investment can be in more than one grouping. Gold, for instance, is both a collectible of long standing and a commodity that has specific uses, but the former dominates the latter, when it comes to pricing. In the same vein, crypto has a diverse array of players, with a few meeting the asset test and some (like ethereum) having commodity features. The contrast between the different investment classes also allows for a contrast between investing, where you buy (sell) an investment if it is under (over) valued, and trading, where you buy (sell) an investment if you expect its price to go up (down). The former is a choice, though not a requirement, with an asset (stocks, bonds or private businesses), though there may be others who still trade that asset. With currencies and collectibles, you can only trade, making judgments on price direction, which, in turn, requires assessments of mood and momentum, rather than fundamentals. 
    With bitcoin, this classification allows us to cut through the many distractions that pop up during discussions of its pricing level, since it can be framed either as a currency or a collectible, and thus only priced, not valued. Seventeen years into its existence, Bitcoin has struggled on the currency front, and while there are pockets where it has gained acceptance, its design makes it inefficient and its volatility has impeded its adoption as a medium of exchange. As a collectible, Bitcoin starts with the advantage of scarcity, restricted as it is to 21 million units, but it has not quite measured up, at least so far, when it comes to holding its value (or increasing it) when financial assets are in meltdown mode. In every crisis since 2008, Bitcoin has behaved more like risky stock, falling far more than the average stock, when stocks are down, and rising more, when they recover. I noted this in my posts looking at the performance of investments in both the first quarter of 2020, when COVID laid waste to markets, and in 2022, when inflation ravaged stock and bond markets. That said, it is still early in its life, and it is entirely possible that it may change its behavior as it matures and draws in a wider investor base. The bottom line is that discussions of whether Bitcoin is cheap or expensive are often pointless and sometimes frustrating, since it depends almost entirely on your perspective on how the demand for Bitcoin will shift over time. If you believe that its appeal will fade, and that it will be displaced by other collectibles, perhaps even in the crypto space, you will be in the short selling camp. If you are convinced that its appeal will not just endure but also reach fresh segments of the market, you are on solid ground in assuming that its price will continue to rise. It behooves both groups to admit that neither has a monopoly on the truth, and this is a disagreement about trading and not an argument about fundamentals.

The MicroStrategy Story

    It is undeniable that one company, MicroStrategy, has done more to advance the corporate holding of Bitcoin than any other, and that has come from four factors;

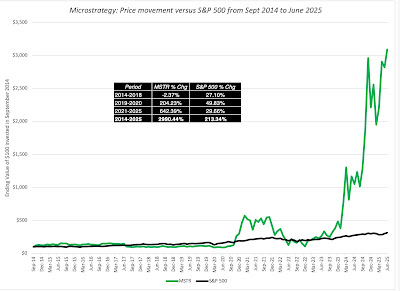
  1. A stock market winner: The company's stock price has surged over the last decade, making it one of the best performing stocks on the US exchanges:
     It is worth noting that almost all of the outperformance has occurred in this decade, with the winnings concentrated into the last two years. 
  2. With the rise (increasingly) tied to Bitcoin: Almost all of MicroStrategy’s outperformance has come from its holdings of bitcoin, and not come from improvements in business operations. That comes through in the graph below, where I look at the prices of MicroStrategy and Bitcoin since 2014:

     
     Note that MicroStrategy’s stock price has gone from being slightly negatively correlated with Bitcoin’s price between 2014-2018 to tracking Bitcoin in more recent years.
  3. And disconnected from operationsIn 2014, MicroStrategy was viewed and priced as a software/services tech company, albeit a small one with promise. In the last decade, its operating numbers have stagnated, with both revenues and gross profits declining, but during the same period, its enterprise value has soared from $1 billion in 2014 to more than more than $100 billion in July 2025:

    It is clear now that anyone investing in MicroStrategy at its current market cap (>$100 billion) is making a bitcoin play.
  4. With a high-profile "bitcoin evangelist" as CEO:  MicroStrategy’s CEO, Michael Saylor, has been a vocal and highly visible promoter of bitcoin, and has converted many of his shareholders into fellow-evangelists and convinced at least some of them that he is prescient in detecting price movements. In recent years, he has been public in his plans to issue increasing amounts of stock and using the proceeds to buy more bitcoin.
In sum, MicroStrategy is now less a software company and more a Bitcoin SPAC or closed-end fund, where investors are trusting Saylor to make the right trading judgments on when to buy (and sell) bitcoin, and hoping to benefit from the profits. 

The “Put your cash in bitcoin” movement

     For investors in other publicly traded companies that have struggled delivering value in their operating businesses, MicroStrategy’s success with its bitcoin holdings seems to indicate a lost opportunity, and one that can be remedied by jumping on the bandwagon now. In recent months, even high profile companies, like Microsoft, have seen shareholder proposals pushing them to abandon their conventional practice of holding cash in liquid and close-to-riskless investments and buying Bitcoin instead. Microsoft’s shareholders soundly rejected the proposal, and I will start by arguing that they were right, and that for most companies, investing cash in bitcoin does not make sense, but in the second part, I will carve out the exceptions to this rule.

The General Principle: No to Bitcoin

    As a general rule, I think it is not only a bad idea for most companies to invest their cash in bitcoin, but I would go further and also argue that they should banned from doing so. Let me hasten to add that I would make this assertion even if I was bullish on Bitcoin, and my argument would apply just as strongly to companies considering moving their cash into gold, Picassos or sports franchises, for five reasons:

  1. Bitcoin does not meet the cash motives: Earlier in this post, I noted the reasons why a company  holds cash, and, in particular, as a shock absorber, steadying a firm through bad times. Replacing low-volatility cash with high-volatility bitcoin would undercut this objective, analogous to replacing your shock absorbers with pogo sticks. In fact, given the history of moving with stock prices, the value of bitcoin on a company's balance sheet will dip at exactly the times where you would need it most for stability. The argument that bitcoin would have made a lot higher returns for companies than holding cash is a non-starter, since companies should hold cash for safety.
  2. Bitcoin can step on your operating business narrative: I have long argued that successful businesses are built around narratives that incorporate their competitive advantages. When companies that are in good businesses put their cash in bitcoin, they risk muddying the waters on two fronts. First, it creates confusion about why a company with a solid business narrative from which it can derive value would seek to make money on a side game. Second, the ebbs and flows of bitcoin can affect financial statements, making it more difficult to connect operating results to story lines. 
  3. Managers as traders? When companies are given the license to move their cash into bitcoin or other non-operating investments, you are trusting managers to get the timing right, in terms of when to buy and sell these investments. That trust is misplaced, since top managers (CEOs and CFOs) are for the most part terrible traders, often buying at the market highs and selling at lows.
  4. Leave it to shareholders: Even if you are unconvinced by the first three reasons, and you are a bitcoin advocate or enthusiast, you will be better served pushing companies that you are a shareholder in, to return their cash to you, to invest in bitcoin, gold or any other investment at your chosen time. Put simply, if you believe that Bitcoin is the place to put your money, why would you trust corporate managers to do it for you?
  5. License for abuse: I am a skeptic when it comes to corporate governance, believing that managerial interests are often at odds with what's good for shareholders. Giving managers the permission to trade crypto tokens, bitcoin or other collectibles can open the door for self dealing and worse. 
While I am a fan of letting shareholders determine the limits on what managers can or cannot do, I believe that the SEC (and other stock market regulators around the world) may need to become more explicit in their rules on what companies can (and cannot) do with cash.

The Carveouts

    I do believe that there are cases when you, as a shareholder, may be at peace with the company not only investing cash in bitcoin, but doing so actively and aggressively. Here are four of my carveouts to the general rule on bitcoin:

  1. The Bitcoin Savant: In my earlier description of MicroStrategy, I argued that shareholders in MicroStrategy have not only gained immensely from its bitcoin holdings, but also trust Michael Saylor to trade bitcoin for them. In short, the perception, rightly or wrongly, is that Saylor is a bitcoin savant, understanding the mood and momentum swings better than the rest of us. Generalizing, if a company has a leader (usually a CEO or CFO) who is viewed as someone who is good at gauging bitcoin price direction, it is possible that shareholders in the company may be willing to grant him or her the license to trade bitcoin on their behalf.  This is, of course, not unique to bitcoin, and you can argue that investors in Berkshire Hathaway have paid a premium for its stock, and allowed it leeway to hold and deploy immense amounts of cash because they trusted Warren Buffett to make the right investment judgments. 
  2. The Bitcoin Business: For some companies, holding bitcoin may be part and parcel of their business operations, less a substitute for cash and more akin to inventory. PayPal and Coinbase, both of which hold large amounts of bitcoin, would fall into this carveout, since both companies have business that requires that holding.
  3. The Bitcoin Escape Artist: As some of you may be aware, I noted that Mercado Libre, a Latin American online retail firm, is on my buy list, and it is a company with a fairly substantial bitcoin holding. While part of that holding may relate to the operating needs of their fintech business, it is worth noting that Mercado Libre is an Argentine company, and the Argentine peso has been a perilous currency to hold on to, making bitcoin a viable option for cash holdings. Generalizing, companies in countries with failed currencies may conclude that holding their cash in bitcoin is less risky than holding it in the fiat currencies of the locations they operate in.
  4. The Bitcoin Meme: There is a final grouping of companies that I would put in the meme stock category, with AMC and Gamestop heading that list. These companies have operating business models that have broken down or have declining value, but they have become, by design or through accident, trading plays, where the price bears no resemblance to operating fundamentals and is instead driven by mood and momentum. If that is the case, it may make sense for these companies to throw in the towel on operating businesses entirely and instead make themselves even more into trading vehicles by moving into bitcoin, with the increased volatility adding to their "meme" allure.

Even with these exceptions, though, I think that you need guardrails before signing off on opening the door to letting companies hold bitcoin.

  1. Shareholder buy-in: If you are a publicly traded company considering investing some or much of the company's cash in bitcoin, it behooves you to get shareholder approval for that move, since it is shareholder cash that is being deployed. 
  2. Transparency about Bitcoin transactions/holdings: Once a company invests in bitcoin, it is imperative that there be full and clear disclosure not only on those holdings but also on trading (buying and selling) that occurs. After all, if it is a company's claim that it can time its bitcoin trades better than the average investor, it should reveal the prices at which it bought and sold its bitcoin. 
  3. Clear mark-to-market rules: If a company invests its cash in bitcoin, I will assume that the value of that bitcoin will be volatile, and accounting rules have to clearly specify how that bitcoin gets marked to market, and where the profits and losses from that marking to market will show up in the financial statements. 
As bitcoin prices rise to all time highs, there is the danger that regulators and rule-writers will be lax in their rule-writing, opening the door to corporate scandals in the future.

Cui Bono?

    Bitcoin advocates have been aggressively pushing both institutional investors and companies to include Bitcoin in their investment choices, and it is true that at least first sight, they will benefit from that inclusion. Expanding the demand for bitcoin, an investment with a fixed supply, will drive the price upwards, and existing bitcoin holders will benefit. In fact, much of the rise of bitcoin since the Trump election in November 2024 can be attributed to the perception that this administration will ease the way for companies and investors to join in the crypto bonanza.

    For bitcoin holders, increasing institutional and corporate buy-in to bitcoin may seem like an unmixed blessing, but there will be costs that, in the long run, may lead at least some of them to regret this push:

  1. Different investor base: Drawing in institutional investors and companies into the bitcoin market will not only change its characteristics, but put traders who may know how to play the market now at a disadvantage, as it shifts dynamics.
  2. Here today, gone tomorrow? Bitcoin may be in vogue now, but what will the consequences be if it halves in price over the next six months? Institutions and companies are notoriously ”sheep like” in their behavior, and what is in vogue today may be abandoned tomorrow. If you believe that bitcoin is volatile now, adding these investors to the mix will put that volatility on steroids.
  3. Change asset characteristics: Every investment class that has been securitized and brought into institutional investing has started behaving like a financial asset, moving more with stocks and bonds than it has historically. This happened with real estate in the 1980s and 1990s, with mortgage backed securities and other tradable versions of real estate, making it far more correlated with stock and bonds, and less of a stand alone asset. 
If the end game for bitcoin is to make it millennial gold, an alternative or worthy add-on to financial assets, the better course would be steer away from establishment buy-in and build it up with an alternative investor base, driven by different forces and motives than stock and bond markets. 

YouTube Video

Wednesday, June 3, 2015

Cash, Debt and PE Ratios: Cash is an upper and debt is a downer!

In my last post, I looked at the leavening effect that large cash balances have on PE ratios, especially in a low-interest rate environment. In making that assessment, I used a company with no debt to isolate the effect of cash, but many of the comments on that post raised interesting points/questions about debt. The first point is that while cash acts as an upper for PE, debt can act as a downer, with increases in debt reducing the PE ratio, and that if we are going to control for cash differences in the market across time, we should also be looking at debt variations over the years. The second is the question of which effect on PE dominates for firms that borrow money, with the intent of holding on to the cash. In this post, I will start by looking at debt in isolation but then move to consider the cross effects of cash and debt on PE.

Debt and PE: A simple illustration
To examine the relationship between PE and debt, I went back to the hypothetical software firm that I used to evaluate the effect of cash on PE. Initially, I assume that the firm has no cash and no debt and is expected to generate $120 million in pre-tax operating income next year, expected to grow at 2% a year in perpetuity. Assuming that the cost of equity (and capital) for this firm is 10%, that the tax rate is 40% and that its return on equity (and capital) on new investments is 36%, the company's income statement and intrinsic value balance sheet are as follows:

Now, assume that this firm chooses to move to a 40% debt ratio with a pre-tax cost of borrowing of 4%. The effects of the debt on the are traced through in the picture below:

Note that the value of the business has increased from $850 million to $988.37 million, with the bulk of the value increase coming from the tax subsidies generated by debt

The effects of borrowing show up everywhere, with almost almost every number shifting, and the effects at first sight seem to be contradictory. Higher debt raises the cost of equity but lowers the cost of capital, reduces net income but increases earnings per share and results in a lower PE ratio, while increasing the value per share. The intuition, though, is simple. Borrowing money to fund the business increases both the expected returns to equity investors (captured in the EPS increase) and the riskiness in those equity returns (pushing the PE ratio down) and at least at a 40% debt ratio, the benefits outweigh the costs. In fact, if you are able to continue to borrow money at 4% at higher debt ratios, the PE ratio will continue to drop and the value per share continue to increase as the debt ratio increases.


Note that at a 90% debt to capital ratio, the PE ratio drops to 2.75 but the value per share increases to $11.41. If it is sounds too good to be true, it is, because there are two forces that will start to work against debt, especially as the debt ratio increases. The first is that the rate at which you borrow will increase as you borrow more, reflecting the higher default risk in the company. The second is that at a high enough debt level, with high interest rates, the interest expenses may start to exceed your operating income, eliminating the tax benefits of debt. In the table below, I highlight the effects on PE and value per share of different borrowing rates:
Numbers in red are declines in value/share
The breakeven cost of borrowing, at least in this example, is around 8.6%; if the company borrows at a rate that exceeds 8.6%, debt reduces the value per share. The effect on PE, though, is unambiguous. As you borrow more money, the PE ratio decreases and it does so at a greater rate, if the borrowing rate is high.

Debt, Cash and PE: Bringing it all together
Now that we have opened to the door to cash and debt separately, let's bring them together into the same company. A measure that incorporates both cash and debt is the net debt, which is the difference between the cash and debt balances of the company.
Net Debt = Total Debt - Cash and Marketable Securities
This number will be negative when cash balances exceed total debt, zero, when they offset each other, and positive, when debt exceeds cash. In the table below, I have estimated the PE ratio for the company with different combinations of debt ratios (from 0% to 50%) with cash ratios (from 0% to 50%), with debt borrowed at 4% and cash invested at 2%:
Numbers in red are declines in value/share
Note that both the cash effect, which pushes up PE ratios, and the debt effect, which pushes down PE ratios, is visible in this table. Interesting, a zero net debt ratio (which occurs across the diagonal of the table) does not have a neutral effect on PE, with PE rising when both debt and cash are at higher values; thus the PE when you have no cash and no debt is 11.81, but it is 12.66 when you have 40% debt and 40% cash. Before you view this as a license to embark on a borrow-and-buy treasury bills scheme, note that the value per share effect of borrowing money and holding it as cash is negative; the value per share declines $0.22/share when you move from a net debt ratio of zero (with no debt and no cash) to a net debt ratio of zero (with 40% debt and 40% cash).  Again, there is no mystery as to why. If you borrow money at 4% and invest that money at 2%, which is effectively what you are doing when cash offsets debt, you are worse off than you would have been if you had no cash and no debt. In fact, the only scenario where the value effect of borrowing money and buying T.Bills is neutral is when you can borrow money at the risk free rate but even in that scenario, the PE ratio still increases. In short, the cash effect dominates the debt effect and you can check it out for yourself by downloading the spreadsheet that I used for my computations.

Cash and Debt Effects on PE: US Stocks from 1962 to 2014
In my last post, I noted the difficulty with dealing with cash balances at financial service firms, where the cash serves a very different purpose than it does at non-financial service firms. That statement is even more applicable when it comes to debt, since debt to a financial service firm is less a source of capital and more raw material. Hence, I will focus entirely on non-financial service firms for this section. The first set of statistics that I will estimate relate to debt and cash. In the graph below, I look at cash as a percent of firm value (estimated as market capitalization plus total debt), total debt as a percent of that same value and the net debt ratio (the difference between total debt and cash, as a percent of value) for non-financial service firms in the US from 1962 to 2014.
Raw data from Compustat: All money-making, non-financial service firms
Note the median values for cash and debt are highlighted on the graph. In 2014, the cash holdings at non-financial service companies in the US amounted to 7.30%, higher than the median value of 7.23% for that statistic from 1962 to 2014, and the total debt was 24.20% of value, lower than the median value of 28.39 for that ratio from 1962 to 2014. Since cash pushes up PE ratios and debt pushes down PE ratios, the 2014 levels for both variables are biasing PE ratios upwards, relative to history.

Unlike the cash effect, which I was able to measure with relative ease by netting cash out of the market capitalization and the income from cash from the net income, the debt effect is messier to isolate. If you assume that cash is the only non-operating asset (i.e., that companies do not have cross holdings and other non-operating investments), the debt effect can be computed approximately. First, if cash and debt is zero for a company, and there are no other non-operating assets, the net income for that company will be its after-tax operating income (EBIT (1-tax rate)). Second, the value of the company, if it it had no cash and debt, can be approximated with its enterprise value, leading to the EV/EBIT(1-t) providing an approximate measure of what the earnings multiple would have looked like with no cash and no debt. (The enterprise value does include the value effect of debt and is hence not a clean measure of what the value would have been, if the firm had no debt and no cash.)
Debt Effect = EV/ EBIT (1-t)  - Non-cash PE
To estimate these numbers for my sample, I used the average effective tax rate each to compute the after-tax operating income in that year, in recognition of the reality that US companies would not be paying the marginal tax rate on taxable income, even if they had no interest expenses. The graph below summarizes the cash and debt effects on stocks from 1962 through 2014:
Source: Compustat; All money-making, non-financial service US firms
At the end of 2014, the PE ratio was 17.73, the non-cash PE was 16.05 and the EV/EBIT(1-t) was 19.44. So, what do these numbers mean? All three measures are higher than the median values over the last 55 years, which would be ammunition you could use to argue that stocks are overvalued. However, as I noted in my post on PE ratios last year, the treasury bond rate, at 2%, is also much lower than the historic norm, and if you don't buy into the bubble story, could be used to explain the higher multiples. I don't this post is the forum for examining the heft of these arguments, but I did try to provide my views in this post last year on bubbles.

PE Ratios: Three Rules for the road
Like most investors, I like the simplicity and intuitive feel of PE ratios, but they are blunt instruments that can get us into trouble, when used casually. A low PE ratio can be indicative of cheapness, but it can also be the result of high debt ratios and low or no cash holdings. Conversely, a high PE ratio can point to over priced stocks, but it can be caused by high cash balances and low debt ratios. Based on the last two posts, I would suggest three simple rules for the use of PE ratios.
  1. When comparing PE ratios across companies, don't ignore cash holdings and debt. As the diversity of companies within sectors increases, the old notion of picking the lowest PE stock as the winner is increasingly questionable, since you may be choosing most highly levered company in the sector.  
  2. When comparing PE ratios across time, don't ignore cash holdings and debt. In these last two posts, I have noted the ebbs and flows in both cash as a percent of firm value and debt as a percent of value across time, sometimes due to shifts in the numerator (cash and debt values changing) and sometimes due to shifts in the denominator (market value of equity changing). Whatever the reasons, these shifts can affect the PE ratios for the market, making it look expensive when cash balances are high and debt ratios are low. 
  3. Any corporate action that changes the cash or debt as a percent of value will change the PE ratio. Consider a company that has a large cash balance and is planning on using that cash to buy back stock. Even if nothing else changes, the PE ratio for the company should decrease after the buyback, as (high PE) cash leaves the company. Thus, the practice of forecasting earnings per share after buybacks and multiplying those earnings per share by a constant PE will overstate value. This effect will be even more pronounced, if the company borrows some or all of the money to fund the buyback, since a higher debt ratio will also push down the PE even further.

Finally, if you are at the receiving end of an investing pitch (that a stock or market is cheap or expensive), based just on PE ratios, you should  be skeptical, no matter how credentialed the person making the pitch may be, and do your own due diligence.

Spreadsheets


Wednesday, May 27, 2015

The Value and Pricing of Cash: Why low interest rates & large cash balances skew PE ratios

For an asset that should be easy to value and analyze, cash has been in the news a lot in the last few months, both when it has been returned (in buybacks especially) and also when it has been accumulated either domestically or offshore. Since companies have always returned cash and held cash balances, you may wonder why these stories are news worthy but I think that the cash is under the spotlight because of a convergence of factors, including the rise of technology companies in the market cap ranks, a tax law in the US that is increasingly a global outlier, and low interest rates.

Accounting for, Valuing, and Pricing Cash
I start my valuation class with a simple exercise. I hold up an envelope with a $20 bill in it (which everyone in the class has seen me put into the envelope) and ask people how much they would pay for the envelope.  While some find this exercise to be absurd, it does bring home a very simple rule, which is that valuing cash should not require complicated valuation models or the use of multiples. Unfortunately, I see this rule broken on a daily basis as investors mishandle cash in companies, both in intrinsic valuation and pricing models.

To illustrate the divide between risky assets and cash, assume that you are trying to value a software company, with a cash balance (which is invested in liquid, riskless or close-to-riskless investments) of $200 million. Let's assume that the accounting income statement & balance sheet for the company looks as follows:


If you believe the accounting balance sheet, this company is half software and half cash but that is misleading for two reasons. The first is that assets on accounting balance sheets are not marked to market and can remain at low values, even as their earnings power rises. The second is that accounting rules (absurdly) treat R&D, the biggest capital expenditure at technology firms, as operating expenses, which then results in those assets never showing up on the balance sheet. The ripple effects of understating the book value of equity can be seen in the high returns on equity that I report for the firm.

Having established that book-value cash ratios will be skewed by the changing composition of the market, let's turn to the question of valuing this company. For simplicity, let's assume that the cost of equity for investing in the software business is 10% and that the expected growth in income from software is 2% in perpetuity. If we assume that the company can maintain its existing return on equity of 36% on its new investments in perpetuity, the value of the software business is:

  • Expected net income from software = $72 million
  • Expected reinvestment to generate growth = 2%/36% = 5.56%
  • Value of Software business = 72 (1-.0556)/ (.10-.02) = $850 million
The cash is invested in liquid, riskless investments earning 2% (pre-tax). The fact that cash earns a low rate of return does not make it a bad investment, because that low rate of return is what you should expect to make on a short-term, riskfree investment. If you decide to do an intrinsic valuation of the income from cash, you should discount the income at the risk free rate:
  • Expected pre-tax income from cash = $ 200 (.02) = $4 million
  • Cost of equity = Riskfree rate = 2%
  • Value of equity = 4/.02 = $200 million
The intrinsic value balance sheet for this company is shown below:
Note that the software business is now worth a lot more than it was in the accounting balance sheet but that cash value remains unchanged. The value of equity on the balance sheet is an intrinsic equity value.

In pricing, the tool used in comparisons is usually a multiple and the most commonly used multiple is the PE ratio. To set the table for that discussion, I have restated the intrinsic value balance sheet in the form of PE ratios for the software business, cash and equity overall.

The PE ratios for software and cash are computed by dividing the intrinsic values of each one by the after income generated by each. The PE ratio for cash can be simplified and stated as a function of the risk free rate and tax rate:
The PE ratio for cash is much higher than the PE for software (11.81) and it is pushing up the PE ratio for equity in the company to 14.11. Put differently, if the stock is priced based on its intrinsic value, it should trade at a PE ratio of 14.11.

How will bringing in debt into this process change the game? Let's assume that you borrowed $300 million and bought back stock in this company, while leaving the existing cash balance unchanged. Reducing your market cap by roughly $300 million will augment the effect of cash on PE and make the non-cash PE ratio even lower.

Cash Balances and PE: Determinants
In the market, we observe the PE ratios for equity in companies, and those PE ratios will be affected by both how much cash the company holds and the interest rate it earns on that cash.  To the extent that cash balances (as a percent of value) vary across time, across sectors and across companies, the conclusions we draw from looking at PE ratios can be skewed by these variations. To observe how much of an impact the cash holdings have on the observed PE ratio for a company, I varied the cash balance in my software company from 0% to 50% of the intrinsic value of the company; at 50%, the cash balance is $850 million and is equal to the value of the software business. The PE ratio for equity in the company is shown in the graph below, with the cash effect on PE highlighted:


The effect of holding cash is accentuated when the interest rate earned on cash, which should be a short term risk free (or close to risk free) rate, is low relative to the cost of equity. In the table below, I highlight the interest rate effect, by holding the cost of equity fixed at 8% and varying the risk free rate from 1% to 5%:
Thus, a cash balance that amounts to 20% of firm value will push PE ratios from 15.38, when the short-term, risk free rate is 1% and to only 14.08, when it is 5%.

It is true that companies with global operations are accumulating some of their cash overseas to avoid US taxes. Bringing in trapped cash into this process is easy to do and requires you to separate cash balances into domestic and trapped cash; the biggest problem that you face is getting that information, since most companies are not explicit about the division. While the domestic cash balance is its stated value, the trapped cash will see its value reduced by the expected tax liability that will be incurred when the cash is repatriated (which will require assumptions about when that will be and what the differential tax rate paid on repatriation will amount to.)

The US Market: PE and Cash
At this point in this discourse, you may be wondering why we should care, since companies in the US have always held cash and had to earn close to a short-term risk free rate on that cash. That is true but we live in uncommon times, where risk free rates have dropped and corporate cash holdings are high, as is evidenced in this graph that looks at cash as a percent of firm value (market value of equity+ total debt) for US companies, in the aggregate, from 1962 to 2015 and the one-year treasury bill rate (as a proxy for short term, risk free rates):
Data from Compustat & FRED: Computed across all money-making companies
With short-term risk free rates hovering around zero and cash balances close to historical highs, you would expect the cash effect on PE to be more pronounced now than in the past. To measure this effect, I computed PE ratios and non-cash PE ratios each year for US companies, using the following equations:

The interest income from cash was estimated using the average cash balance during the course of the year and average one-year T.Bill rate for that year. In the graph below, I look at the paths of both measures of PE from 1962 through 2014. Note that while while both series move in the same direction, the divergence has become larger since 2008; in 2014, the non-cash PE was almost 30% lower than the conventional PE.

Update: The PE effect is large, especially in the last five years. It is perhaps being exaggerated by the inclusion of financial service firms in the sample, since cash and short term investments at these firms can be huge and are really not comparable to cash holdings at other companies. If you remove them from the sample, the cash effect does get smaller. Rather than pick and choose which data I will report, I have included the year-by-year averages for the US for four sets of data: all companies, only non-financial service companies, all money-making companies and all non-financial money-making companies in this link

I know that the talk of a bubble gets louder each day, and while there may be legitimate reasons to worry about the level of stock prices, those who base their bubble arguments entirely on PE ratios (normalized, adjusted, current) may need to revisit their numbers. All of the versions of the PE will be "pushed up" by the cash holdings of US companies and the low interest rate environment that we live in.

Sector Differences in Cash and PE
Cash balances have varied not only across time but they are also different across sectors and within sectors, across companies. Consequently, comparing PE across sectors or even across companies within a sector, without adjusting for cash, can be dangerous, biasing you away from companies with large cash balances (which will look expensive on an unadjusted PE) and especially so during periods of low interest rates.

In the first part of the analysis, I estimated cash as a percent of firm value, PE ratios and non-cash PE for each sector in 2014. (I eliminated financial service companies from my sample, since I am not sure that I can categorize cash as a non-operating asset for these companies). While all of the industry averages can be downloaded at the link below, the sectors where the cash effect on PE was greatest are listed below:

In the second part of the analysis, I computed the cash effect on PE for individual companies and then looked at the distribution of this cash effect across all companies:


It delivers the message that there is no simple rule of thumb that will work across all companies or even across companies within a sector.

Perhaps, the best way to check out the effect of cash on PE is to pick a company and take it through the cleansing process, a very simple one that requires relatively few inputs. Use this spreadsheet to try it on your favorite (or not-so-favorite) company.

Rules for dealing with cash
In an investing world full of complications, simple measures like PE retain their hold because they are easy to compute and easy to work with. However, there is a price that we sometimes pay for this simplicity, and in periods like this one, where interest rates are at historic lows, we may need to reassess how we use these measures to compare companies. In particular, I think we have to separate companies into their cash and operating parts, and deal with the two separately, because they are so different in terms of risk and earnings power. Thus, it we are using multiples, enterprise value multiples will work better than equity multiples, and with equity multiples, non-cash versions (where the cash is stripped from market capitalization and net income is cleansed of the cash effect) will be more reliable than cash versions. This will also mean that the time honored way of estimating PE, i.e., dividing the market price today by the earnings per share, will have to be replaced by an approach where we use use aggregated market value, cash and earnings, rather than per share numbers. 

Spreadsheets

  1. Intrinsic value of cash and operating assets (to back up example in post)
  2. PE Cleanser (to compute non-cash PE for a company)

Datasets

  1. Cash and non-cash PE ratios by year: All US companies
  2. Cash and non-cash PE ratios by sector in 2014