Thursday, April 21, 2022

Elon's Twitter Play: Valuation and Corporate Governance Consequences

I am not a prolific user of social media platforms, completely inactive on Facebook and a casual lurker on LinkedIn, but I do use Twitter occasionally, and have done so for a long time, with my first tweet in April 2009, making me ancient by Twitter standards. That said, I tweet less than ten times a month and follow only three people (three of my four children) on the platform. I am also fascinated by Elon Musk, and even more so by his most prominent creation, Tesla, and I have valued and written about him and the company multiple times. When Musk made news a little over two weeks ago, with his announcement that he owned a major stake in Twitter, I could not stay away from the story, and what's happened since has only made it more interesting, as it casts light on just Musk and Twitter, but on broader issues of the social and economic value of social media platforms, corporate governance, investing and how politics has become part of almost every discussion.

The Twitter Story

To get a measure of Musk's bid for Twitter, you have to also understand the company's path to its current status. In this section, I will focus on the milestones in the company's history that shape it today, with an eye on how it may affect how this acquisition bid plays out.

Inception to IPO

Twitter was founded in 2006 by Jack Dorsey, Noah Glass, Biz Stone and Evan Williams, and its platform was launched later that year. It succeeded spectacularly in attracting people to its platform, hitting a 100 million users in 2012, and then doubling those numbers again by 2013, when it went public ,with an initial public offering. In a post on this blog on October 5, 2013, I valued Twitter, based on the numbers in its prospectus:
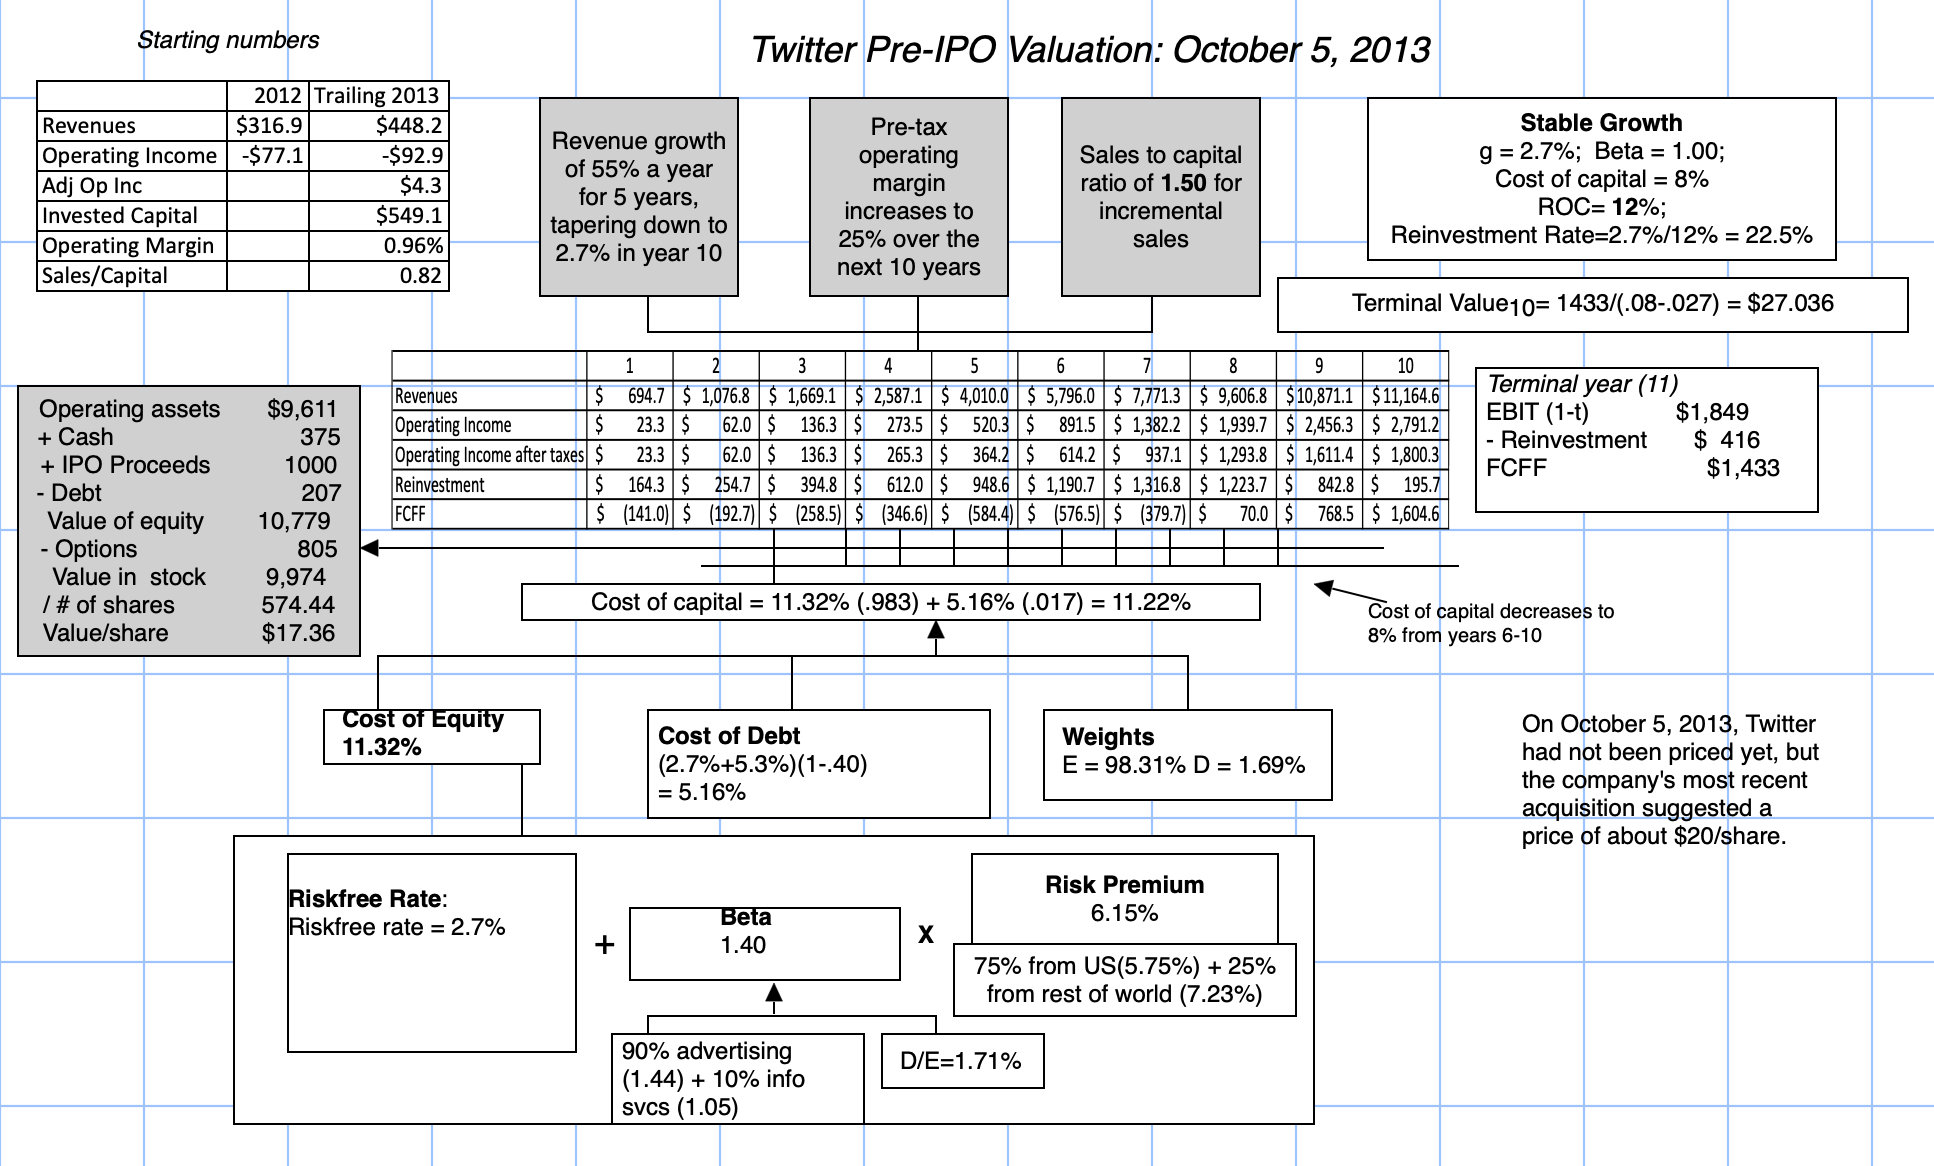
Spreadsheet with valuation

In keeping with my belief that every valuation tells a story, my IPO valuation of Twitter in October 2013 reflected my story for the company, as a platform with lots of users, that had not yet figured out how to monetize them, but would do so over time. My forecasted revenues for 2023 of $11.2 billion and predicted operating margin of 25% in that year reflected my optimistic take for the company, with substantial reinvestment (in acquisitions and technology) needed along the way (as seen in my reinvestment). A few weeks later, the offering price for Twitter's shares was set at $26, by its bankers, and the stock debuted on November 7, 2013, at $45. In the weeks after, that momentum continued to carry the stock upwards, with the price reaching  $73.31 by December 26, 2013. 

If the story had ended then, the Twitter story would have been hailed as a success, and Jack Dorsey as a visionary. But the story continues...

The Rise and Fall of Jack Dorsey

In the years since its IPO, the Twitter story has developed in ways that none of its founders and very few of its investors would have predicted. On some measures of user engagement and influence, it has performed better than expected, but in the operating numbers measuring its success as a business, it has lagged, and the market has responded accordingly

Users: Numbers and Engagement

In terms of user numbers, Twitter came into the markets as a success, with 240 million people on its platform in November 2013, at the time of its public offering. In the years since, those user numbers have grown, as can be seen in the chart below:

In keeping with disclosure practices at other user-based companies, in 2017, Twitter also started tracking and reporting the users who were most active on its platform, by looking at daily usage, and counting daily active users (DAU). While total user numbers have leveled off in recent years, albeit with a jump in 2021, the daily active user count has continued to climb. 

Over the last decade, the company's platform, and the tweets that show up on it, became a ubiquitous part of news, culture and politics, as politicians used the platform to expand their reach and spread their ideas and celebrities built their personal brands around their followers. Looking at the list of the Twitter persona with the most followers provides some measure of its reach, with a mix of politicians (Barack Obama, Narendra Modi), musicians (Justin Bieber, Katy Perry, Taylor Swift, Ariana Grande), celebrities (Kim Kardashian) and sporting figures (Cristiano Ronaldo). Sprinkled in the list are brands/businesses (YouTube, CNN Breaking News), with millions of followers, though relatively few business people make the list, with Elon Musk being the exception.  It is worth noting that many of the people on top follower list tweet rarely, and that behavior is mimicked by many of the users on the platform, many of whom never tweet. The bulk of the tweets on the platform are delivered by a subset of users, with the top 10% of users delivering 80% of the tweets. 

While there are multiple reasons that Twitter users come to the platform, the demographics of its platform provides some clues, especially when contrasted with other social media platforms:

Pew Research

Twitter's user base skews younger, more male, more educated and more liberal than the US population, and especially so, when compared with Facebook, which has the biggest user base.

Revenues, Profits and Stock Prices

As Twitter user base and influence have grown, there has been one area where it has conspicuously failed, and that is on business metrics. The company's revenues have come primarily from advertising (90%) and while these revenues have grown, they have not kept up with user engagement, as can be seen in the chart below:

In the last few years, revenue growth has flattened, again with the exception of 2021, and while operating margins have finally turned positive in the last five years, there has been no sustained upward movement. To give a measure of Twitter's disappointing performance, note that the company's actual revenues in 2021 amounted to $5.1 billion, well below the $9.6 billion I estimated in 2021 (year 8 in my IPO valuation) as revenues in my IPO valuation of the company in November 2013, and its operating margin, even with generous assumptions on R&D, was 19.02% in 2021, still below my estimate of 19.76% in that year. 

The disappointments on the operating metric front has played out in markets, where Twitter's stock price dropped to below IPO levels in 2016 and its performance has lagged its social media counterparts:

Source: Bloomberg

In fact, Twitter's stock prices did not breach their December 2013 high of $73.31 until February 26, 2021, when the stock peaked at $77.06, before dropping back to 2013 levels again by the end of the year. The company that provides the best contrast to Twitter is Snapchat, another company that I valued at the time of its IPO in February 2017 at $14.4 billion, with a value per share of $10.91. Like Twitter, Snapchat had a rousing debut in the market, rising 40% to hit $24.48 on its first trading day, before falling on hard times, as Instagram undercut its appeal. The stock dropped below $6 in 2019, before mounting a comeback in 2021. While Snap is a younger company than Twitter, a comparison of the operating metrics and user numbers yields interesting results:

Looking at the 2021 numbers, Snap now has more daily active users than Twitter, but delivers less in revenues and is still losing money. That said, the market clearly either sees more value in Snap's story or has more confidence in Snap's management, since there is a wide gap in market capitalizations, with Snap trading at a premium of 60% over Twitter.

Corporate governance

While Twitter can be faulted on many of its actions leading into and after its IPO, there is one area where credit is due to the company. In a period when companies, especially in the tech sector, fixed the corporate governance game in favor of insiders and incumbents, by issuing shares with different voting classes, Twitter stuck to the more traditional model, with equal voting right shares.  It is also worth noting that Twitter came into its IPO, with a history of bloodletting at the top, with Jack Dorsey, who led the company at the start, getting pushed aside by Evan Williams, his co-founder, before reclaiming his place at the top. In fact, at the time of its IPO, Twitter's CEO was Dick Costolo, but he was replaced by Dorsey again, a couple of years later. Dorsey's founder status gave him cover, but his ownership stake of the company was not overwhelming enough to stop opposition. As disappointment mounted at the company, the murmuring of discontent became louder among Twitter shareholders, especially since Jack divided his top executive duties across two companies, Twitter and Square, both of which demanded his undivided attention.  

The corporate governance issues at Twitter came to a head in 2020, when Elliott Management, an activist hedge fund, purchased a billion dollars of Twitter stock, and demanded changes. While Dorsey was successful in fighting off their demands that he step down, he surprised investors and may company employees when he stepped down in November 2021, claiming that he was leaving of his own volition. That may be true, but it seemed clear that the relationship between Dorsey and his board of directors had ruptured, and that the departure might not have been completely voluntary. As a replacement, the board did stay within the firm in picking a successor, Parag Agrawal, who joined Twitter as a software engineer in 2011 and rose to become Chief Technology Officer in 2017.

The Musk Entree!

It is ironic that the threat to Twitter has come from Elon Musk, who has arguably used its platform to greater effect than perhaps anyone else on it. There are some Twitter personalities who have more followers than Musk, but most of them are either inactive or tweet pablum, but Musk has made Twitter his vehicle for selling both his corporate vision and his products, while engaging in distractions that sometimes frustrate his shareholders. While he has made veiled promises of alternative platforms for expression, it was a surprise to most when he announced on April 4, 2022, that he had acquired a 9.2% stake in the company. Stock prices initially soared on the announcement, but what has followed since has been one of the strangest corporate chronicles that I have ever witnessed, as you can see in the time line below:

This post is being written on April 19, and the only thing that is predictable is that everything is unpredictable, at the moment, and that should come as no surprise, when Musk is involved.

The Value Arguments: Status Quo and Potential

While Musk's acquisition bid is anything but conventional, the gaming that it initiated on the part of Twitter, the target company, and Musk, the potential acquirer, was completely predictable. The company's initial response was that it was worth great deal more than Musk's offering price, and that Twitter shareholders would be receiving too little for their shares if they sold. Musk's response was that the market clearly did not believe that current management could deliver that higher value, and that he would be able to do much better with the platform.

Twitter's argument that Musk was lowballing value, by offering $54.20 per share for the company,  and that the company was worth a lot more is not a novel one, and it is heard in almost every hostile acquisition, from target company management. That argument can sometimes be true, since markets can undervalue companies, but is it the case with Twitter? To answer that question, I valued Twitter on April 4, at about the time that Musk announced his 9.2% stake, updating my story to reflect a solid performance from the company in 2021, and with Parag Agrawal, its newly anointed CEO:

Spreadsheet with Twitter Status Quo Value

In my story, which I view as upbeat, given Twitter's inability to deliver on operating metrics in the last decade, I see continued growth in revenues, with revenues reaching almost $13 billion in 2033, and a continued increase in operating margins to 25%, not quite the levels you see at the dominant online advertising players (Facebook and Google), but about what you would expect for a successful, albeit secondary, online advertising platform. (Note that I am capitalizing R&D expenses to give the company healthier margins right now, to begin my valuation). The value per share that I obtained was about $46, $ 4 higher than the prevailing stock price, but below Musk's acquisition offer of $54.20.

To the critique that revenue growth could surprise and that margins could be higher, my answer is of course, and to incorporate the uncertainty in my inputs, I fell back on one of my favored devices for dealing with uncertainty, a Monte Carlo simulation. I picked three variables, the revenue growth over the next five years, the target operating margin and the initial cost of capital, to build distributions around, and the results of the simulation are below:

The median value in the simulation is $45.17, close to the base case valuation, but at least based on my estimates, Musk's offering price is at the 75th percentile of value. It is possible that the value could be higher but making that is not a particularly strong argument to make, if you are Twitter's board.

Competing Views: The Fight for Twitter

As a company that has lived its entire life on the promise of potential, it should come as no surprise if that is where the next phase of this argument heads. In particular, Twitter's management will claim that the company's platform has the potential to deliver significantly more value, either by changing the business model (and including subscriptions and other revenue sources) or fine tuning the advertising model. On this count, Musk will agree with the argument that Twitter has untapped potential, but counter that he (and only he) can make the changes to Twitter's business model to deliver this potential. In short, investors will get to choose not only between competing visions for Twitter's future, but also who they trust to deliver those visions.

The problem that Twitter's management will face in mounting a case that Twitter is worth more, if it is run differently, is that they have been the custodians of the company for the last decade, and have been unable or unwilling to deliver these changes. Shareholders in Twitter will welcome management's willingness to consider alternative business models, but the timing makes it feel more like a deathbed conversion rather than a well thought through plan. Elon Musk's problem, on the Twitter deal, is a different one. If you think Jack Dorsey was stretching the limits of his time by running two companies, I am not sure how to characterize what Musk will be doing, if he acquires Twitter, since he does have a trillion dollar company to run, in Tesla, not to mention SpaceX, the Boring company and a host of other ventures. In addition, Musk's unpredictability makes it difficult to judge what his end game is, at least with Twitter, since he could do anything from selling his position tomorrow to bulldozing his way through a poison pill, taking Twitter down with him. I know that there are question of how Musk  finance the deal and whether he can secure funding, but of all of the impediments to this takeover, those might be the easiest to overcome. The fact that Twitter's stock price has stayed stubbornly below Musk's offering price suggests that investors have their doubts about Musk's true intentions, and whether this deal will go through.

Alternate Endings

No matter what you think about Elon Musk and how his acquisition bid will play out, it is undeniable that he has put Twitter in play here, and that it is likely that the company that emerges from this episode will look different from the company that went into it. In particular, I see four possible outcomes for Twitter:

  1. Status Quo: It is possible that Twitter wins this round with Musk, and that the poison pill adopted by the board is sufficient to get him to walk away from the deal, perhaps selling his holdings along the way. The existing management go back to their plans for incremental change that they have already put in motion, and hope that the payoffs of higher revenue growth and profitability will unlock share value. 
  2. Musk takes Twitter private: Having spent more than a decade seeing Musk pull off what most market observers would view as impossible, I have learned not to underestimate the man. For Musk to succeed at this point, he has to be able to buy enough shares in a tender offer and/or convince other shareholders to put pressure on the board to remove the poison pill, and allow him to move forward with his plans. The odds are against success, but then again, this is Elon Musk.
  3. Independent, but with corporate governance changes: Even if Twitter is able to fend off Musk, the way that the company's management and board have handled the deal does not inspire confidence in their ability to run the company. In fact, having gone through five CEOs over Twitter's life, it is worth asking the question whether the dysfunction at the company lies with the board, and not just with the CEO. In this scenario, institutional investors will follow through by pushing for change in the company, translating into new board members and perhaps even a new CEO.
  4. Someone else acquires Twitter: There may be something to Musk's claim that the changes that are needed to make Twitter a functional business can only be made, if it is taken private. If so, it is  the board may be willing to sell the company to someone other than Musk, albeit at a slightly higher price (if for no other reason than to save face). The fact that the buyer may be Silver Lake, a firm that Musk has connections with, or another private equity investor, whose plans for change are similar to Musk's, will mean that Elon Musk will have accomplished much of what he set out to do, without spending $43 billion dollars along the way or having to deal with the distractions that owning Twitter will bring to his other, more valuable, ventures.
If I were to put these possibilities in terms of likelihood, I would put "staying independent with significant corporate governance changes" as most likely, followed by someone else acquiring Twitter, with the status quo and Musk succeeding getting the lowest odds.

Political Markets?

In this discussion, I have deliberately stayed away from the elephant in the room, which is that this is , at its core, a political story, not a financial one. To see why, consider a simple test. If you tell me which side of the political divide you fall on, I am fairly certain that I will be able to guess whether you favor or oppose Musk's takeover bid. As with most things political, you will provide an alternate, more reasoned, argument for why you are for or opposed, but you are deluding yourself, and hypocrisy is rampant on both sides.  

  • If you are opposed to the deal, and your argument is that billionaires should not control social media platforms, that outrage cannot be selective, and you should be just as upset about Jeff Bezos owning the Washington Post or a George Soros bid for Fox News. If it is Musk's personality that you feel is what makes him an unsuitable owner, I wonder whether we should be requiring full personality tests of the owners of other media companies.
  • If you are for the deal, and it is because you want Twitter to be a bastion of free speech, it is worth remembering that every social media platform is involved in some degree of censoring, for legal reasons and self preservation. It should also be noted that while those disaffected with Twitter have attempted to build their own social media platforms, they still get far more mileage from their presence on Twitter than from their posts on alternate platforms, and the complaints about Twitter not being balanced seem to end up being on Twitter.
The hand wringing from pundits about changes that may or may not be coming to Twitter, and the impact it will have on our collective consciousness, to be over wrought. In fact, some critics of Musk seem to have decided that Twitter, in its current form, is a national treasure that needs to be preserved or at least protected from money grubbing barbarians. I beg to differ. The brevity (of having to compress your thoughts into 280 characters) and timeliness of Twitter's platform has made it the place to go to get breaking news, but the notion that it is an educational platform shortchanges the meaning of learning, and the impulsiveness that it encourages from users is a recipe for tweeting remorse, or worse. I believe that while there are some who come to Twitter for news and witty repartee, many come to the platform for the same reasons that they slow down on highways to look at car crashes, i.e., to witness, and sometimes partake in, deranged arguments about trivial issues. Much as we like to complain about the ugliness and anger that we see on social media, it is exactly those forces that draw users to it, and arguing that Elon Musk will make it worse, misses the point that he symbolizes the strengths and weaknesses of the Twitter platform better than any other person walking the face of the earth. 

YouTube Video


Spreadsheets

Monday, March 28, 2022

ESG's Russia Test: Trial by Fire or Crash and Burn?

My views on ESG are not a secret. I believe that ESG is, at its core, a feel-good scam that is enriching consultants, measurement services and fund managers, while doing close to nothing for the businesses and investors it claims to help, and even less for society. That judgment may be harsh, but as the Russian hostilities in Ukraine shake up markets, the weakest links in the ESG chain are being exposed, and as the same old rationalizations and excuses get rolled out, I believe that a moment of reckoning is arriving for the concept. If you remain a true believer, I will leave it up to you to decide how much damage has been done to ESG, and what comes next.

The ESG Response To Russia

When Russian troops advanced into Ukraine in late February, the reverberations across markets were immediate. Stock, bond and commodity markets all reacted negatively, and at least initially, there was a flight to safety across the world. Since one of ESG's sales pitches has been that following it’s precepts would insulate companies and investors from the risks emanating from bad corporate behavior, both ESG advocates and critics have looked to its performance in this crisis, to get a measure of its worth. I am not an unbiased observer, but the reactions from ESG defenders to this crisis can be broadly categorized into three groups.

1. The Revisionists

In the last decade, as ESG has grown, I have been awed by the capacity of some of its advocates to attribute everything good that has happened in the history of humanity to ESG. If these ESG revisionists are to be believed, if companies had adopted ESG early enough, there would have been no banking crisis in 2008, and if investors had screened stocks for ESG quality, they would not have lost money in the corporate scandals and meltdowns of the last decade. In the last week of February 2022, in the immediate aftermath of this crisis, there were a few ESG supporters who argued that ESG-based investors were less exposed to the damage from the crisis. That was quickly exposed as untrue for three reasons:

  • ESG measurement services missed the Russia Effect: There is no evidence that Russia-based companies had lower ESG scores than companies without that exposure. In my last post, I looked at four Russian companies, Severstal, Sberbank, Yandex and Lukoil, all of which saw their values collapse in the last few weeks. When I checked their ESG rankings on Sustainalytics ranked each on February 23, 2022, each of them was ranked in the top quartile of their industry groups, though they all seem to have been downgraded since, with the benefit of hindsight. In a short piece in the Harvard Law Forum on Corporate Governance, Lev, Demeers, Hendrikse and Joos, highlight the absence of a Russia effect on ESG ratings with a simple comparison of ESG scores of companies with and without Russia exposure:

    Unlike them, I will not argue that failing to foresee the Russian invasion of Ukraine is an ESG weakness, but it certainly cannot be presented as a strength.
  • Following the ESG rulebook after the crisis has been a losing strategy: It is true that the emphasis on climate change that skews ESG scores lower for fossil fuel and mining companies would have kept you from investing in Lukoil and Gazprom, among other Russian commodity companies, but it would also have kept you from investing in other companies in these sectors, operating in the rest of the world. As I noted in my last post on Russia, that would have kept you out of the best performing sector since Russia invaded Ukraine. In short, if there is a lesson that this crisis has taught us, it is that treating fossil fuel producers as evil, when they produce much of the energy that we use, is delusional. 
  • ESG funds/lenders lost substantial amounts in Russia: Investment funds and lenders who have long touted their ESG credentials do not seem to have been less exposed than non-ESG funds, early reports notwithstanding. A Bloomberg Quint study of ESG funds uncovered that they had $8.3 billion invested in Russian equities on February 23, 2022, almost all of which was wiped out during the next few weeks. In fact, the saving grace for ESG funds has been the fact that Russia did not have a large investable market, for both ESG and non-ESG funds.
In the weeks after the war, hundreds of US and European companies have announced that they were leaving Russia, and ESG advocates have pointed to this exodus as evidence that its practices are now mainstream.  I would push back against the narrative that these companies were giving up lucrative businesses, because of their consciences:
  • Small presence in Russia: In my last post, I noted that the Russian economy represents a sliver (about 2%) of the global economy. If you add the reality that Russia has a closed economy, with well established barriers to outsiders, most of the US companies pulling out of Russia are not giving up much business to begin with. In fact, for companies like Goldman Sachs, whose primary business in Russia came from acting as intermediaries between Russian businesses/investors and investors in the rest of the world, there is a question of whether any business was left to give up, after sanctions were put in place. The companies with the biggest presence in Russia are oil and commodity companies, primarily involved in joint ventures with Russian entities, where the pull out may be designed to preempt what would have been nationalization or expropriation in the future.
  • Risk Surge and Economic Viability: In my last post, I noted the surge in Russia's default spread and country risk premium, making it one of the riskiest parts of the world to operate in, for any business. Many companies that invested in Russia, when it was lower-risk destination, have woken up to a new reality, where even if their Russian projects return to profitability, the returns that they can deliver are  well below what they need to make to break even, given the risk. Put simply, exiting Russia makes economic sense for most companies, and it may be cloaked in morality, but it is easy to pick the moral path, when economics and morality converge.
  • Suspension versus abandonment: It is telling that many companies that have larger interests in Russia, with perhaps the possibility that investing will become economically viable again, have suspended their Russian operations, rather than abandoning them. These companies will undoubtedly come under pressure from activists, who will try to shame them into leaving, but if that is the best that ESG can do, it is pitiful.
For those who continue to insist that the corporate reaction to the Russian invasion is a sign of moral awakening at companies, I propose a thought experiment. If China had invaded Taiwan, do you think that companies would have been as quick to abandon their Chinese holdings and business? Do you think that investment funds would have been so quick to write off their Chinese holdings? On a more personal level, would you be willing to give up all things “Chinese”, as quickly as you were willing to give up drinking Russian vodka? They are hypothetical questions, but I think I know the answer. 

2. The Expansionists

As the evidence has mounted that ESG, at least as constructed, failed to provide protection to companies and investors from the Russia fallout, there are a few in the ESG movement who have argued that the fix is to expand the definition and measurement of ESG to incorporate Russia-like risks. That is easier said than done, though, because as with all things ESG, those risks are in the eyes of the beholder. For some, it will mean bringing in the nature of governments into ESG measures, with companies in countries with authoritarian governments getting lower ESG scores than companies in countries with democratic governments. Even if you believe that expansion is defensible, and that considering political risk when valuing companies is prudent, it will mean that every ESG measurement service will have the unenviable task of assessing political freedom (or its absence) in a company's operating geographies, to evaluate its ESG score. Taking a bigger picture perspective, using the benefit of hindsight to keep expanding ESG to include the missed variables in each crisis will lead to measurement bloat, as it grows more tentacles and adds more dimensions. Ultimately, if ESG tries to measure everything, it ends up measuring and meaning nothing.

On a different note, the events of the recent weeks have also pointed to the elasticity of the ESG concept. In the weeks right after the war started, two Citigroup analysts suggested that companies making weapons be classified as good companies, as long as they were selling them to the “right” side of the conflict. While ESG advocates were dismissive, I think that what the Citigroup analysts were proposing is more in line with the true nature of ESG, an amorphous, anything goes concept that shifts shape and form, depending on who is defining it, and when.

3. The Utopians

There is a group within the ESG movement that has been unfazed by any critiques of ESG or evidence that it has not done what it set out to do. To these true believers, the problems with ESG come from it being misappropriated, mis-measured and misused, and in their view, ESG, done right, will always deliver its promised rewards. I call this group the "if only" chorus, since in their view, if only services measured ESG correctly, if only companies did not indulge in greenwashing, and, if only, ESG funds did not pick under performers, ESG would work at making the world a better place. I believe that their wait for this awakening will be long because:

  1. ESG mis-measurement is endemic, not transient: Even ESG measurement services are willing to admit that the current ESG ratings for companies are flawed, but they all contend that better measurement is around the corner, premised on two assumptions. The first is that ESG disclosures will improve, as regulators force companies to reveal more about their environmental and social performance, and that this data will improve measurement. The second is that as ESG ages, we will develop consensus on what comprises goodness, and when that occurs, there will be a higher correlation across services. I don't believe that either assumption is realistic. Drawing on the experience with corporate governance and stock based compensation, both areas where the volume of disclosure has ballooned over the last two decades, I would argue that disclosure has actually created more distraction than clarity, and I don't see why ESG will be any different. As for converging on what comprises “good”, why in God’s name, in a world where everything is partisan, would you expect consensus to magically form in the investment community? In fact, if a consensus on measurement occurs across services on how to measure ESG, it will be driven more by marketing concerns (since the differences across ratings is getting in the way of selling the concept) than by learning.
  2. Greenwashing is an ESG feature, not a bug: There is probably no phenomenon on which there is more handwringing among ESG types than "greenwashing", where companies substitute "looking good" for "doing good". Those complaints, though, ignore an unpleasant truth, which is that greenwashing is exactly the outcome of making ESG a system of scores and rankings. I am willing to take a wager with any ESG true believer that the more ESG services and regulators try to crack down on greenwashing, the more ubiquitous and sophisticated it will become. The largest and most profitable companies will have the resources to game the system better, exacerbating biases that already exist in current ESG scores.
  3. ESG Investing underperformance is steady state, not a passing phase: For the last decade, ESG sales pitches were helped out by the seeming over performance of ESG-based investing, though almost all of the out performance could be attributed to ESG's tech focus and sector concentrations. As the market has shifted, and ESG-based strategies are now under performing, ESG investment fund managers are scrambling, trying to explain to clients why this is just a  passing phase, and that good days are just around the corner. That is nonsense! In steady state, once the components of ESG that matter get priced in, ESG-constrained funds will deliver lower returns than funds that don't operate under those constraints. As I noted in one of my earlier posts on ESG, arguing that a constrained optimal can consistently beat an unconstrained optimal is sophistry, and the fact that some of the biggest names in the investment business have made these arguments tells us more about them than it does about ESG.
  4. ESG is not about actual change, but the perception of change: Over the last decade, ESG advocates have argued that even if following ESG precepts does not increase shareholder value or generate higher returns, it does good for society, by stopping bad practices. Some of ESG's biggest "wins" have been in the fossil fuel space, with Engine Number 1's success in forcing Exxon Mobil to adopt a smaller carbon footprint, being presented as a prime exhibit. Under investment pressure, there is no denying that publicly traded oil companies, primarily in the West, have scaled back their search for oil and gas, and sometimes scaled back and sold reserves. The key word here is "sold", since those reserves have often been bought by private equity investors, who have collectively invested more than a trillion dollars in fossil fuel reserves and development over the last decade. Is it any surprise then that despite all of the ESG wins, the world remains overwhelmingly dependent on fossil fuels? In fact, all that ESG activists have managed to do is move fossil fuel reserves from the hands of publicly traded oil companies in the US and Europe, who would feel pressured to develop those reserves responsibly, into the hands of people who will be far less scrupulous in their development. If this is what winning looks like in the ESG world, I would hate to see what constitutes losing!
If you are an optimist on ESG, you may keep seeing light at the end of the tunnel, but the more this concept plays out, the more likely it is that the light you are seeing is that of a train bearing down on you. 

The Next Big Thing?

When a concept is as widely sold and bought into as ESG, it is unlikely to be abandoned in a hurry, no matter how much evidence accumulates that it does not work or that it has perverse consequences. In my experience, though, hollow concepts that promise the world and deliver little, eventually hit a tipping point, where even the most loyal adherents abandon them and move on. That moment will come for ESG, and if you are an ESG consultant, advisor or measurer, you will need something to replace its place, the next big thing, that you can sell as the answer to every question in business. Playing the role of a cynic, I will offer you a five step process that you can use to develop this "next big thing", which for generality, I will call “it”.

  1. Give "it" a name: Give your next big thing a name, and pick one that sounds good, and if you want to add an aura of mystery, make it an acronym, with three letters seeming to do the trick, in most cases.
  2. Give "it" meaning and purpose: As you write the description of the word or acronym, make that description as fuzzy as possible, preferably throwing in the word "long term" and "good for the world" into it, for good measure. (See step 5 for why this works in your favor.)
  3. Use history to reverse engineer it’s components: Before you add specifics to your description, examine business and investing history, focusing on the most successful, and looking for characteristics that they share in common in terms. To round “it” out, you should also find failures and see what common features bind them together. Then incorporate these characteristics into your description, with the shared features of successful companies as your must-haves, and those of the failures are things to avoid.
  4. Use self-interest to sell "it": To get the business establishment behind you, draw on its powerful drivers, self interest, greed and self delusion. If you have done your job well in step 3, you will have no trouble gaining institutional support, since you have already primed the pump. Case writers and consultants should have no trouble finding supporting cases studies and anecdotal evidence, academic researchers will unearth statistical evidence that your concept works and investment fund managers will unearth its capacity to create "alpha" in past returns.  
  5. Delay and deflect: If you get pushback from critics or those with evidence that is contradictory, attribute failures to growing pains and argue that what is needed is a doubling down of fidelity to the concept. Since you have provided no clear or even discernible targets, you can always move the goalposts or claim to have accomplished what you set out to, and thus not be held accountable. Finally, use the “goodness” shield, since that makes any questioning of your big idea seem small minded and mercenary.
So, what will the next big thing be? I don't know for sure, but I am willing to make a guess, since so many ESG experts and advocates have slipped into already using it as an alternative. It is "sustainability", a word that can mean whatever you want it to mean. In its most benign form, I believe that it is just another word for "long term", though the only benefit of replacing one set of words with another is that it offers a chance for those using the new and updated word to state the obvious, claim the outrageous and charge the absurd. In its more malignant form, it becomes a way to try to keep corporations alive forever, a dreadful idea, where zombie and walking dead companies suck up capital and resources, and drag the rest of us down into the abyss with them. 

Conclusion

When I first wrote about ESG two years ago, I did so because I was skeptical of the unquestioning belief that people had in its success. I initially believed that it was a flawed concept that needed fixing , but after two years of interactions with people who claim to know the concept really well, but don't seem to be capable of making solid cases for it, and witnessing its takeover by well heeled entities with agendas, I am convinced that there will soon be room for only two types of people in the ESG space. The first will be the useful idiots, well meaning individuals who believe that they are advancing the cause of goodness, as they toil in the trenches of ESG measurement services, ESG arms of consulting firms and ESG investment funds. The second will be the feckless knaves, who know fully well the void behind the concept, but see an opportunity to make money. I know that those are not edifying choices, but I don't see any good ones, other than leaving the space completely. Good luck!

YouTube Video

Blog Posts on ESG

  1. Sounding good or Doing good? A Skeptical Look at ESG
  2. ESG: The Goodness Gravy Train rolls on (September 2021)

Saturday, March 19, 2022

Russia in Ukraine: Let Loose the Dogs of War!

As the world's attention is focused on the war in the Ukraine, it is the human toll, in death and injury, that should get our immediate attention, and you may find a focus on economics and markets to be callous. However, I am not a political expert, with solutions to offer that will bring the violence to an end, and I don't think that you have come here to read about my views on humanity. Consequently, I will concentrate this post on how this crisis is playing out in markets, and the effects it has had, so far, on businesses and investments, and whether these effects are likely to be transient or permanent.

The Lead In

To understand the market effects of the Russia-Ukraine conflict, we need to start with an assessment of the two countries, and their places in the global political, economic and market landscape, leading in. Russia was undoubtedly a military superpower, with its vast arsenal of nuclear weapons and army, but economically, it has never punched that weight. Ukraine, a part of the Soviet Union, has had its shares of ups and downs, and its economic footprint is even smaller. The pie chart below, provides a measure of the gross domestic product of Russia and Ukraine, relative to the rest of the world:

While Russia's share of the global economy is small, it does have a significant standing in the natural resource space, as a leading producer and exporter of oil/gas, coal and nickel, among other commodities. Ukraine is also primarily a natural resource producer, especially iron ore, albeit on a smaller scale.


Russia was also a leading exporter of these commodities, with a disproportionately large share of its oil and gas production going to Europe; in 2021, Russian gas accounted to 45% of EU gas imports.

The Market Reaction

   As the rhetoric of war has heated up in the last few months, markets were wary about the possibility of war, but as Russian troops have advanced into the Ukraine, that wariness has turned to sell off across markets. In this section, I will begin by looking at the bond market effects and then move on to equities and other asset classes, starting by looking at the localized reaction (for Ukranian and Russian securities) and then the global ripple effects.

Bond Markets and Default Risk

    In times of trouble, the first to panic are often lenders to the entities involved, and in today's markets, the extent of the reaction to country-level troubles can be captured in real time in the sovereign CDS (Credit Default Swap) markets. The graph below shows the sovereign spreads for Russia and Ukraine in the weeks leading up and including the conflict:


The sovereign CDS spread for Russia, which started the year at 1.70% soared above 25%, just after hostilities commenced, and were trading at 10.56% on March 16, after rumors that peace talks were underway brought them down. The sovereign CDS spread for the Ukraine started the year at 6.17% and climbed in the first few days of the crisis to more than 100% (effectively uninsurable) before settling in on March 16 at 28.62%. Even the ratings agencies, normally slow to act, have been moving promptly, with Moody's lowering Russia's rating from Ba2 to B3 on March 3, from B3 to Ca on March 6 and from Ca to C on March 8, and Ukraine's rating from B3 to Caa2 on March 4. Other ratings agencies have also taken similar actions.
    The worries about default have not stayed isolated to Russia and Ukraine, as ripple effects have shown up first in the countries that are geographically closest to the conflict (Eastern Europe) and more generally on sovereign CDS spreads in the rest of the world. The graph below looks at average spreads, by region, before and after the hostilities started:

Change in Sovereign CDS, by Region
There are no surprises in this table, with the effects on spreads being greatest for East European countries. Note, though, that while sovereign CDS spreads increased almost 51% between January 1, 2022 and March 16, 2022, in these countries, the overall riskiness of the region remains low, the average spread at 1.30%. The Middle East is the only region that saw a decrease in sovereign CDS spreads, as oil, the primary mechanism for monetization in this region, saw its price surge during the last few weeks. The Canadian sovereign CDS spread widened, but US and EU country spreads remained relatively stable.
    The increase in default spreads was not restricted to foreign markets, as fear also pushed up spreads in the corporate bond market. In the table below, I look at default spreads on bonds in different ratings, across US companies, on January 1, 2022 and March 16, 2022:

It is worth noting that corporate bond spreads, which were are at historic lows to start the year, were already starting to widen before Russia's military moved into the Ukraine on February 24, 2022, but the invasion has pushed the spreads further up at the lower ends of the default spectrum. The overriding message in all of this data is that Russia/Ukraine war has unleashed fears in the bond market, and once unleashed that fear has pushed up worries about default and default risk premia across the board.

Equity Markets and Equity Risk Premiums

    Lenders may be the first to worry, when there is a crisis that puts their payments at risk, but equity investors are often with them, pushing down stock prices and pushing up equity risk premiums. Again, I will start with Russian and Ukranian equities, using country indices to capture the aggregate effect on these markets, from the invasion:

Russia: RTX Russian Traded $ Index, Ukraine: Ukraine PFTS Index
Neither index is particularly representative, and currency effects contaminate both, but they tell the story of devastation in the two markets. In fact, since trading has been suspended on both indices, the extent of the damage is probably understated. To get a better sense of how Russian equities, in particular, have fared in the aftermath of the invasion, I looked at four higher profile Russian companies,:

The four Russian companies that I picked are representative of the Russian economy: Lukoil is a stand-in for Russia's oil businesses, Sberbank is Russia's most dynamic bank, a part of almost every aspect of Russian financial services, Severstal is a global steel company with roots and a significant market share in Russia and Yandex is Russia's largest technology company. In addition to being traded on the MICEX, the Russian exchange, these companies all have listings in foreign markets (Yandex has a US listing and the other three are listed on the London Exchange). The collapse in stock prices has been calamitous, with each of the four stocks losing almost all of their value, and with trading suspended since the end of February, it is still unclear whether the trading will open up, and if so at what price.
A knee-jerk contrarian strategy may indicate that you should be buying all these stocks, as soon as they open for trading, but a note of caution is needed. The price drop in these companies, especially severe at Sberbank, is not necessarily an indication that these companies will cease to exist, but that the Russian government may effectively nationalize them, leaving equity worthless.
    As Russian equities have imploded, the ripple effects again are being felt across the globe. The table below summarizes the market cap change, by region of the world:
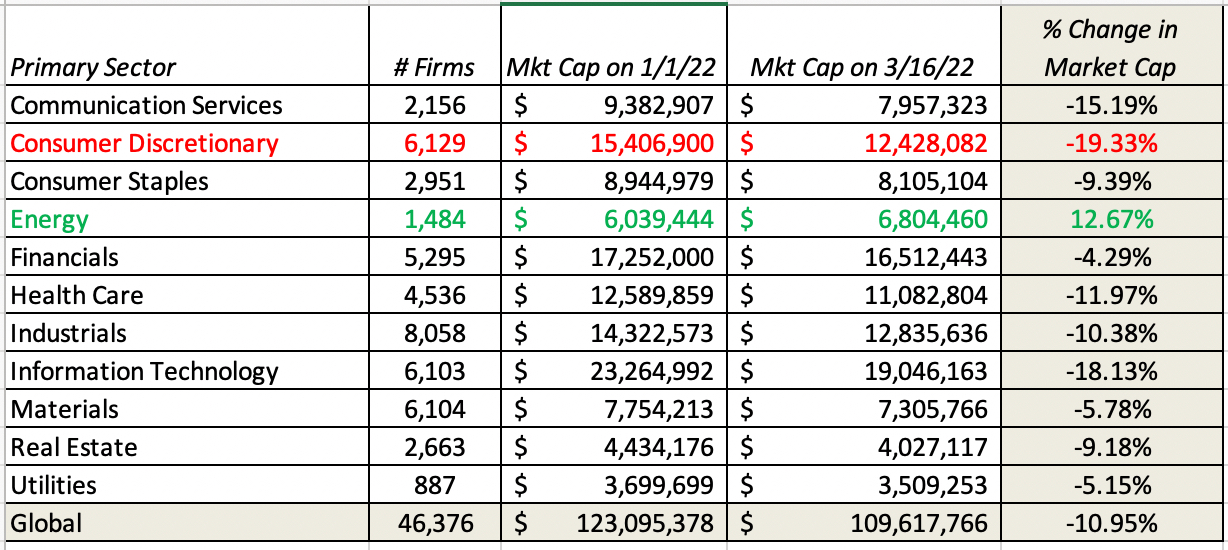
It is no surprise that Eastern Europe and Russia, which are in the eye of the hurricane, have seen the most damage to equities, but other than the Middle East, every other equity market in the world is down, with the US, EU and China shedding significant market capitalization. Slicing the data based on sector yields the following:
Against, there are no surprises, with energy being the only sector to post positive returns and with consumer discretionary and technology generating the most negative returns. Finally, I looked at firms based upon price to book ratios as of January 1, 2022, as a rough proxy for growth/maturity, and at net debt to EBITDA multiples, as a measure of indebtedness:

In this crisis, the conventional wisdom has held, at least so far, with mature companies holding their values better than growth companies. Since these mature companies tend to carry more debt, you see more indebted companies doing much better than less indebted companies. While the value crowd, bereft of victories for a long time, may be inclined to do a victory dance, it is worth noting that the same phenomenon occurred between February and March of 2020, at the start of the COVID crisis, but that growth companies quickly recouped their losses and finished ahead of mature companies by the end of 2020.
   In keeping with my belief that it is the price of risk that is changing during a crisis, causing contortions in prices, I estimated the implied equity risk premium for the S&P 500, by day, starting on January 1, 2022, going through March 16, 2022, in the graph below:
Note that equities were already under pressure in the weeks before the invasion, as inflation fears surfaced again, and then hostilities have put further pressure on them. The implied equity risk premium, which started the year at 4.24%, was  at 4.73% by March 16, and the expected return on equity, which was close to an all-time low at 5.75% at the start of the year, was now up to 6.92%, still lower than historical norms, but closer to the numbers that we have seen in the last decade.

Flight to Safety and Collectibles
    As in any crisis, there was a rush to safety, accentuated by wealthy Russians trying to move their wealth to safe havens, with safety defined not just in terms of currency, but also in terms of being beyond the reach of US and European regulators and legislators. In the graph below, I start with two traditional havens for US investors, the US dollar and treasury bonds:
Trade-weighted dollar & US 10-year T.Bond Rate
The dollar has strengthened since February 23, with the trade weighted dollar rising about 3% in value, but the ten-year treasury bond, after an initial rise in prices (and drop in yields) has reversed course, perhaps as inflation concerns overwhelm safe haven benefits. I also looked at crisis investments, starting with gold, an asset that has held this status for centuries and contrasting it with bitcoin, millennial gold:


Gold, which started the year at just above $1,800 an ounce, rose from $1,850 on February 23 to peak at $2,050/oz a few days ago, before dropping back below $2,000/oz on March 16. Bitcoin, which started the year at about $46,000, had a strong first half of November, also rose at the start of this crisis, but seems to have given back almost all of its gains. To the extent that crypto holdings may be more difficulties for authorities to trace and lay claim on, it will be interesting to see if you see a rise in the prices of crypto currencies as Russian wealth looks for sanctuary.

Economic Consequences

    It is difficult to argue that people were taken by surprise by the events unfolding in the Ukraine, since the lead in has been long and well documented. It can be traced back to 2014, when Russia annexed Crimea, setting in motion a period of uncertainty and sanctions, and the global economy and Russia seemed to have weathered those challenges well. As this crisis plays out in financial markets, roiling the price of risk in both bond and equity markets, the other question that has to be asked is about the long term economic consequences of the crisis for the global economy.

Commodity Prices and Inflation Expectations

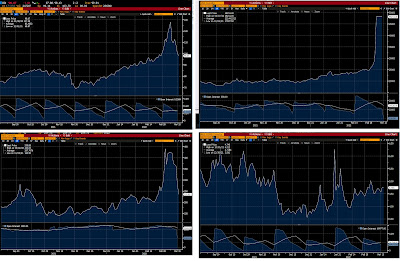
    Given Russia's standing as a lead player in commodity markets, and its role in supplying oil and gas to Europe specifically, it should come as no surprise that the markets for the commodities that Russia produces in abundance has been the most impacted, at least in the short term:

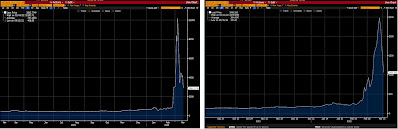
All four commodities saw their prices soar in the aftermath of February 23, with oil rising to $130 a barrel, before falling back below $100, and trading in the nickel market suspended on March 7, after prices rose about $100,000 a ton. Even as prices rose in the spot market, the futures market indicated that many participants believed that the price rise would be temporary, with futures prices closer to $80 a barrel, for a year ahead and two year ahead futures contracts.

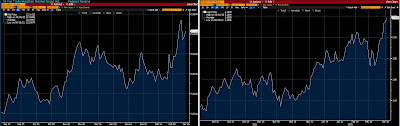
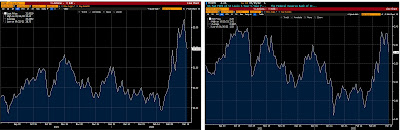
    In a market already concerned about expected inflation, the rise in commodity prices operated as fuel on fire, and pushed expectations higher. In the graph below, I list out two measures of expected inflation, one from a inflation expectations ETF (ProShares Inflation Expectation ETF) and the other from the Federal Reserve 5-year forward inflation measure, computed as the difference between treasury and TIPs rates.

Both measures indicate heightened concerns about future inflation, and these are undoubtedly also behind the increase in the US ten-year treasury bond rate from 1.51% to 2.19%, this year.

Consumer Confidence and Economic Growth

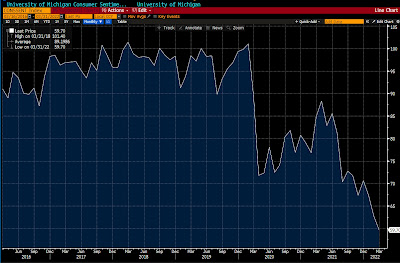
    The question that hangs over not just markets but economic policy makers is how this crisis will affect global economic growth and prospects. It is too early to pass final judgment, but the early indications are that it has dented consumer confidence, as the latest reading from the University of Michigan consumer survey indicates:

University of Michigan Consumer Sentiment

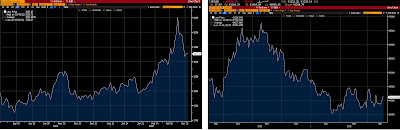
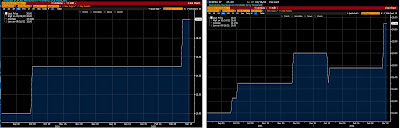
Consumer sentiment is now more negative than it was at any time during the COVID crisis in 2020, and if consumers pull back on purchases, especially of discretionary and durable goods, it will have a negative effect on the economy. While the contemporaneous numbers on the US economy on unemployment and production still look robust, worries about recession are rising, at least relative to where they were before the hostilities. The graph below looks at the median forecasts of recession probabilities for the US, on the left, and for the Eurozone, on the right (from Bloomberg):

Median forecast probability of recession, US (left) and Eurozone (right)

As a result of the events of the last three weeks, forecasters have increased the probabilities of recessions from 15% to 20% for the US and from 17.5% to 25% for the Eurozone.

Investment Implications: Asset Classes, Geographies and Companies

    The Russian invasion of Ukraine has undoubtedly increased uncertainty, affected prices for financial assets and commodities and exacerbated issues that were already roiling markets prior to the invasion. For investors trying to recapture their footing in the aftermath, there are multiple questions that need answers. The first is whether a radical shift in asset allocation is needed, given how these perturbations, across asset classes, geographies and sectors. The second is how the disparate market sell off, small in some segments and large in others, over the last few months has altered the investment potential in individual companies in these segments.  On January 1, 2022, I valued the S&P 500, building in the expectation that the economy would stay strong for the year and that interest rates would rise over the course of time from the then prevailing value (1.51%) to 2.50% over five years, and arrived at a value of 4,320 for the index, about 10.3% lower than the traded value of 4766. While that was only ten weeks ago, the index has since shed 7.03% of its value, the T.Bond rate has risen to 2.19% and Russia's invasion of the Ukraine have increased commodity prices and the likelihood of a recession. I revisited my valuation of the index, with the updated values:

Spreadsheet to value the S&P 500

There are two things to note in this valuation. The first is that I have raised the target rate for the US T.Bond to 3%, reflecting both the increase that has already occurred this year, and concerns about how current events may be adding to expected inflation. The second is that I continue to use analyst estimates of earnings, and at least as of this week (with estimates from March 14, 2022), analysts do not seem to be lowering earnings to reflect recession concerns. That may either reflect their belief that this storm will pass without affecting the US economy significantly or a delay in incorporating real world concerns. If you open the spreadsheet, I offer you the option of adjusting expected earnings, if you believe analysts are being unrealistic in their forecasts. The net effect of the changes is that my estimated value of the index is now 4197, making the index over valued by 5.6% as of March 16, 2022.
    More generally, the question that investors face as they decide whether to reallocate their portfolios is whether the market has over or under reacted to events on the ground. 
  • If you are a knee-jerk contrarian, your default belief is that markets over react, and you would be buying into the most damaged asset classes, which would include US, European and Chinese stocks (worst performing geographies), and especially those in technology and consumer discretionary spaces (worst performing sectors), and selling those investments (energy companies and commodities like oil,  that have benefited the most from the turmoil. 
  • If, on the other hand, you believe that investors are not fully incorporating the effects of the long term damage from this war, you would reverse the contrarian strategy, and buy the geographies and sectors that have benefited already and sell those that have been hurt. 
As an avowed non-market-timer, I think that both these strategies represent bludgeons in a market that needs scalpels. Rather than make broad sector or geographic bets, I would suggest making more focused bets on individual companies. In picking these companies, market corrections, painful though they have been, have opened up possibilities, for investors, though their stock picks will reflect their investment philosophies and their views on economic growth:
  1. Discounted Tech: During the course of 2022, markets have reassessed their pricing of tech stocks, and marked down their market capitalizations, for both older, and profitable tech and young, money-losing but high growth tech. A few weeks ago, I posted my valuation of the FANGAM stocks and noted that only one of them was under valued, at the prices prevailing then. In the last few days, every company on the list has dipped in price by enough to be at least fairly valued or even cheap. While there may be value in some young tech companies, any investments in these firms will be joint bets on the companies and a strong economy, and with the uncertainties about inflation and economic growth overhanging the market, I would be cautious.
  2. Safety First: If you have been spooked by market volatility and the Russian crisis, and believe that there is more volatility coming to the market in the rest of the year, your stock picks will reflect your fears. You are looking for companies with pricing power (to pass through inflation) and stable revenues, and in my view, and while you should start by looking in the conventional places (branded consumer products and food processing, pharmaceuticals), you should also take a look at some of the big names in technology.
  3. The Russia Play: For the true bargain hunters, the wipeout of market capitalization of Russian stocks (like Sberbank, Severstal, Lukoil and Yandex) will create temptation, but I would offer two notes of caution. The first is that you have to decide whether you can buy them in good conscience, and that is your judgment to make, not mine. The second is that corporate governance at Russian companies, even in their best days, is non-existent, and I do not know how this crisis will play out in the long term, at these companies. After all, your ownership stake in these companies is only as good as the legal structure backing it up, and in Russia, that your stake may be worthless, even if these companies recover. A less risky route would be to tag companies with significant exposure to Russia, such as Pepsi, McDonald's and Philip Morris, and evaluate whether the market is overreacting to that exposure. I have seen no evidence, so far, that this is the case, but that may change.
There is one final sobering note to add to this discussion, and that relates to low probability, potentially catastrophic events, and how markets deal with them. There is a worst case scenario in the Russia-Ukraine war, that few of us are willing to openly consider, where the conflagration spreads beyond the Ukraine, and nuclear and chemical weapons come into play. While the probability of this scenario may be very low, it is not zero, and to be honest, there is no investing strategy that will protect you from that scenario, but market pricing will reflect that fear. If we escape that doomsday scenario, and come back to something resembling normalcy, markets will bounce back, and in hindsight, it will look like they over reacted in the first place, even if the risk assessments were right, at the time. Put simply, assuming that crises will always end well, and that markets will inevitably bounce back, just because that is what you have observed in your lifetime, can be dangerous.

YouTube Video


Spreadsheets
Datasets


Sunday, February 27, 2022

Data Update 5 for 2022: The Bottom Line!

The proverbial bottom line for success in business is the capacity to deliver profits, at least in the long term. Even though we live in an age where user platforms and hyper revenue growth can drive company valuations, that adage remains true. In fact, questions about profitability seem to have taken center place again, not only because a market pull back is a reminder that growth, by itself, cannot deliver value, but also because there are still unresolved debates about how much damage the COVID crisis did to earnings power at companies, and whether this damage has been healed, as economies have opened up. In this post, I will look at corporate profitability, in all its different dimensions, and how companies across the globe, and across industries, measured up in the most recent years. 

Measuring Profitability
    The question of whether a company is making or losing money should be a simple one to answer, especially in an age where accounting statements are governed by a myriad of rules, and a legion of number-crunchers follow these rules to report profits generated by a firm. In practice, though, measuring profitability is anything but straightforward, as accountants have devised multiple measures of profitability, reserving discretion on how to compute each one, and many different ways of scaling these profits, for comparisons.

Accounting Profit Measures
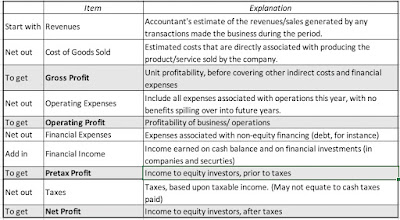
    To understand the different measures of accounting profit, let us look at how each measure of profit is computed in an income statement. In the table below, I describe four different measures of earnings in an income statement, from gross profit, the most aggregated profit measure, to net profit, the earnings left for equity investors after taxes:

For non-financial service firms, the gross profit is a measure of what companies earn on the products/services that they sell, net of what it costs them to produce those products/services. Netting out other operating expenses, that are not directly tied to producing the goods and services (such as selling and G&A expenses), from gross profits, yields operating income. Income from financial holdings (including cash balances, investments in financial securities and minority holdings in other businesses) are added back, and interest expenses on debt are subtracted out to get to taxable income. After paying taxes on this income, the residual amount represents net income, the final measure of equity earnings, and the basis for computing earnings per share and other widely used measures of profitability used by equity investors. 
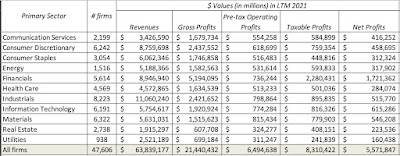
    Looking across all publicly traded companies, listed globally, and aggregating revenues on all four measures of earnings (gross, operating, taxable, net), by sector, and aggregating the numbers yields the following:

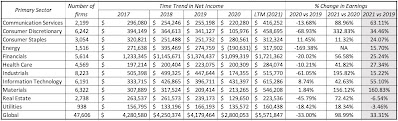
Note that for financial service firms, where debt is raw material (rather than a source of capital) and line between financial and operating assets is difficult to draw,  the only measures of income that are relevant are taxable and net income. That said, about 31% of the net profits of all publicly traded firms listed globally in 2021 were generated by financial service firms; that percent is lower in the US and higher in emerging markets. The last few years have been eventful for all companies, with the COVID crisis and ensuing economic shut down causing pain for companies, with recovery coming in 2021, as the global economy opened up again. In the table below, I report the aggregated net income, by sector, from 2017 to 2021 (with the 2021 numbers representing last twelve month numbers, through September 2021):
It is clear that there was substantial damage done to earnings in 2020, across sectors, with energy, consumer discretionary and industrials showing the most negative effects; across all companies, aggregated earnings declined by 15.03% in 2020. In 2021, companies recovered  entirely from the damage done in 2021, at least in the aggregate, with earnings in 2021 higher than 2019 earnings, by almost 33%. Real estate and utilities are the two sectors that have not come back fully from the COVID effect, but materials, technology and communication services are now reporting significantly higher earnings that before the shut down.

Profit Margins
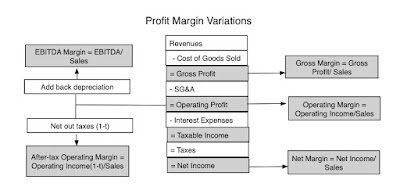
    Comparing absolute profits across companies and across time can be difficult, since larger firms will generate more profits than smaller ones, all else held equal. To make comparisons, profits are scaled to common metrics, with revenues and book value of investment being the most common scalar. When profits are scaled to revenues, you get margins, and as with absolute earnings, margins come in various forms, as can be seen below:

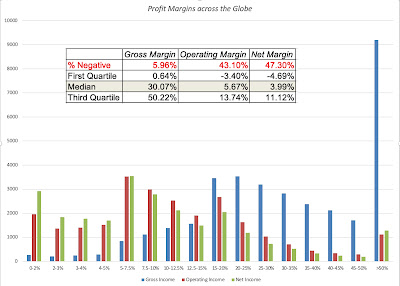
In addition to margins based upon income measures (gross, operating, after-tax operating and net), there are other margin variations, with EBITDA and after-tax operating margins coming into play. To get a sense of variation in margins across companies globally, we looked at the distribution of gross, operating and net margins in 2021:
Earnings from LTM 2021, divided by revenues generated during that period
In computing operating margins, I capitalized R&D for all companies, because R&D is a capital expense, rather than an operating expense, and extended the capitalization of operating leases to all global companies. (IFRS and GAAP now treat as leases as debt, but that is still not the case in many other markets that are not covered by either standard). The numbers yield interesting insights. 
  • First, note that while less than 6% of the 47,606 firms in the sample have negative gross margins, the number is significantly higher for operating margins (43.1%) and net margins (47.3%). 
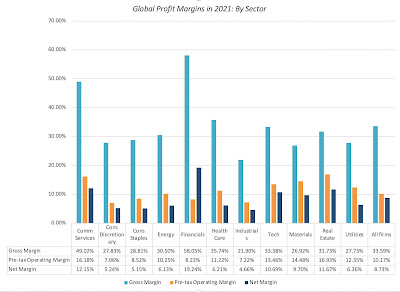
  • Second, while it is no surprise that gross margins are significantly higher than operating and net margins, the magnitude of the difference is striking; the median gross margin across all global companies in 2021 is 30.07%, but it melts down to a median operating margin of 5.67% and a median net margins of less than 4%. These margins vary widely across companies, and in the table below, we report on the statistics across sectors:


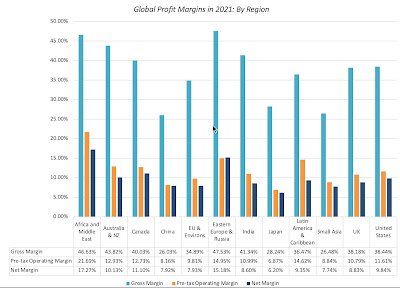
These sectors obviously are broad and each covers a range of industries. If you are interested in industry-level margins, you can find them at this link. In the graph below, I look at differences in margins across geographical regions:

Eastern Europe (including Russia) and Africa contain some risky markets, but firms in those regions have the highest profit margins in the world. One reason is that domestic players in these markets face less foreign competition that companies in the rest of the world. The lowest profit margins in the world are in Asia, with gross margins less than 30% in China, Japan and South East Asia, but India remains an outlier, delivering higher margins. As companies from around the globe look to Asia for growth, the ensuing competition is pushing margins down there, relative to the rest of the world. 

Returns on Invested Capital (or Equity)
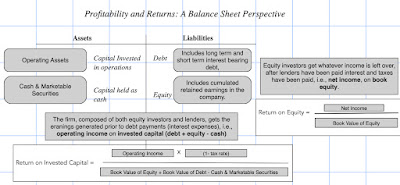
Scaling profits to capital invested in a company provides a different pathway to measuring profitability, with more consequential effects on value. This scaling can either be done from the perspective of just the equity investors in the company, with a return on equity, or from the perspective of all capital providers (debt and equity), with a return on invested capital:

These measures are dependent on accounting estimates of not only earnings, but investment in the firm, in the form of book values of equity and invested capital, and that is their biggest weakness. To the extent that accountants mis-categorize expenses like leases and R&D, returns can be skewed, as can restructuring and one-time charges. With those caveats in place, and with my adjustments to earnings for R&D and lease capitalization, I computed the returns on equity and invested capital for all publicly traded firms at the start of 2022, using earnings in the last twelve months in the numerator and invested capital at the start of those twelve months in the denominator:

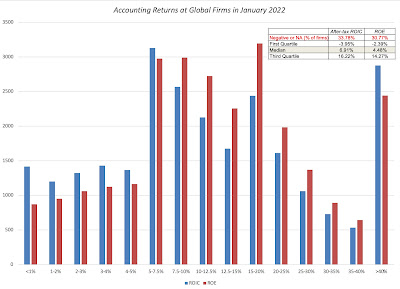
As with margins, almost a third of all firms have negative or missing accounting returns and the median return on equity, in US dollar terms, across all global firms is 4.48%, and the median return on invested capital, in US dollar terms, across firms is 6.91%. In my last post, I noted the decline in costs of capital for firms over time, noting that the median cost of capital at the start of 2022 is only 6.33%, across global firms, and argued that companies that demand double-digit hurdle rates risk being shut out of investments. That point is amplified by the accounting returns computations, since it looks like the actual returns earned by firms on their investments don't meet their own expectations. 

Implications
It is true that profitability measures, standing alone, give you only a snapshot of a company, in time, but used in context, they are conduits for almost every qualitative factor in investing, and put in a framework, a way of thinking of the value of growth and competitive landscapes. 

Business Buzz Words
Buzzwords and catchy phrases has long been part of business, with consultants and experts offering them as recipes for corporate turnarounds, and companies using them to justify everything from acquisitions to significant business course changes. While their allure is understandable, their casual usage can lead to money ill-spent and catastrophic mistakes, and I have long argued that the best way to bring discipline to decision making is to convert these buzzwords into numbers that drive value. Put simply, every action, no matter how consequential it is framed as being, can affect value in one of three ways: by changing the growth trajectory for revenues, by altering the profitability of the business model or by modifying the risk in the business. Just to illustrate, I have a looked at some of widely used buzzwords with a link to profitability: 
BuzzwordProfitability EffectReasoning
Powerful Brand NameHigher operating profit margins, relative to peer groupBrand name allows you to charge higher price for the same products.
Economies of scaleOperating margin improves as revenues increaseCosts grow at a slower rate than revenues
Superior unit economicsHigh gross marginsExtra unit costs little to produce, relative to price.
Strong competitive advantagesHigh return on capital, relative to peer groupBarriers to entry earn and sustain high returns
Canny borrowerHigh return on equity, relative to return on capitalBenefits from difference between return on capital and after-tax cost of debt.
Tax playerAfter-tax operating income is close to pre-tax operating incomeLower effective tax rate, across all income.

Note that I have steered away from the fuzzier phrases, such a "great management", which could mean everything or nothing, or "ESG", where goodness is not only in the eye of the beholder, but finding a link to anything that drives value resembles a wild goose chase.

A Life Cycle View
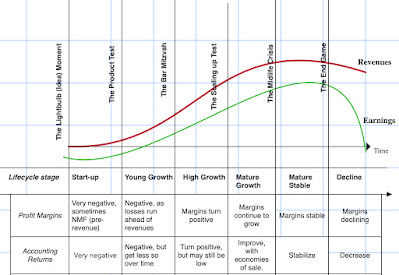
If you have been reading my posts for a while, you know that I find the corporate life cycle a useful device in explaining everything from what companies should focus on, in corporate finance, to the balance between stories and numbers, when investor value companies. Profit margins and returns also follow the life cycle, albeit with wide differences across firms:


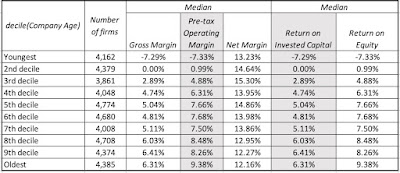
As you can see, young companies tend to be money-losers, and margins improve as companies make it through to maturity, before dropping as companies decline. Accounting returns follow a similar path, though they tend to peak a little later in the cycle, before declining in the last stages of the life cycle again. I am aware that there are many who disagree with my life cycle view of companies, but one way of testing whether it is a reasonable approximation of the real world is to look at the data. In the table below, I report on profit margins and accounting returns for firms, broken down by corporate age (measured from the founding year to 2021), across global companies at the start of 2022:
Corporate Age = Years since founding
It is just one table, but the patterns of margins/returns matches a life cycle view, low for young companies, rising as companies mature, before declining as companies age. 

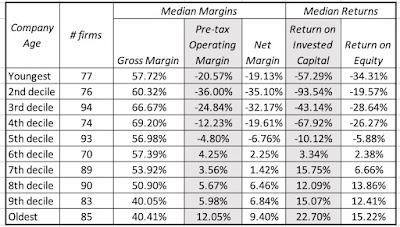
The largest sector, in the US, in terms of market capitalization, is information technology and I have argued that tech companies age in "dog years", with compressed life cycles. The tech sector in the United States is composed of some companies like Apple, Microsoft, HP and Intel, which are ancient by tech company standards, and other companies like Uber, Palantir and Zoom, young and money-losing, that have gone public just in the last few years. In the table below, I break down US tech companies into age cohorts, based upon corporate age (measured from founding year), and looking at profitability measures across these cohorts, in the table below:
All companies in S&P technology sector
This table illustrates the dangers of lumping all tech companies together as high growth or money losing, since older tech companies have become the profit engines in this market, delivering a combination of high margins and accounting returns that the stars of the twentieth century, mostly manufacturing and service businesses, would have envied. It also illustrates why some value investors who have an aversion to all tech companies, often for the most meaningless of reasons (such as not having a tangible book value), have lagged the market for close to two decades.

The Value of Growth
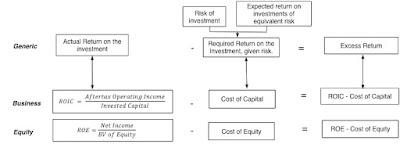
    As investor tastes have shifted from earnings power to growth, there has been a tendency to put growth on a pedestal, and view it as an unalloyed good, but it is not. In fact, growth requires trade offs, where a company invests more back into itself in the near term, denying payouts (dividends or buybacks) to its investors, during that period, for higher earnings in the future. Not surprisingly, then, the net effect of growth will depend on how much is reinvested back, relative to what the company can harvest as future growth. While a full assessment of this value will require making explicit assumptions about growth and reinvestment, there is a short hand that is useful in making this assessment, and that is a comparison of the returns that a company makes on its investments to the cost of funding those investments. If you use accounting returns as a proxy for project returns, and the costs of equity and capital as measures of the costs of funding, you can compute excess returns to equity investors, by comparing return on equity to the cost of equity, and excess returns to all capital providers, by netting cost of capital from return on invested capital:


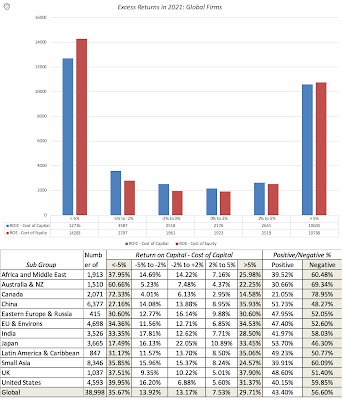
Using the accounting returns and costs of equity/capital that I computed for all publicly traded firms at the start of 2022, I looked at the distribution of excess return measures across companies in the graph below:
Close to 57% of firms globally earn returns lower than their funding costs, and while this may be temporary for some, it has become a permanent feature for many businesses. If you believe that the poor returns that you see in this table are a residue of COVID and economic short downs, I would suggest that you look at data that I have, on excess returns, going back almost a decade, and you will see similar results in the pre-COVID years. I will use this data to draw three broad conclusions:
  1. Low Hurdle Rate ≠ Positive Excess Returns: The notion that lower interest rates, and the resulting lower hurdle rates that companies face, has been a boon for business is clearly not supported by the facts. If anything, as rates have decreased over the last decade, and costs of capital for companies hit historic lows, companies are finding it more difficult to earn returns that exceed their costs of capital. 
  2. Good and Bad Businesses: It is an undeniable truth that some businesses are easier to generate value in, than others, and that a bad business is one where most of the companies operating in it, no matter how well managed, have trouble earning their costs of capital. Using the excess returns estimated from 2021, I estimated the excess returns (ROIC - Cost of capital) in 94 industry groups, and the ten "best" and "worst" industries, in terms of median excess return, are listed below:
    Excess Returns, by Industry (USGlobal)
    If you look at the worst businesses, there are a couple that show up every year, like airlines and hotel/gaming, where COVID exacerbated problems that are long term and structural.  The airline  and hotel businesses are broken, and have been for a long time, and there is no easy fix in sight. Biotechnology companies can claim, with some justification, that their presence on the bad business list reflects the fact that many in the sector are young companies that are a breakthrough away from being blockbuster winners and that they will resemble the pharmaceutical business (which does earn positive excess returns), in maturity. I am sure that there will be ESG advocates who will claim credit for fossil fuel and mining businesses that show up in the worst business list, but not only will their rankings change quickly if oil and commodity prices rises, but the best business of all, in 2021, in terms of delivering excess returns, is the tobacco business, not a paragon of virtue. While the technology boom has created winners in information and computer services, building-related businesses (from materials to furnishings to retail) and chemical companies also seem to have found ways to deliver returns that exceed their costs. 
  3. Disruption's Dark Side: Among the bad businesses, note the presence of entertainment, a historically good business that has seen its business model disrupted, by new entrants into the business. Netflix, in particular, has upended how entertainment gets made, distributed and consumed, and in the process, drained value from established players. While this is a phenomenon that has played out in business after business, over the last two decades, there are a couple of common themes that have emerged in the excess return data. Disruption, almost invariably, leads to lower returns for the status quo, i.e., the disrupted companies in the business, but disruptors often don't end up as beneficiaries. Consider the car business, where ride sharing has destroyed cab and traditional car service businesses, but Uber, Lyft, Didi, Grab and Ola all continue to lose money. Put bluntly, disruption is easy, but making money on disruption is difficult, and disruption creates lots of losers, but does not necessarily replace them with winners.
If I were to sum up my findings, it would be to conclude that generating value from running a business has become more difficult, not less, in the last two decades and that while there are companies that seem to have found pathways to sustainable, high earnings, most companies are involved in trench warfare, fighting disruptors and facing significantly more macro economic risk in their operations.

YouTube Video

Datasets
  1. Profit Margins, by Industry (US, Global, Emerging Markets, Europe, Japan, Australia & NZ)
  2. Return on Capital, by Industry (US, Global, Emerging Markets, Europe, Japan, Australia & NZ)
  3. Excess Returns, by Industry (US, Global, Emerging Markets, Europe, Japan, Australia & NZ)